Flack Capital Markets | Ferrous Financial Insider
March 14, 2025 – Issue #475
March 14, 2025 – Issue #475
Overview:
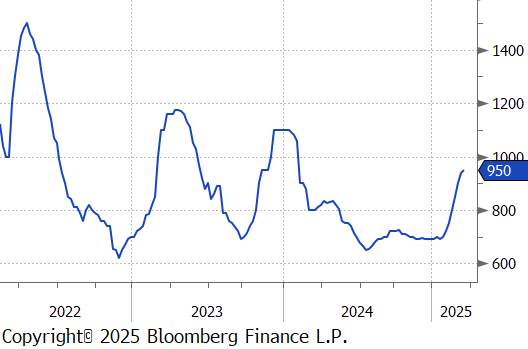
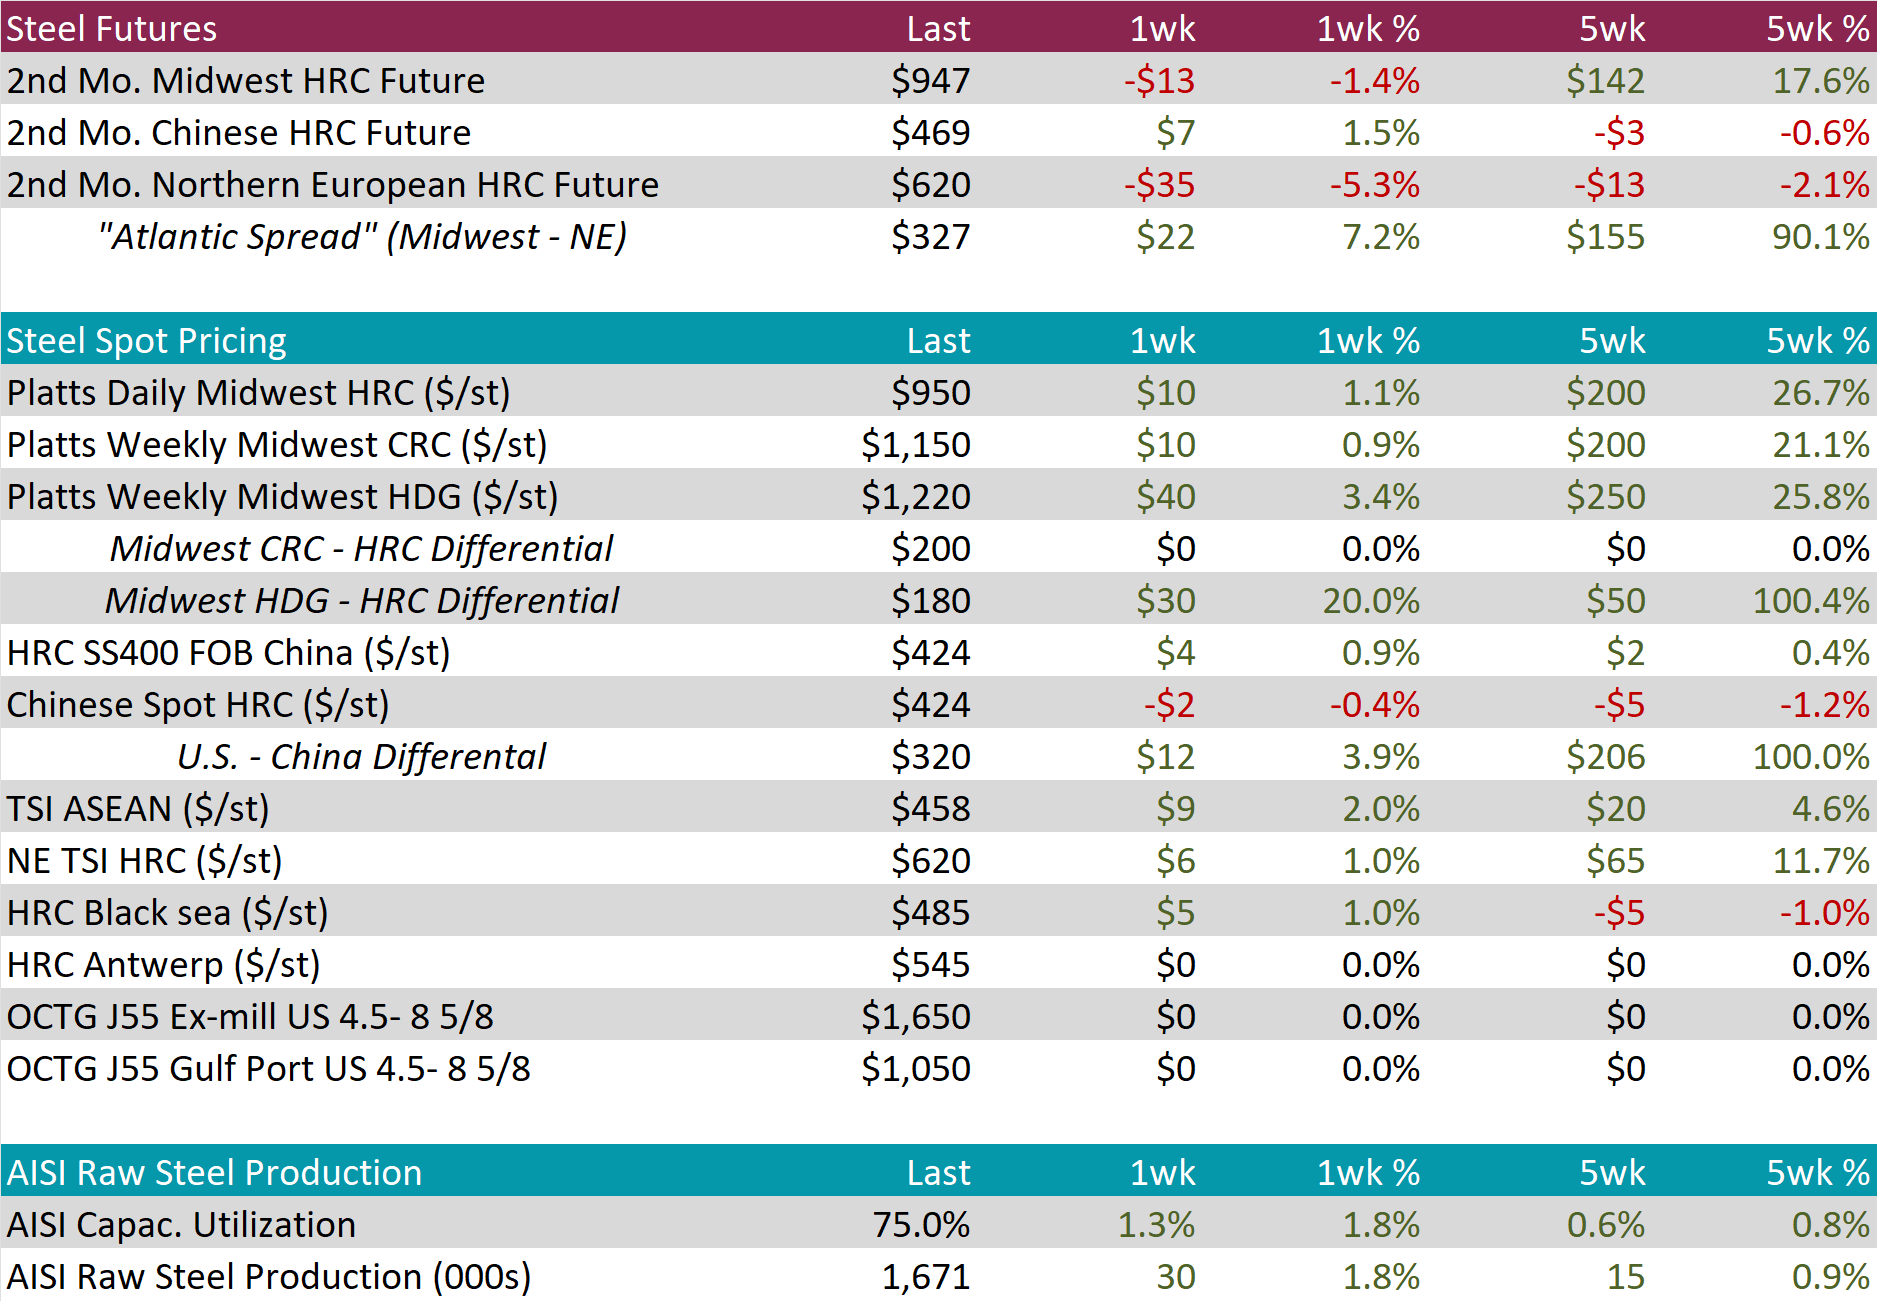
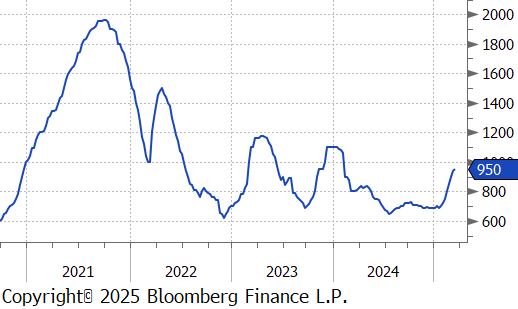
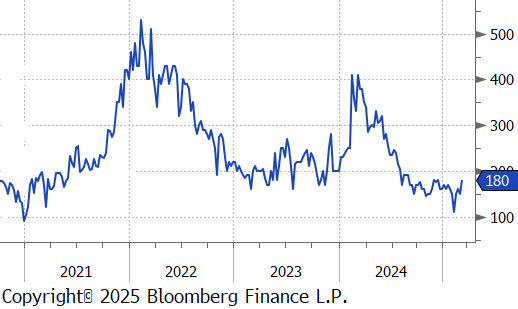
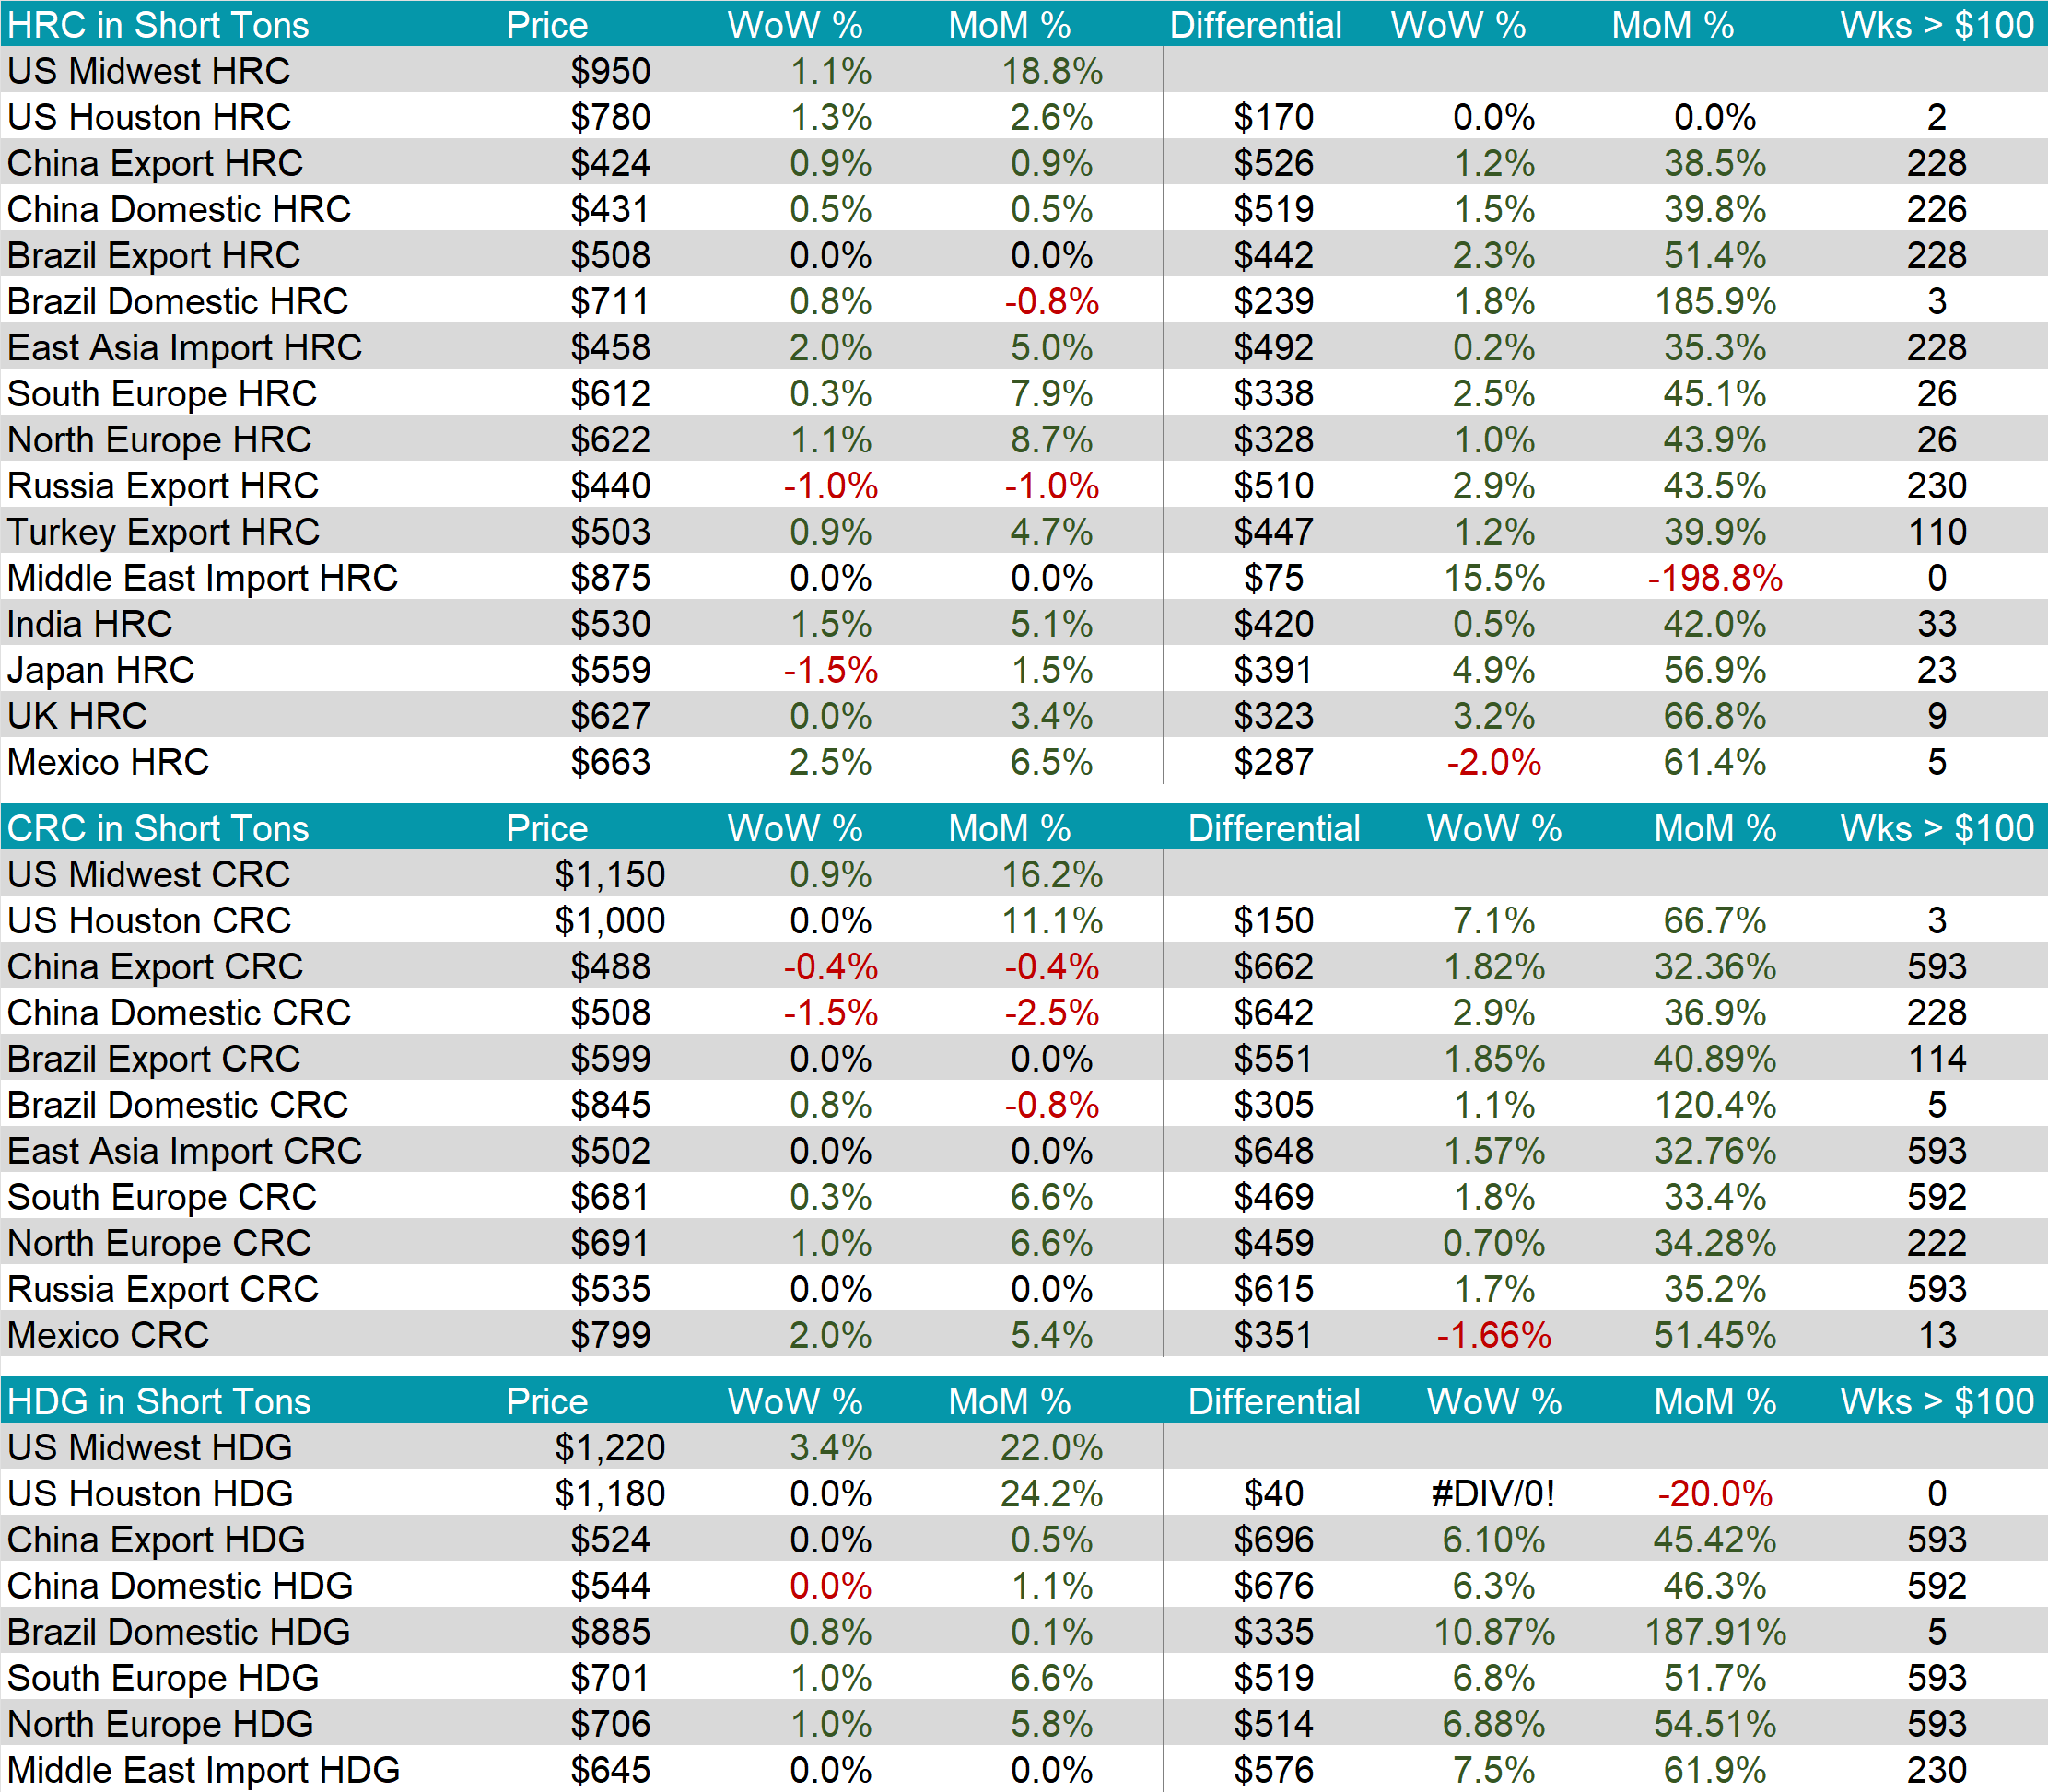
The HRC spot price rose by $10 or 1.1% to $950, marking the eighth consecutive week of increases. At the same time, the HRC 2nd month future declined by $13 or -1.4% to $947, ending six consecutive weeks of increases.
Tandem products both increased, with CRC up by $10 and HDG up by $40, resulting in the HDG – HRC differential to jump up by $30 or 20% to $180.
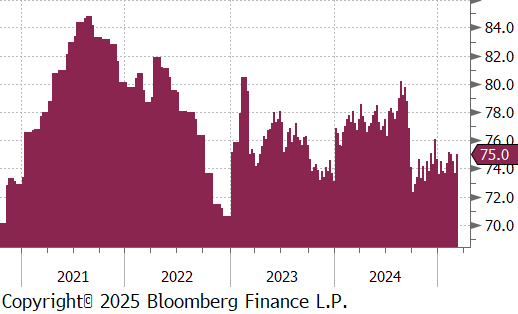
Mill production inched back up, with capacity utilization ticking up by 1.3% to 75.0%, bringing raw steel production up to 1.671m net tons – the highest level in four weeks.
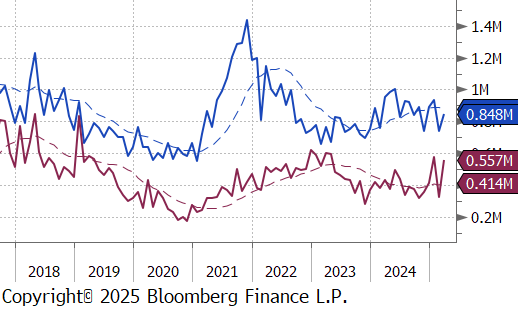
March Projection – Sheet 848k (up 108k MoM); Tube 557k (up 227k MoM)
February Projection – Sheet 741k (down 195k MoM); Tube 329k (down 251k MoM)
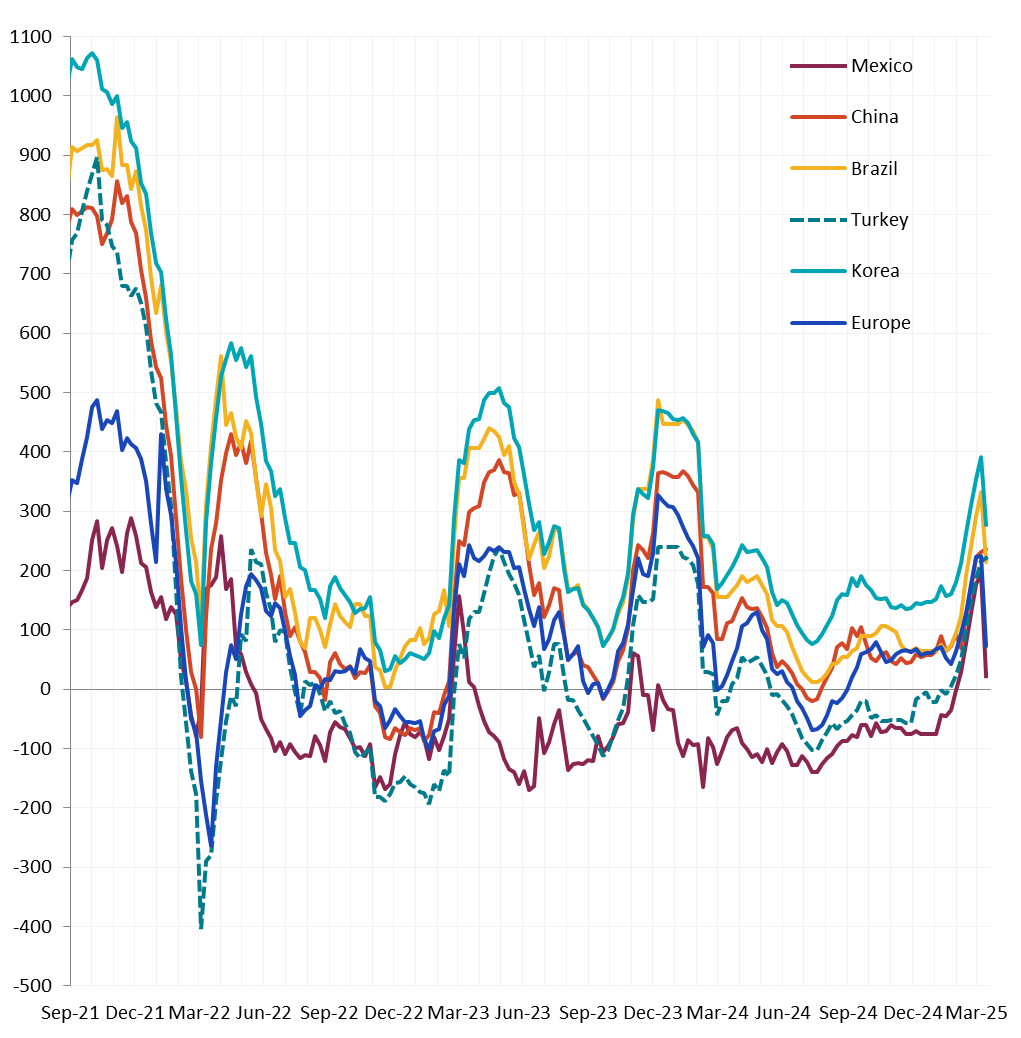
Differentials shrunk mainly due to tariffs. Price changes were: Korea HRC was up 2.0%, China Export HRC was up 0.9%, N Europe HRC was up 1.1%, Turkey Export rose by 0.9%, while Russia Export fell by -1.0%.
Scrap
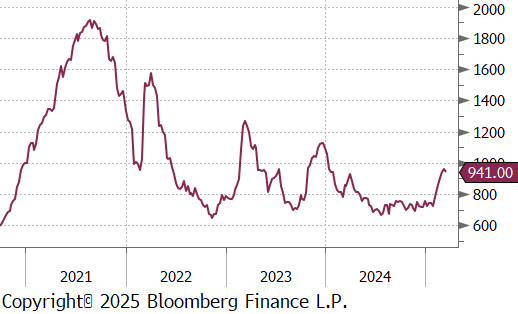
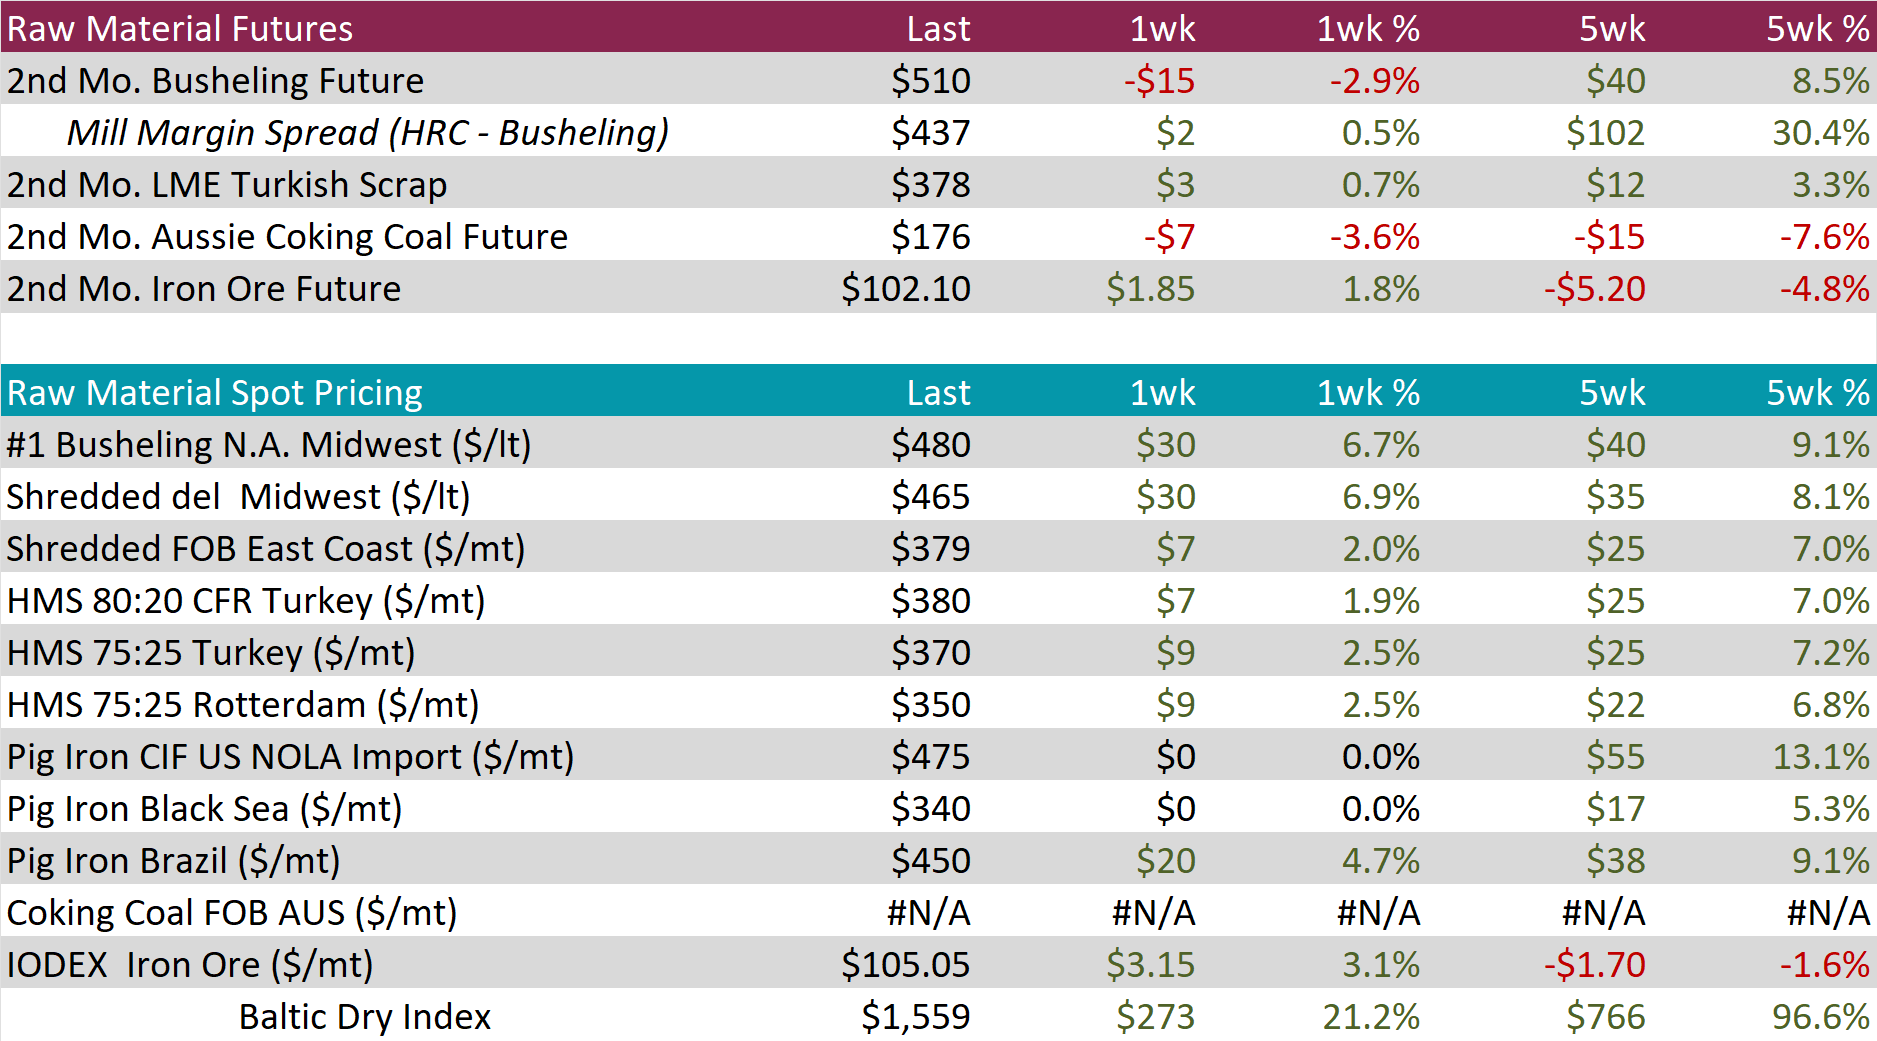
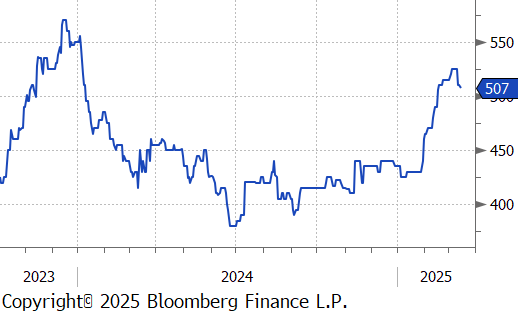
The busheling 2nd month future fell by $15 or -2.9% to $510, retreating after hitting the highest level since December 2023 last week.
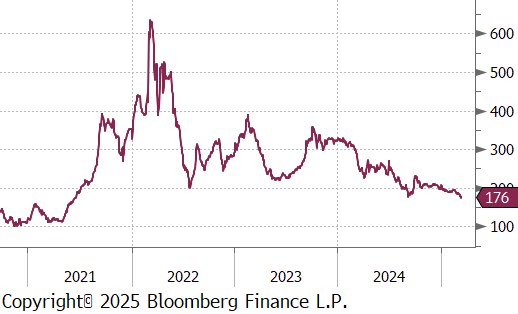
The Aussie coking coal 2nd month future slipped by $7 or -3.6% to $176, marking the third consecutive week of declines and the lowest level since June 2021.
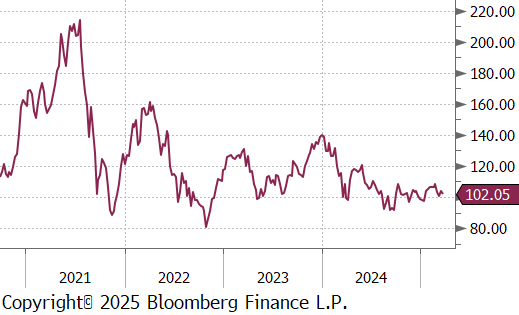
The iron ore 2nd month future inched up by $ 1.85 or 1.8% to $102.10, rebounding after two consecutive weeks of declines.
Dry Bulk / Freight
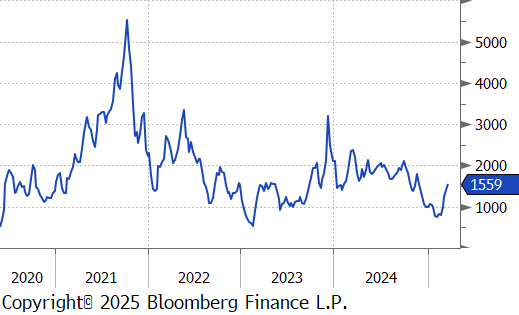
The Baltic Dry Index increased by $273 or 21.2% to $1,559, rising for the fourth straight week, reaching the highest level since November 2024.
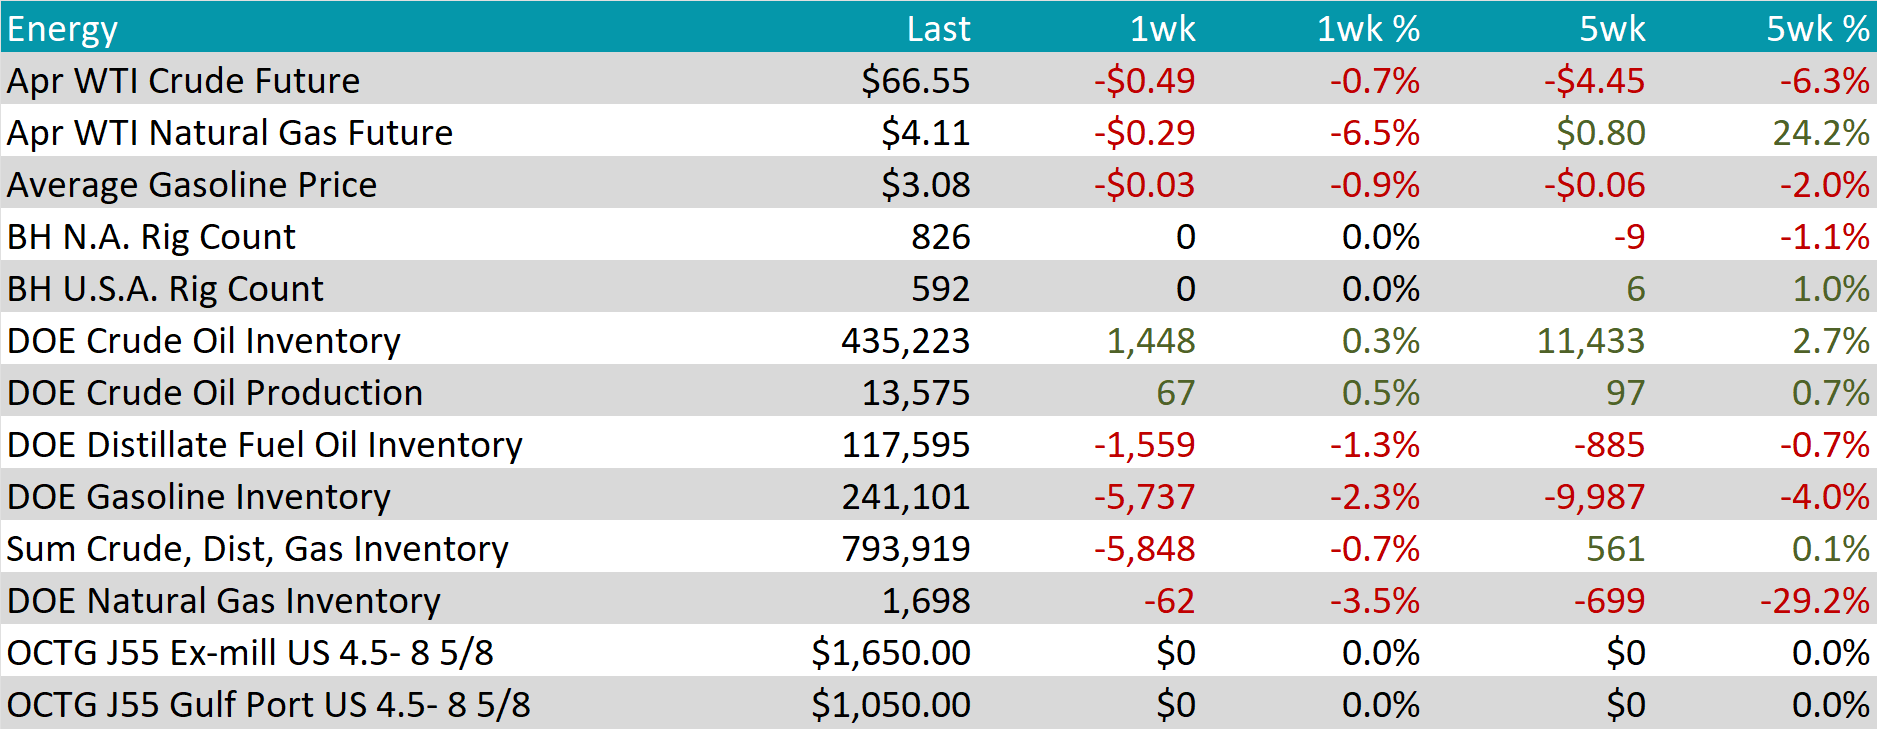
WTI crude oil future lost $0.49 or -0.7% to $66.55/bbl.
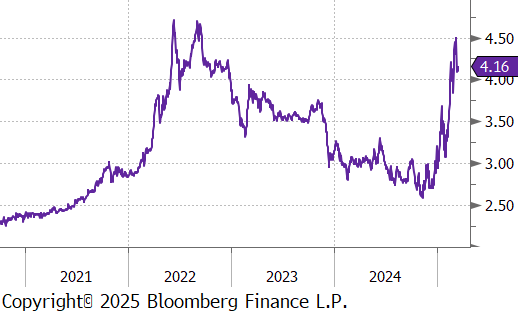
WTI natural gas future lost $0.29 or -6.5% to $4.11/bbl.
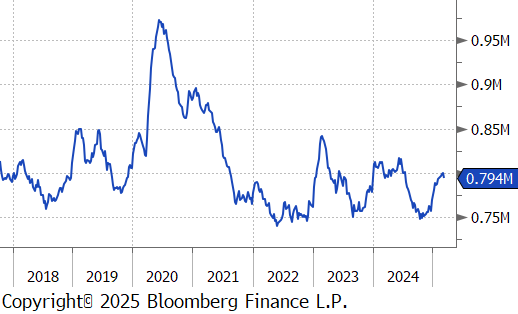
The aggregate inventory level experienced a decrease of -0.7%.
The Baker Hughes North American rig count held steady at 826 rigs, and similarly, the US rig count remained unchanged at 592 rigs.
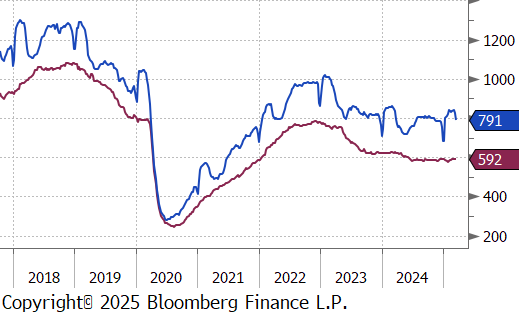
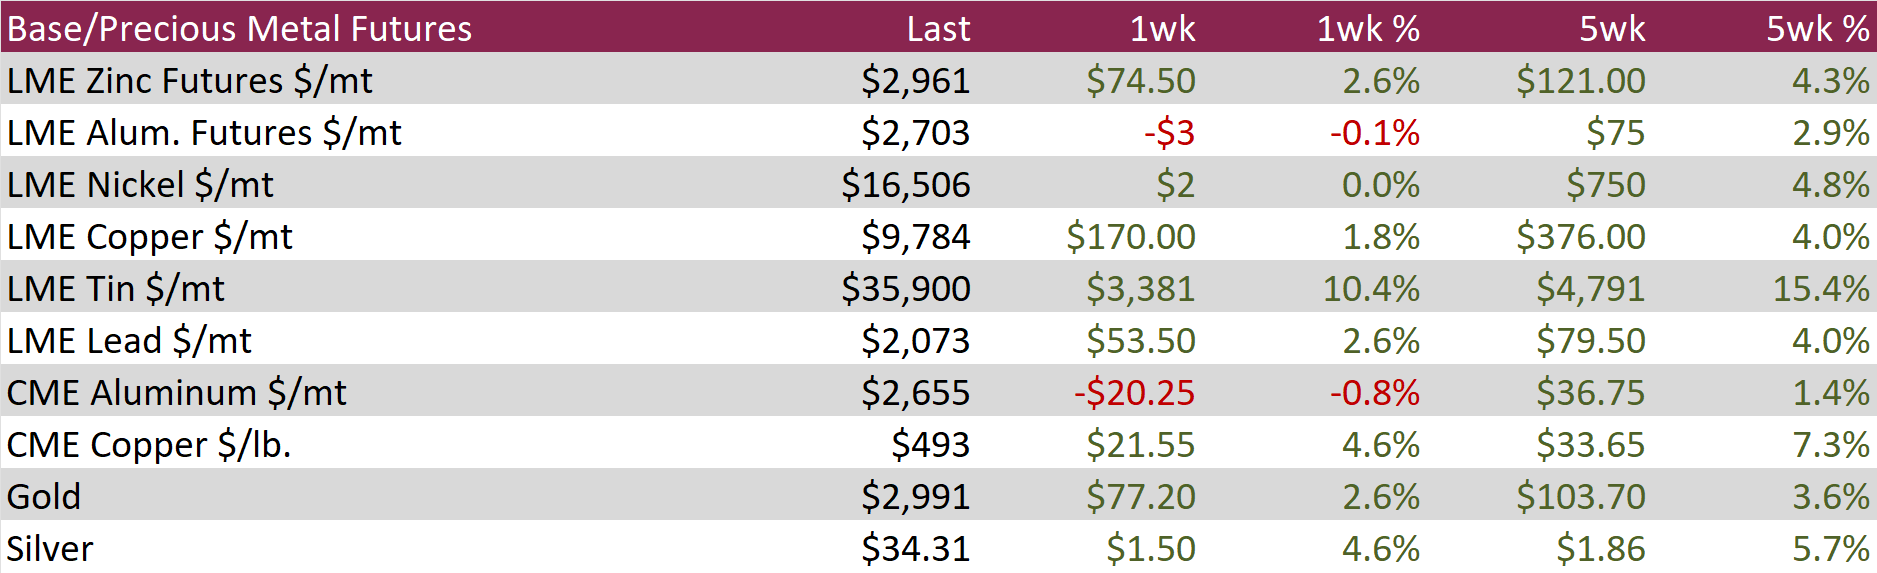
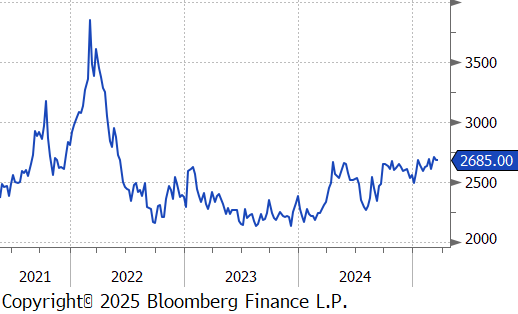
Aluminum futures slipped by $3 or -0.1% to $2,703, as tightening supply from major producers fueled expectations of stronger demand. China’s aluminum production hit a record 44 million tons in 2024, but output is expected to slow significantly this year due to government-imposed production caps. Since 2017, Beijing has maintained a 25-million-ton limit to curb excess supply and support its carbon reduction goals, making a pullback in smelting activity likely. Meanwhile, trade data showed that Chinese aluminum exports remained subdued after the government removed tax rebates on overseas sales. This shift has driven up prices in international markets as domestic producers focus more on supplying local industries. On the demand side, Beijing’s decision to expand its budget deficit to an all-time high signals an aggressive push for economic stimulus, with increased issuance of special bonds expected to bolster infrastructure investment and manufacturing activity—key drivers of aluminum consumption.
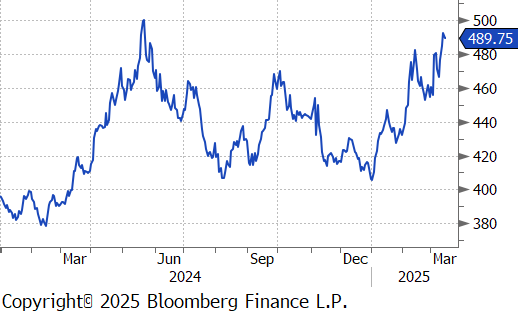
Copper futures advanced by $21.55 or 4.6% to $493, as fresh stimulus measures from China fueled expectations of stronger demand in the world’s largest copper consumer. Over the weekend, Beijing announced a policy package aimed at boosting household income, stimulating consumer spending, and addressing population growth challenges—all factors that could drive increased industrial activity and copper consumption. Adding to bullish sentiment, speculation grew that former U.S. President Donald Trump may impose tariffs on copper imports, a move that could exacerbate supply constraints given the limited capacity of domestic smelters. The U.S. currently relies on imports for nearly half of its copper supply, with just two major smelters in operation. While reports suggest such tariffs could be introduced later this year, the White House’s recent decision to raise base metal tariffs on Canadian imports has sparked concerns that copper duties may be implemented sooner than expected, adding further uncertainty to the market.
Precious Metals
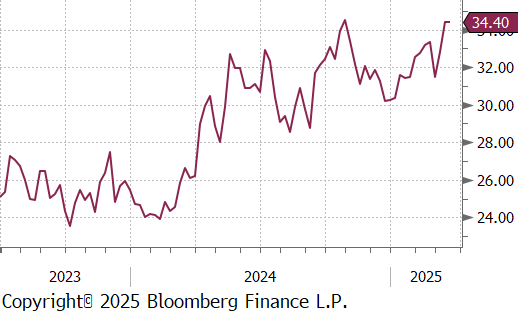
Silver grew by $1.50 or 4.6% to $34.32, its highest level since late October, as investors turned to safe-haven assets amid escalating trade tensions and rising expectations of Federal Reserve rate cuts following weaker-than-anticipated U.S. inflation data. Trade uncertainty intensified after former U.S. President Donald Trump threatened to impose 200% tariffs on European wines, champagnes, and other alcoholic beverages in retaliation for the EU’s 50% tariff on American whiskey. Meanwhile, U.S. Commerce Secretary Howard Lutnick sparked debate by suggesting that a potential recession would be a necessary trade-off to implement Trump’s economic policies.
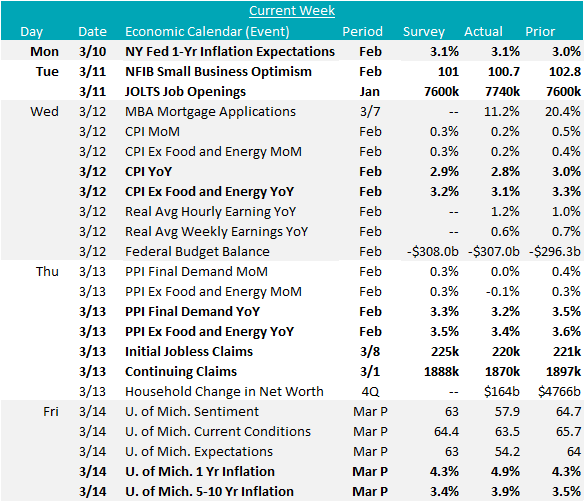
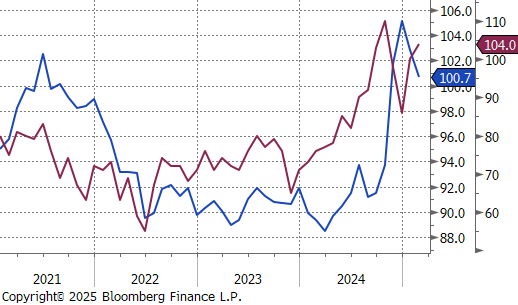
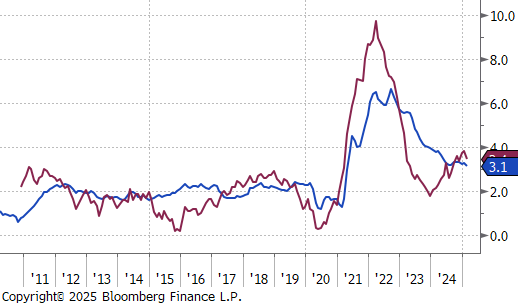
The February Small Business Optimism index decreased to 100.7, down from 102.8 in January, and more than expected 101. The primary driver was the second consecutive increase in the Uncertainty index, now up to 104, just below the record print from October of last year (prior to the election).
February inflation data provided an encouraging signal, coming in below expectations on both the consumer and producer sides. Topline CPI (consumer) rose 0.2% MoM vs. the expected 0.3%, bringing the YoY rate down to 2.8%. Core CPI matched the MoM reading at 0.2% vs. the expected 0.3%, with the YoY rate declining to 3.1% from 3.3% last month. Topline PPI (producer) came in significantly lower than expected at 0.0% MoM, compared to the forecasted 0.3% increase, with the YoY rate at 3.2%. A deeper look suggests this was primarily driven by the surge in imports that continue to make headlines. Adjusting for this, PPI (excluding Food, Energy, & Trade) showed a more moderate improvement, rising 0.2% MoM vs. the expected 0.3%, with a YoY increase of 3.3%.
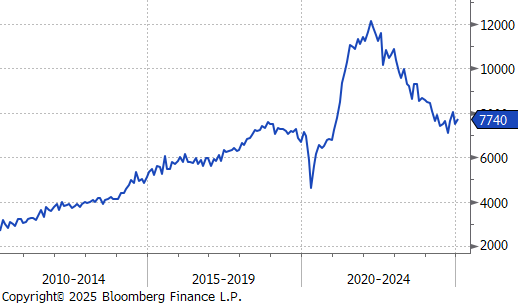
“Dated” labor market data from January showed an encouraging signal for labor market health, with JOLTS Openings coming in above expectations to 7,740k, signaling increased demand, along with an increase in quits and a decrease in firings. However, more timely indicators suggest that conditions for all three have moderately softened from there. That said, initial jobless claims are holding in the low 200k range, with this week’s data coming in at 220k, below the expected 225k. Continuing claims also improved, decreasing to 1,870k, better than the expected level of 1,888k. It will be important to remember that initial claims will only pick up a minor portion of the government job cuts – given the fact that most have severance pay through August.
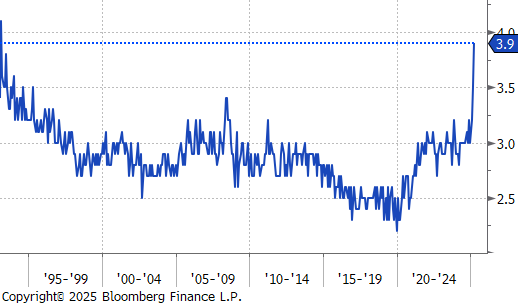
Finally, the preliminary March University of Michigan Consumer Sentiment Survey retreated further, coming in at 57.9, below the expected decrease to 63 – this is the lowest reading since June 2022. The primary concern coming from the report appears to be increased inflation expectations, with the 5–10-year expectation surging to 3.9%, the highest reading since February 1993.