Flack Capital Markets | Ferrous Financial Insider
March 15, 2024 – Issue #423
March 15, 2024 – Issue #423
Overview:


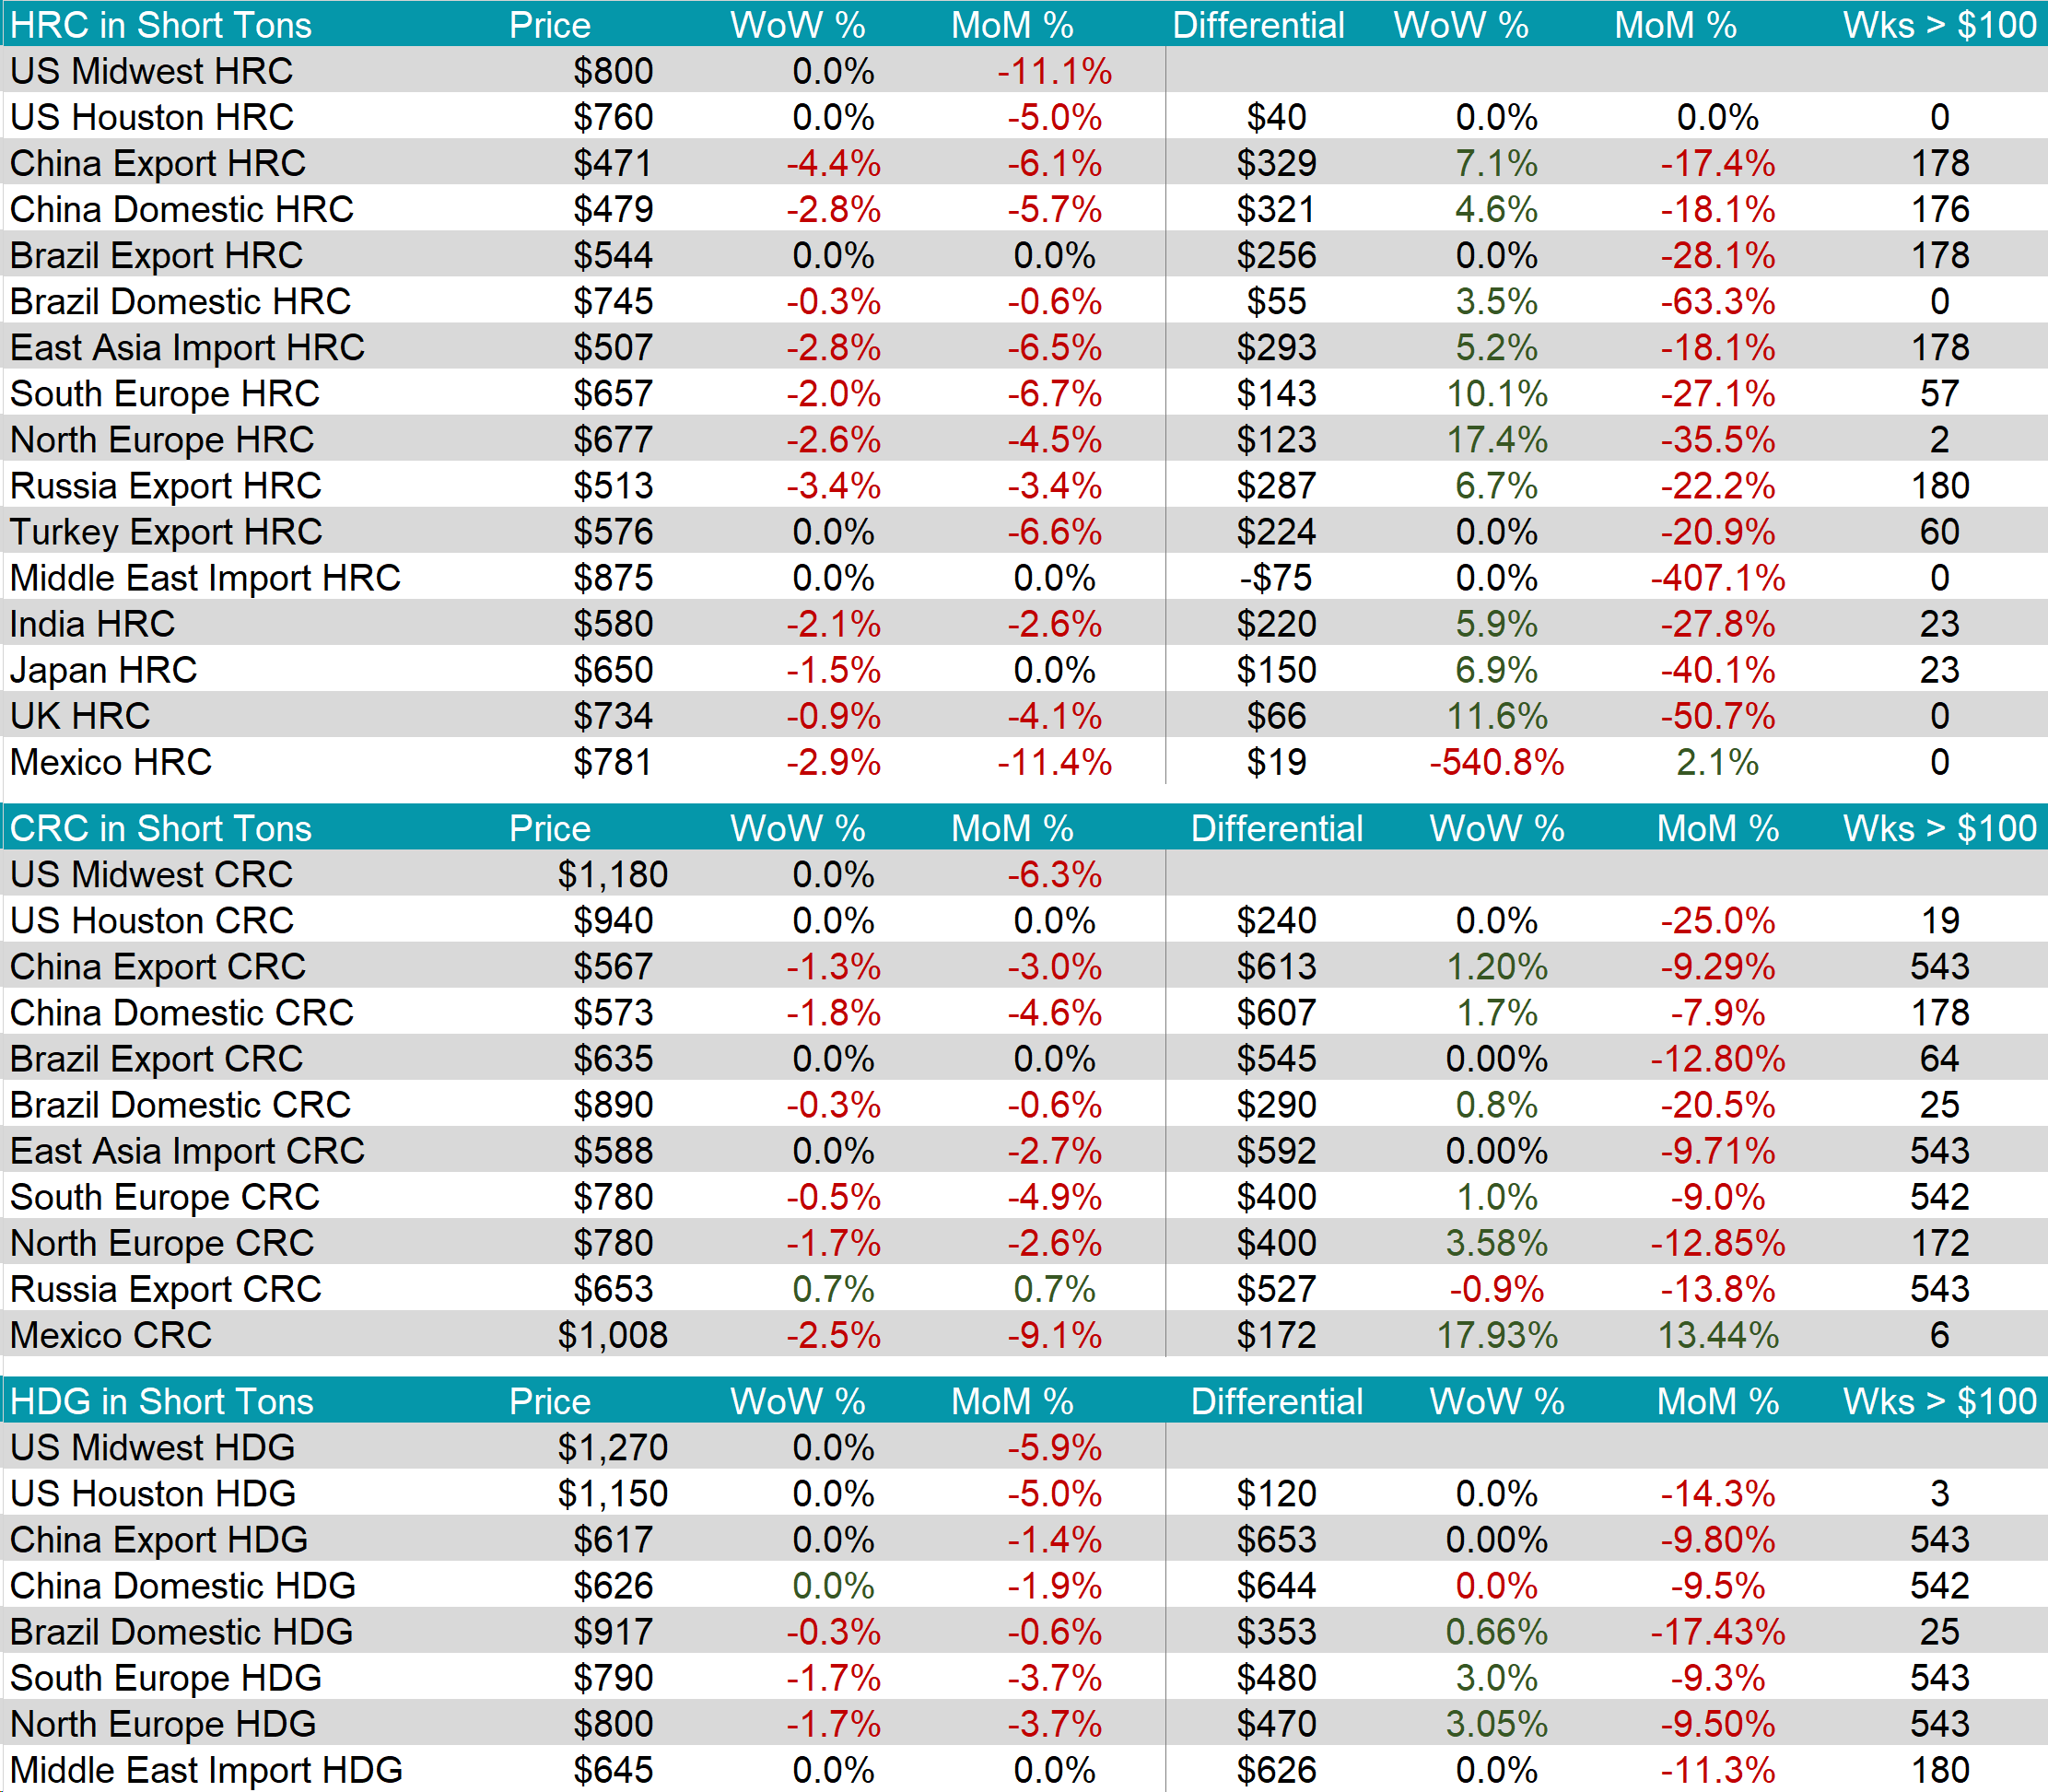
The HRC spot price continued to hold steady at $800, marking the third week in a row at this price. Meanwhile, the 2nd month future fell by $6 or -0.7% to $854 just after experiencing a significant increase last week.
Tandem products both remained unchanged, with CRC at $1,180 and HDG at $1,270, resulting in the HDG – HRC differential to stay at $380.
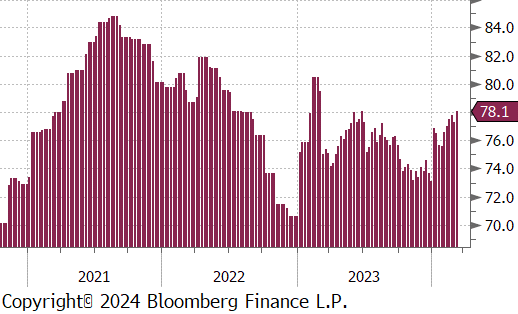
Mill production continued to move out of its previously subdued levels after a slight pull back last week, with capacity utilization ticking up by 0.8% to 78.1%, bringing raw steel production up to 1,734m net tons, its highest level since September 2023.


March Projection – Sheet 1057k (up 220k MoM); Tube 489k (up 120k MoM)
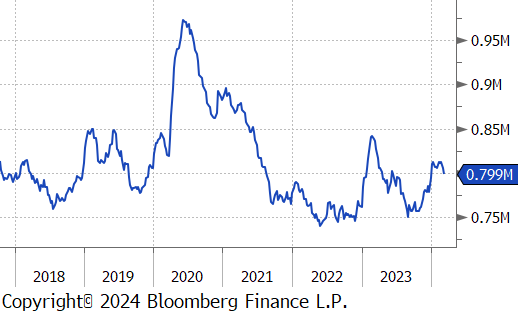
February Projection – Sheet 836k (down 45k MoM); Tube 369k (down 52k MoM)
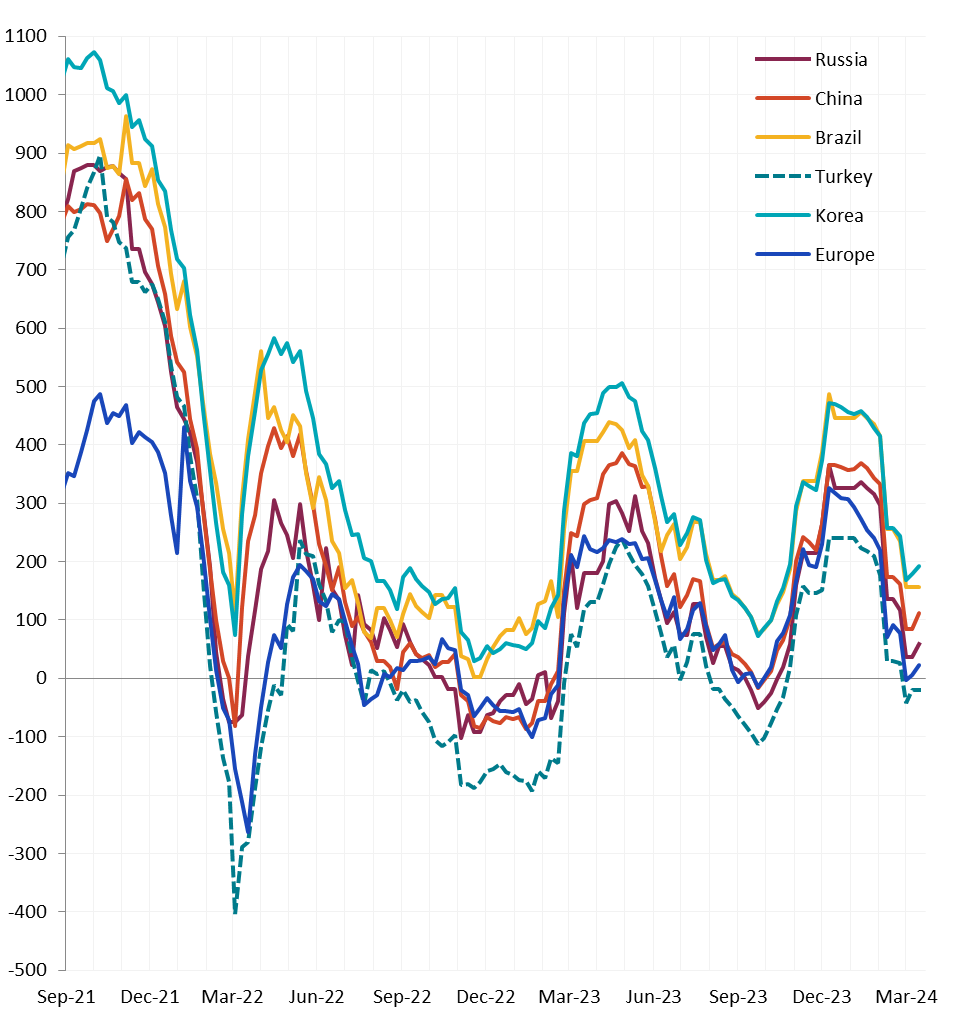
All watched global differentials widened further or remained unchanged, with the China Export HRC price seeing the biggest price decline of -4.4%, followed by the Russia Export HRC having a decrease of -3.4%.

Scrap
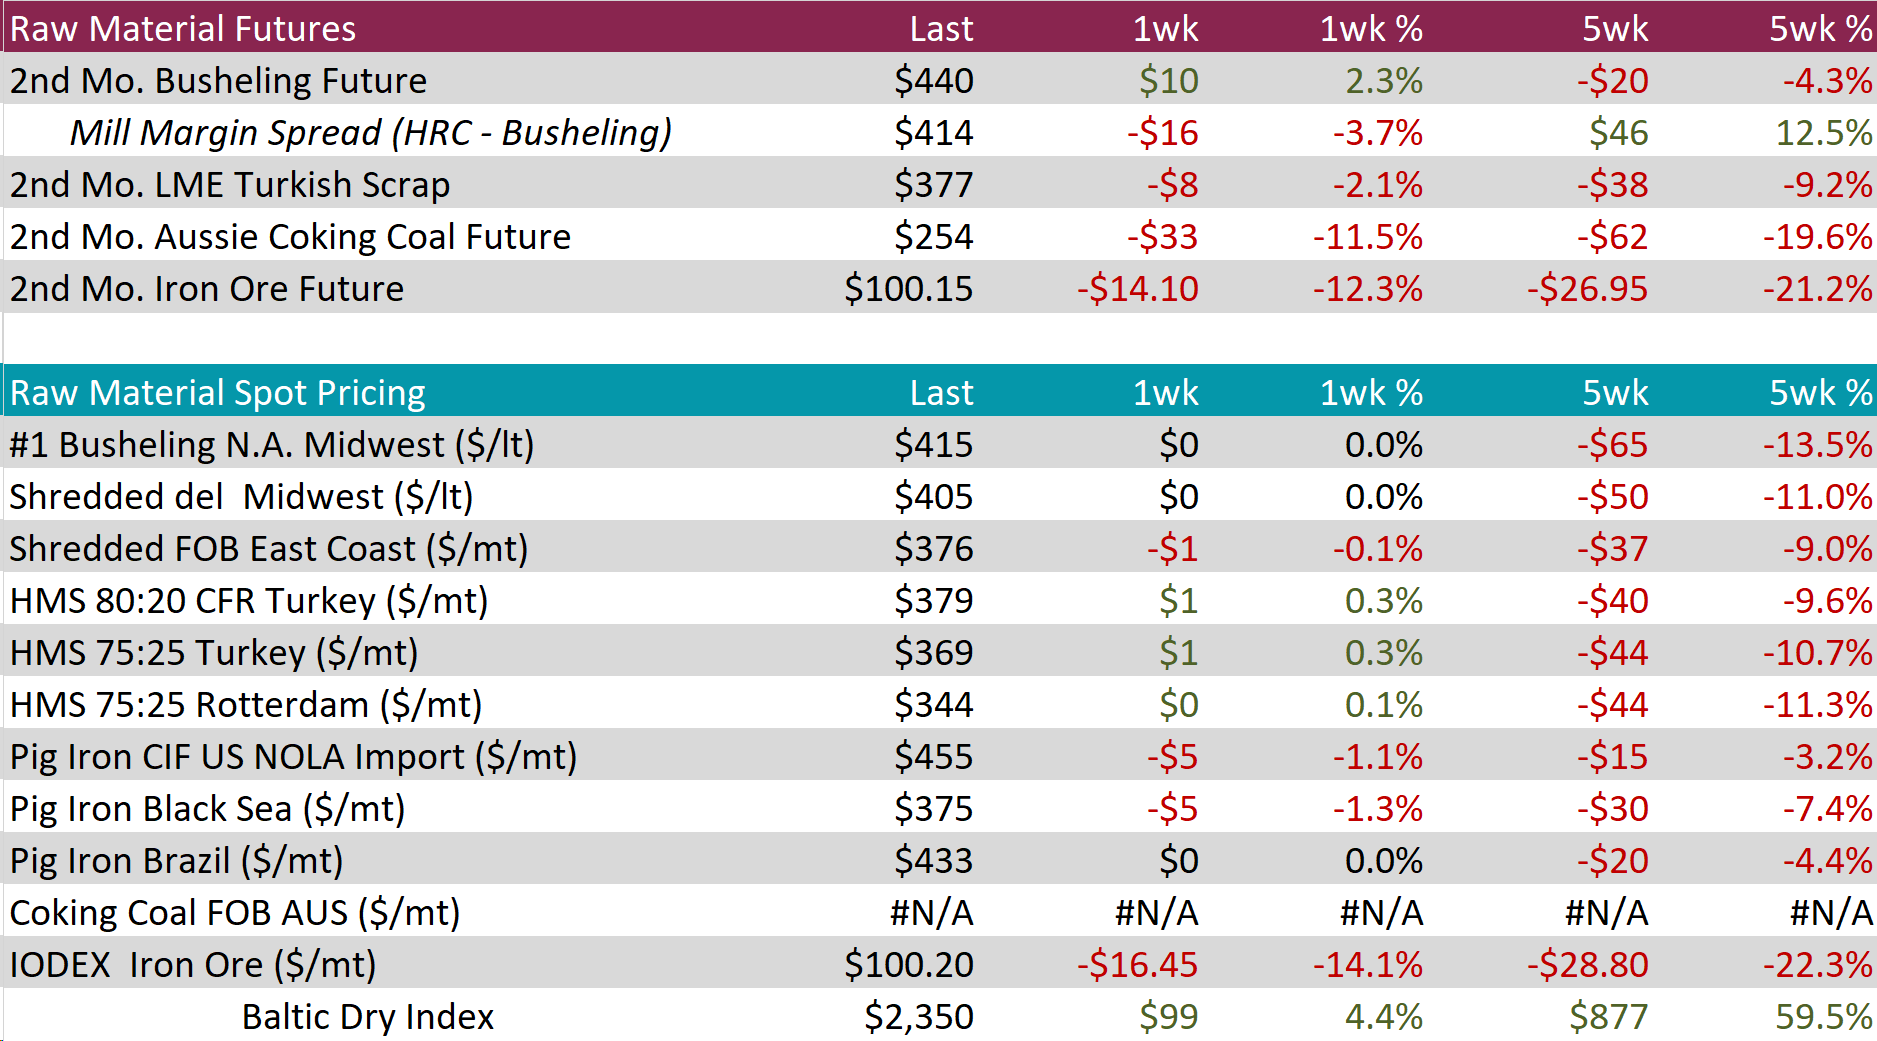
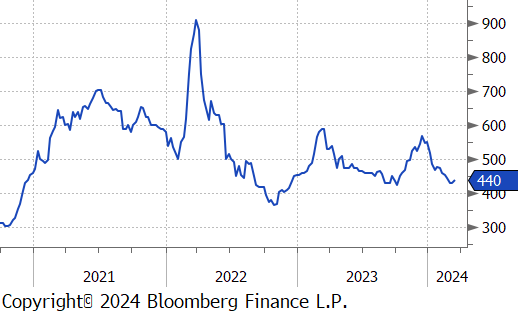
The 2nd month busheling future rose by $10 or 2.3% to $440, marking the first price increase in eight-weeks. At the same time, the busheling spot price remained unchanged at $415, its lowest price since October 2023.
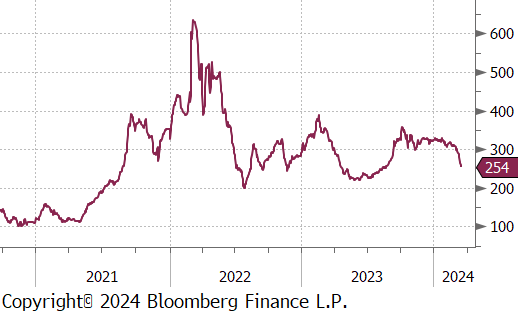
The 2nd month Aussie coking coal future experienced a significant decline, down by $33 or -11.5% to $254, hitting its lowest price since August 2023.
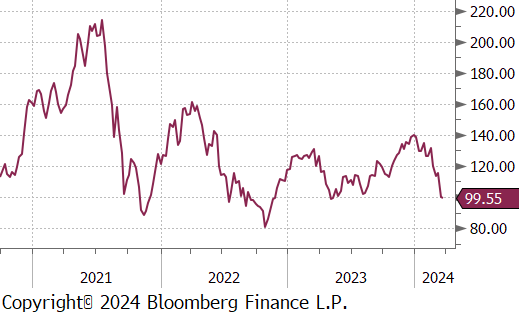
The 2nd month iron ore future fell by $14.10 or -12.3% week-over-week to $100.15, reaching its lowest price seen since May 2023.
Dry Bulk / Freight
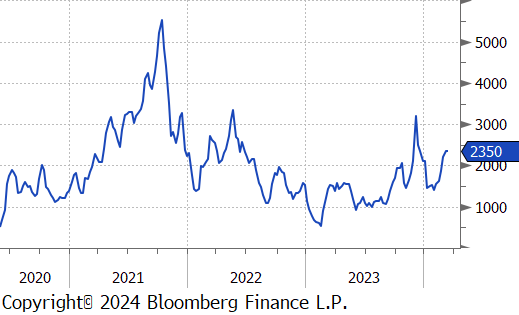
The Baltic Dry Index furthered its upward trend, rising by $99 or 4.4% to $2,350, resulting in the five-week price change to rise by $877 or 59.5%.
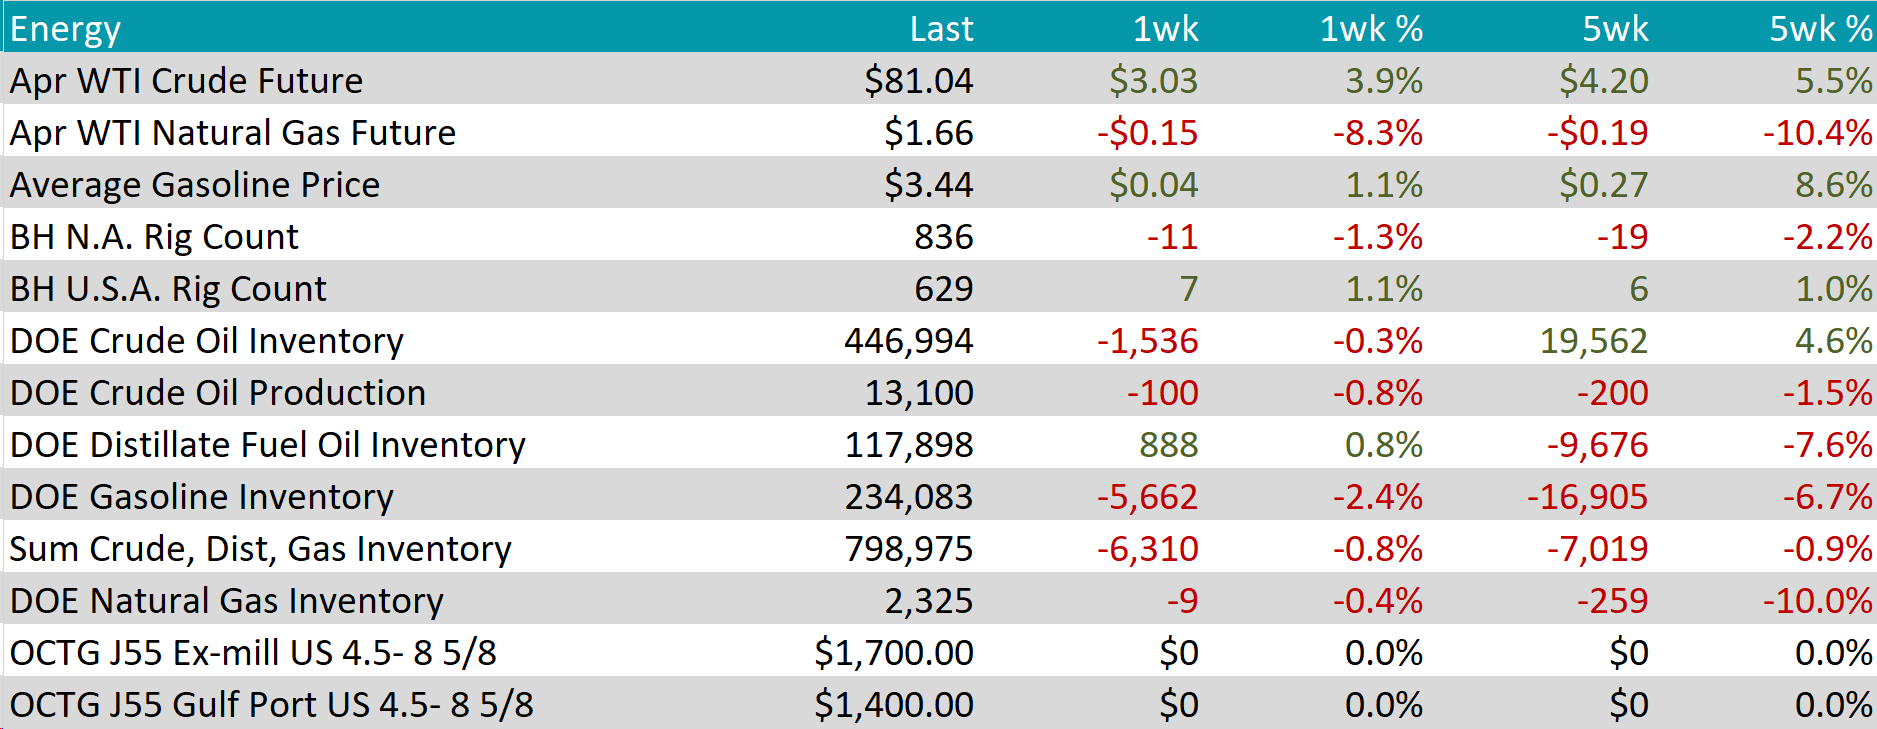
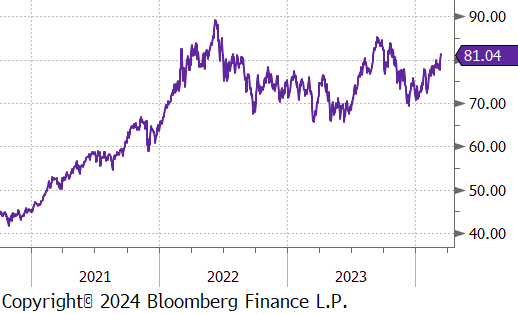
WTI crude oil future gained $3.03 or 3.9% to $81.04/bbl, finally breaking back through to the $80 price level since November 2023.
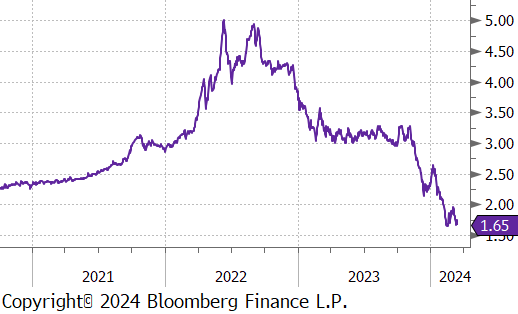
WTI natural gas future lost $0.15 or -8.3% to $1.66/bbl.
The aggregate inventory level experienced a slight down tick of -0.8%.
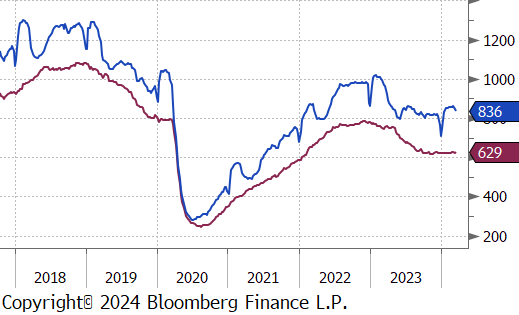
The Baker Hughes North American rig count dropped by 11 rigs, bringing the total count to 836 rigs. At the same time, the US rig count gained 7 rigs, bringing the total count to 629 rigs.
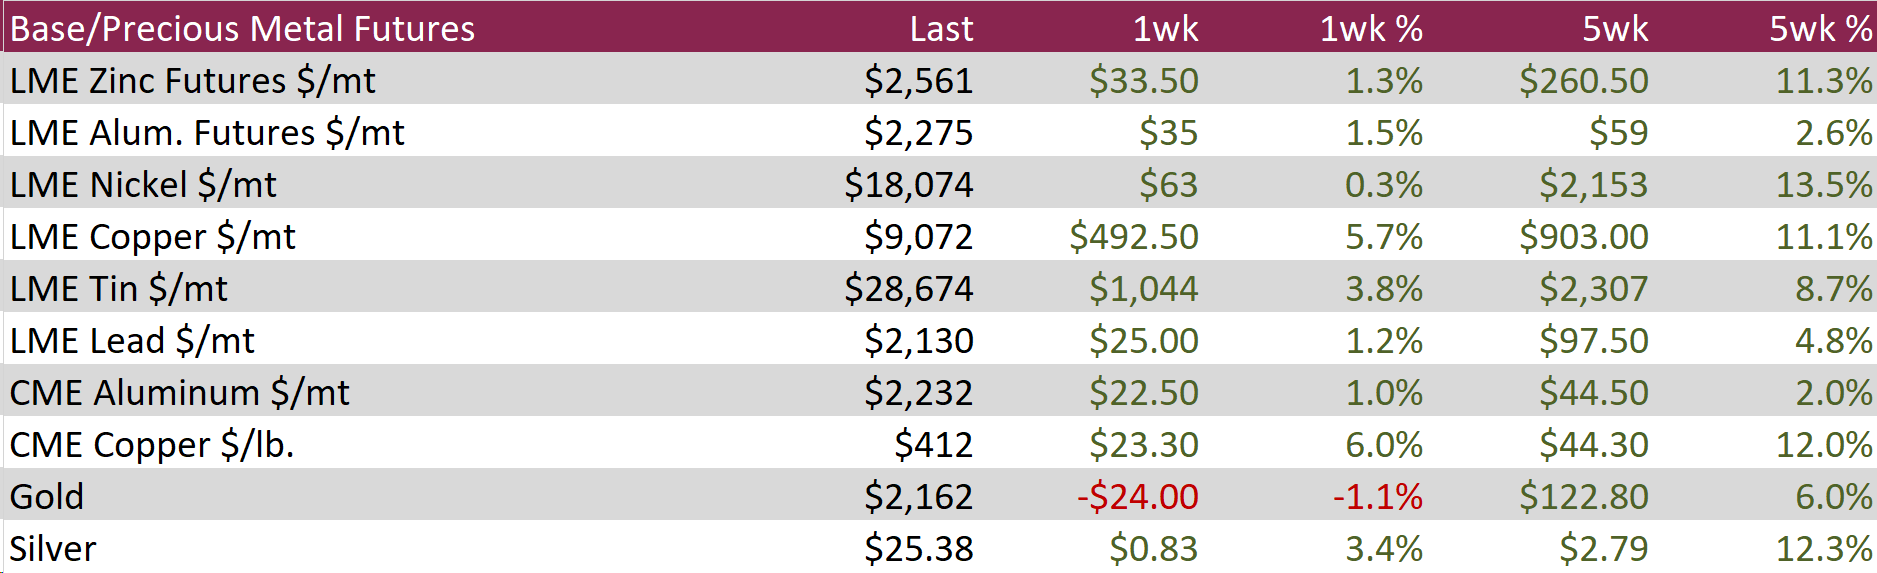
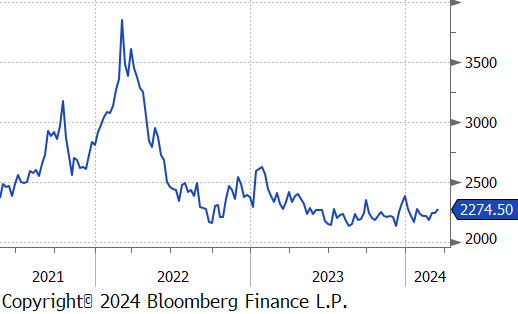
Aluminum jumped up by $35 or 1.5% to $2,275, hitting their peak since January, driven by positive data from China that sparked anticipation of a demand increase. The country reported a 7% rise in industrial activity for January-February 2024, surpassing the 5% forecast, with aluminum production also up by 5.5% thanks to high prices encouraging more output. Additionally, China’s imports of unwrought aluminum and its products jumped by 93.6% to 720,000 tons during the same timeframe, compared to the previous year. Despite an 80% rise in aluminum stockpiles at SHFE warehouses in February and production limits in Yunnan—China’s fourth-largest aluminum production area—due to the dry season, there’s optimism for production to pick up with better power supply. However, growth in output is expected to face constraints from limited power availability and planned maintenance at smelters.
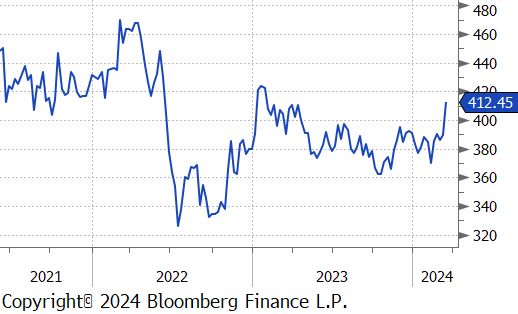
Copper climbed up by $23.30 or 6.0% to $412, hitting a new high since April 2023, similarly fueled by encouraging Chinese economic indicators that raised expectations for a rebound in demand from the globe’s top metals consumer. The rise in copper prices began last week after leading Chinese smelters decided to cut production at loss-making facilities, a move triggered by a sharp fall in copper concentrate prices to a ten-year low, which squeezed smelter margins. This strategic production cut came amidst raw material shortages. Despite these optimistic trends, concerns linger about the real estate market. Property investment dropped by 9% in the same timeframe, showing some improvement from December’s 24% plummet but still highlighting enduring struggles in the sector.
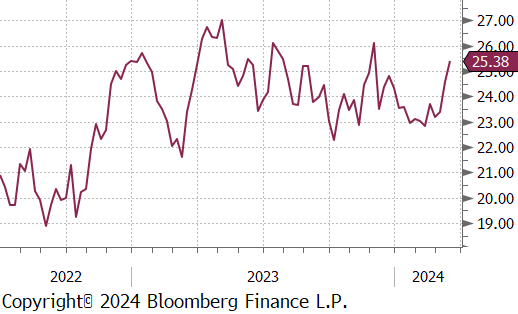
Silver increased by $0.83 or 3.4% to $25.38, propelled by investors flocking to it as a safe haven amidst escalating war fears and inflation risks. Surprisingly high US producer CPI and PPI figures, combined with heightened global geopolitical tensions following Russia’s deployment of tactical nuclear weapons closer to NATO territories, have intensified the market’s unrest. Attention is now turning towards the Federal Reserve’s policy meeting on Tuesday, with market participants eager for hints on the initiation of monetary easing. This shift in focus comes after recent US economic indicators led to a decrease in the probability of a June interest rate cut, dropping to 58% from the 74% anticipated just a week prior.
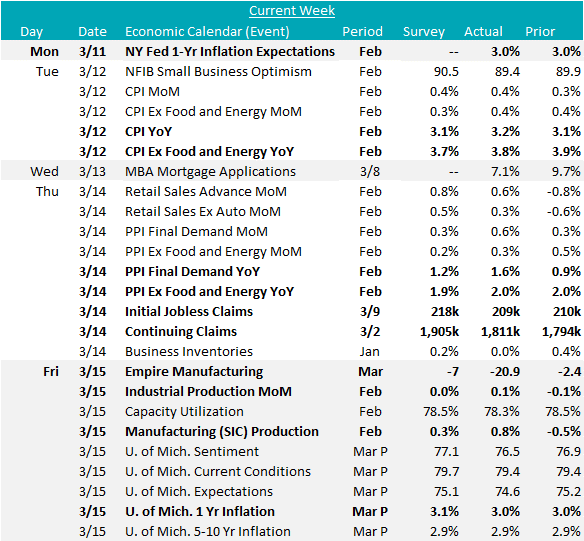
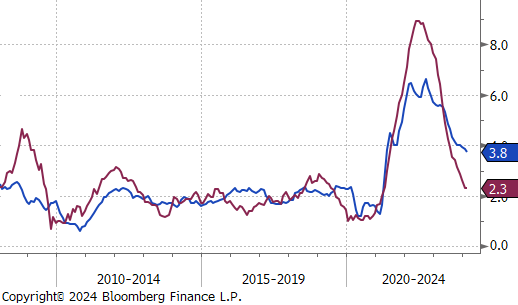
CPI YoY and CPI (ex food & energy) YoY both came in above expectations in February, 3.2% vs 3.1% and 3.8% vs 3.7%, respectively. In a similar manner, PPI final demand YoY and PPI (ex food & energy) YoY both came in above market expectations for February, 1.6% vs 1.2% and 2.0% vs 1.9%. These figures, although not a significant increase, signal that the fight against rising prices in not over and the Fed will need more evidence of disinflation initiating rate cuts.
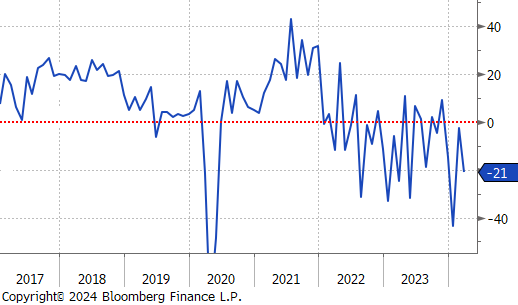
The March FED Empire manufacturing survey printed -20.9, well below expectations of -7. Taking a step back increasingly volatile over the last two years, making it increasingly difficult to glean true insight from the topline data.
Industrial & manufacturing production both came in above expectations in February, 0.1% vs 0.0%, and 0.8% vs 0.3%, respectively. This is additional support for the thesis that the manufacturing sector is on a path to recovery after a prolonged contraction.
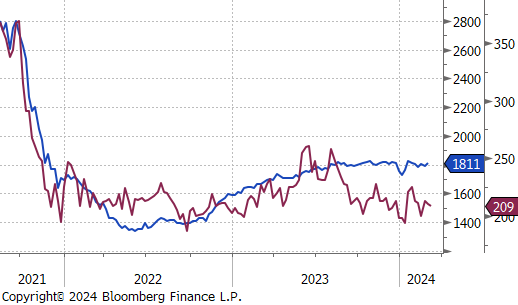
Initial & continuing jobless claims continue to show a stable labor market, with major revision down in continuing claims.
The preliminary March University of Michigan consumer sentiment survey came in slightly below expectations, driven most significantly by increased concern for the future. 1 year inflation expectations were flat at 3.0% (versus the median forecast of 3.1%), and longer-term inflation expectations were unchanged. Earlier in the week, the February NY FED 1yr inflation expectations showed a similar story, coning in at 3.04% versus 3% in January. Although consumer expectations for inflation are historically poor at forecasting actual levels, these sticky datapoints continue to show that consumers believe the last leg of getting prices down to the FED’s 2% target will be difficult.