Flack Capital Markets | Ferrous Financial Insider
March 17, 2023 – Issue #371
March 17, 2023 – Issue #371
As the banking and financial sectors continue to work through uncertainty, we will turn back to fundamental data in the domestic steel market. In the FFI report dated 2/17, we spoke about dynamics within the residential construction sector. There, we noted that while both starts and permits have been under significant pressure, dynamics on the permits side were suggesting that there was underlying support around the 2019 levels. While it is only one month of data, February readings for starts and permits signal an improved outlook, especially if the hiking cycle from the Federal Reserve is coming to an end earlier than anticipated.
It is important to note that this and additional data released in the coming months should be discounted with the knowledge that the impact of the banking turmoil is entirely uncertain. However, if the result is tighter financial conditions with lower interest rates, that would provide additional support to the construction industry as well as all the other steel consuming sectors. In the 2/17 report we also noted that all measures of supply were subdued due to the uncertain outlook on demand.
Today, measures for imports and domestic production have modestly increased and inventories are even shorter. The continued reluctance to purchase enough inventory for existing demand when lead times were expanding provided meaningful leverage to the mills in market pricing. While the outlook for the remainder of the year continues to be unclear and may even be concerning, reluctant buyers lost their gamble for the 1st quarter of the year. If you are waiting for lower prices before stocking the inventory you need today, you’ve taken on serious upside risk.
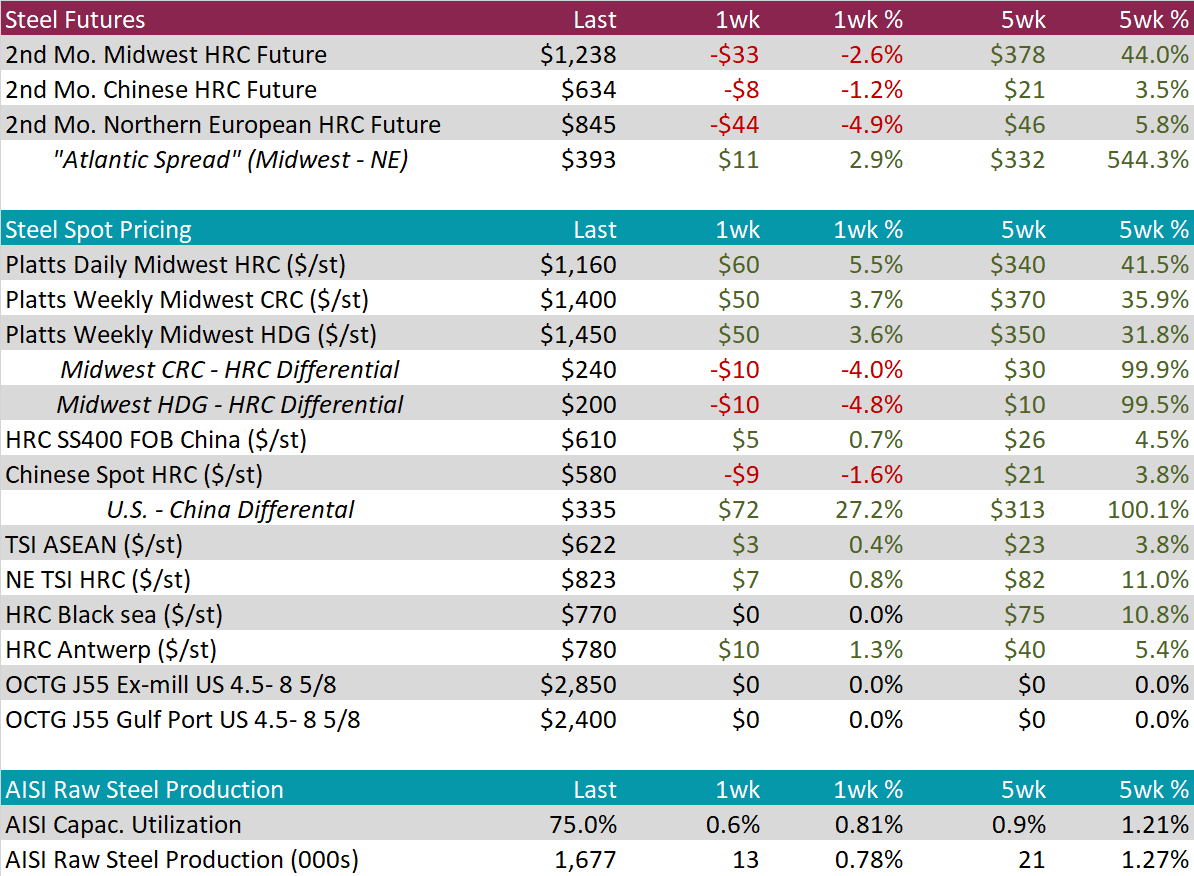
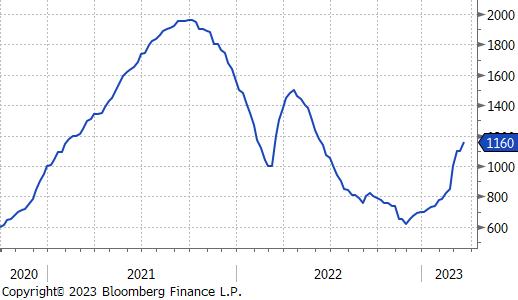
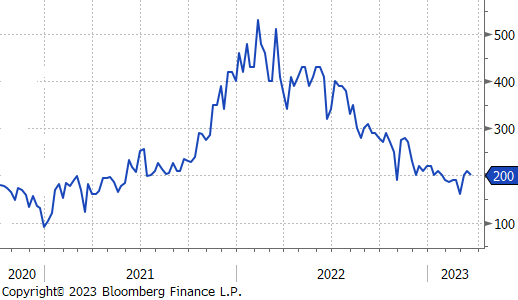
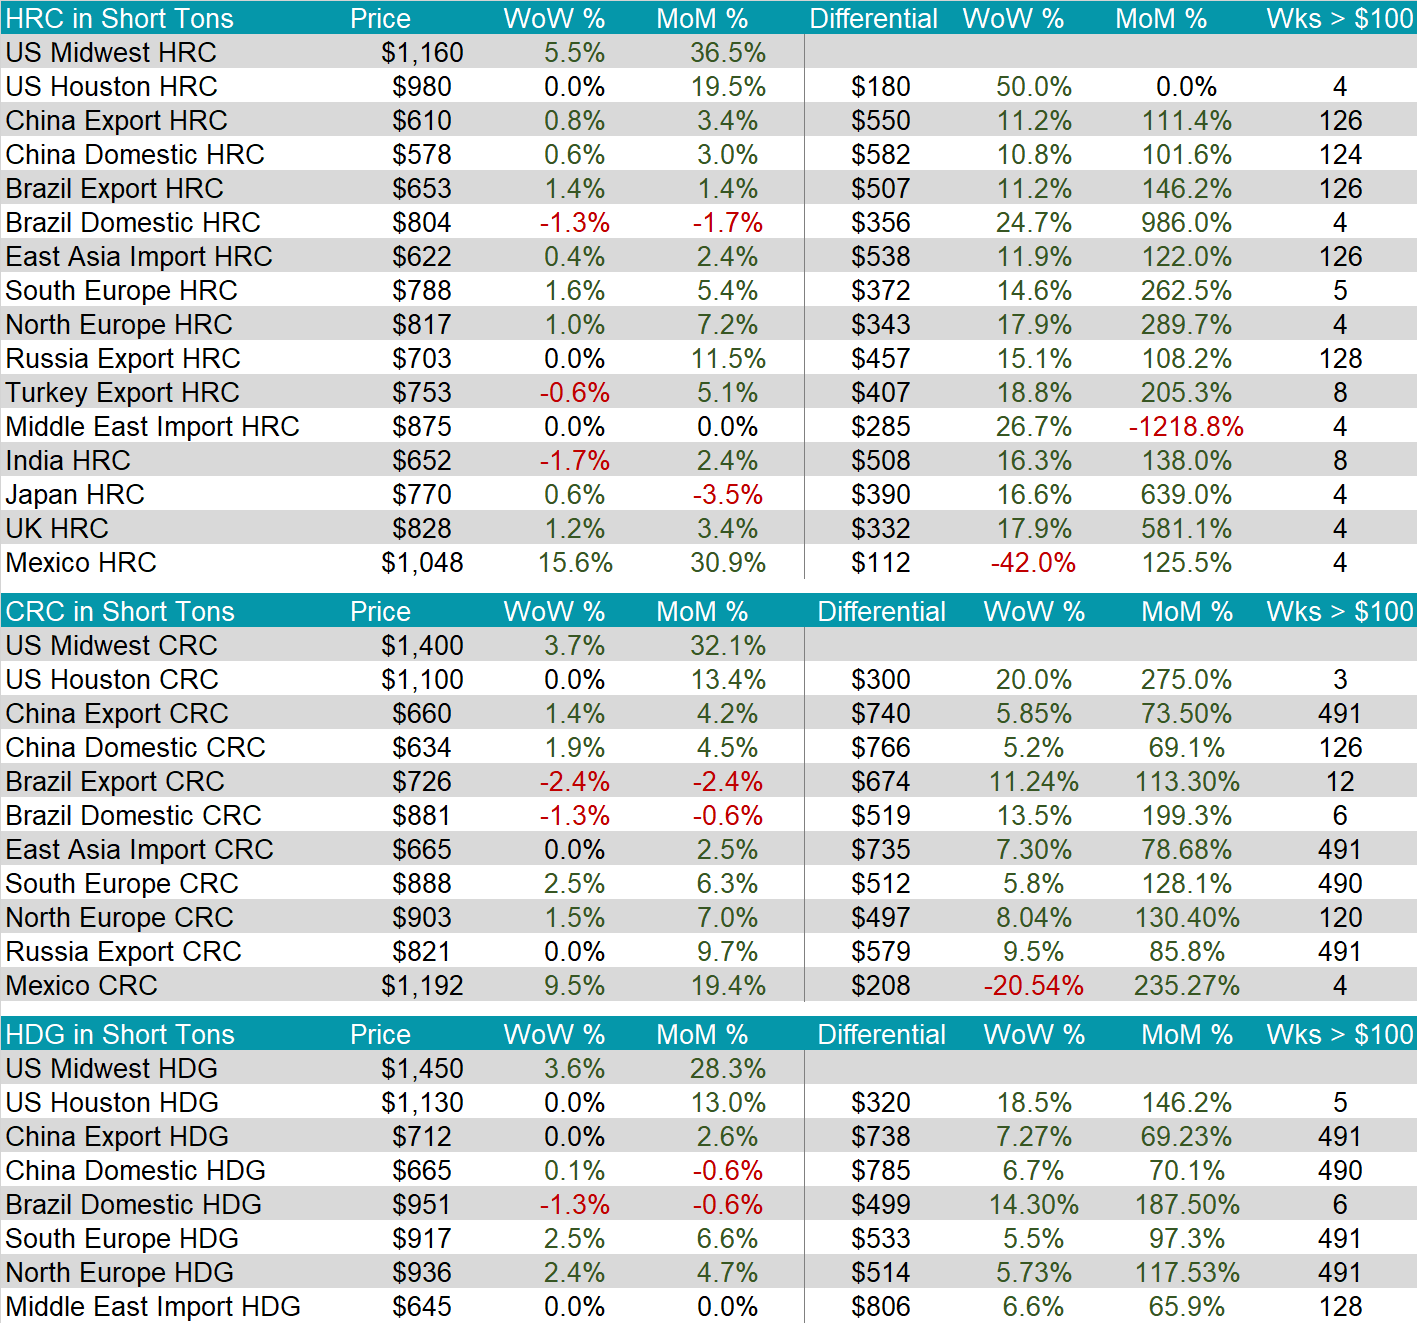
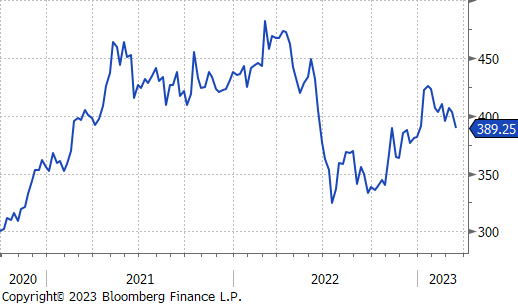
Domestic HRC increased further in the spot market, up 5.5%, while the 2nd month (April) future lost 2.6%. Lead times pushed out further this week and suggest there is further upward momentum in spot pricing.
Both tandem products saw their spot prices increase further this week, Up 3.7% for CRC and 3.6% for HDG. The spread between tandem products and HRC shrunk slightly but is off the recent lows.
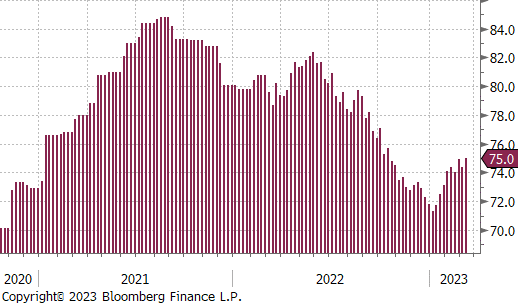
Domestic production ticked back up with capacity utilization increasing 0.6% to 75% last week.
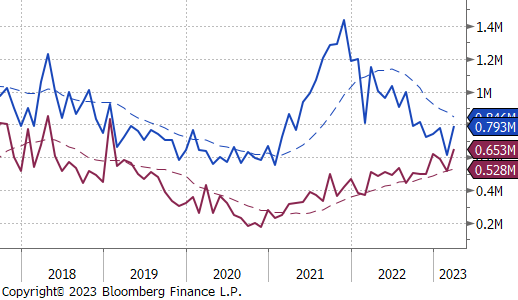
March Projection – Sheet 793k (up 178k MoM); Tube 653k (up 140k MoM)
February Projection – Sheet 614k (down 163k MoM); Tube 514k (down 74k MoM)
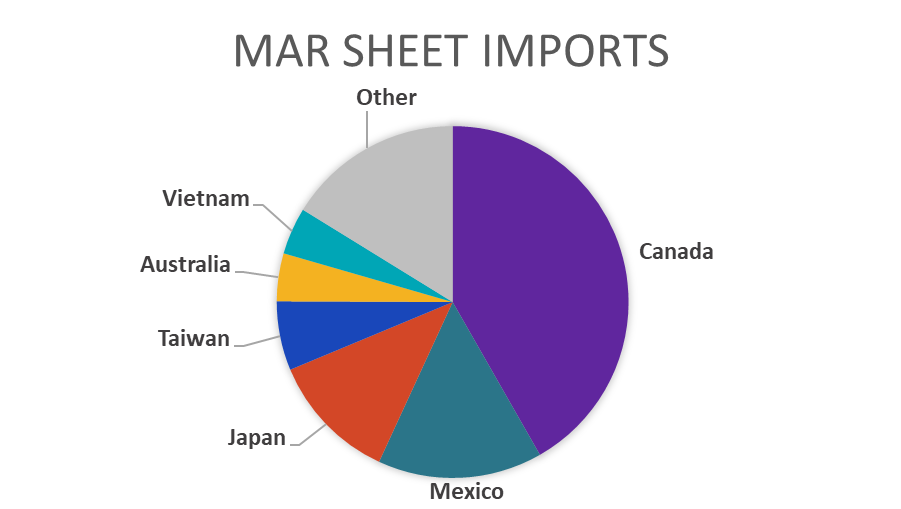
While it is still preliminary data, there was a notable increase in arrivals from Canada and Japan.
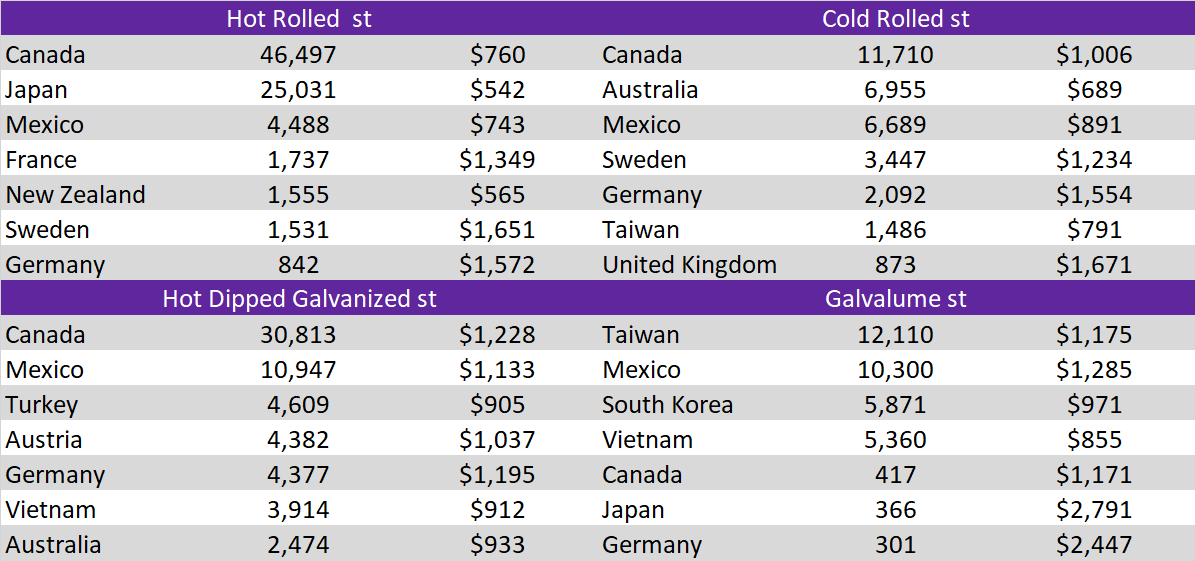
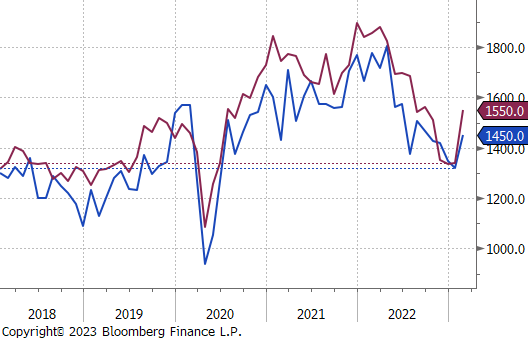
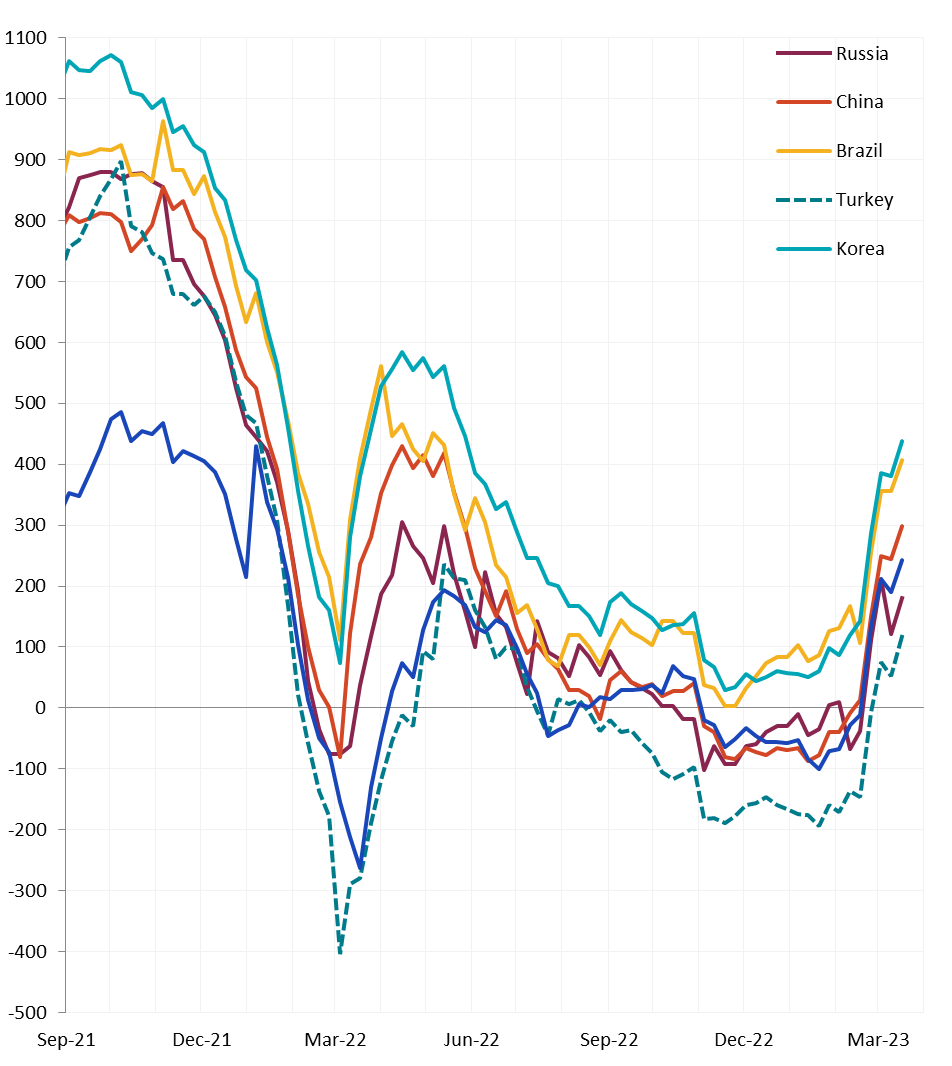
Global differentials with the watched countries increased further this week due to U.S. domestic prices outpacing the rest of the world. The exception was Mexico, where their prices for HRC and CRC rose, 15.6%, and 9.5%, respectively.
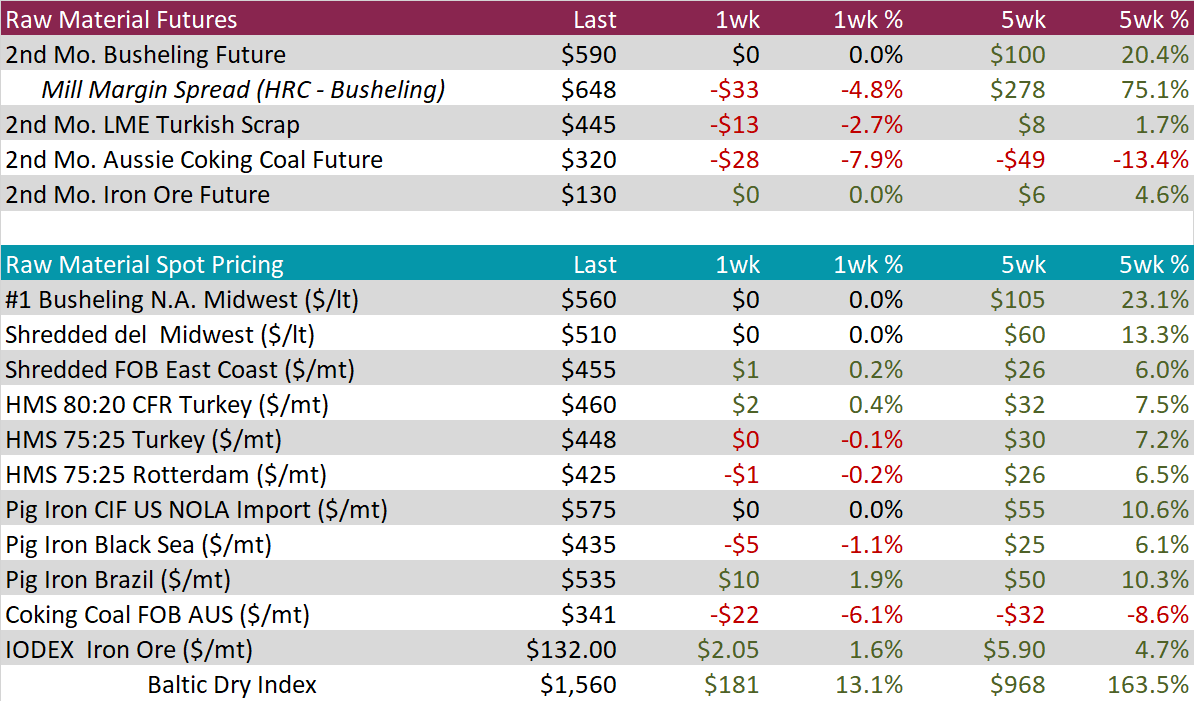
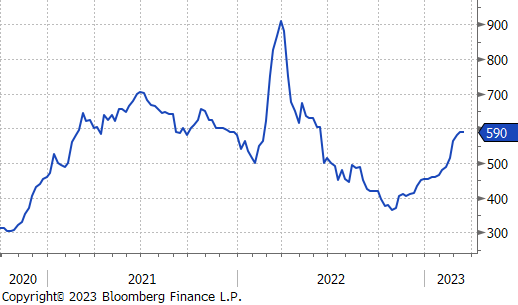
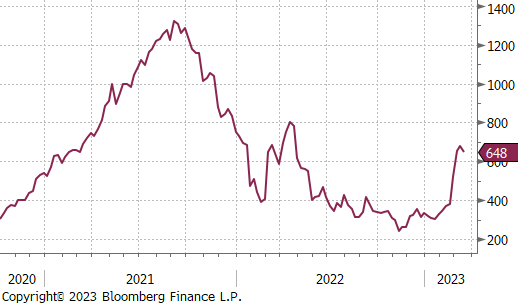
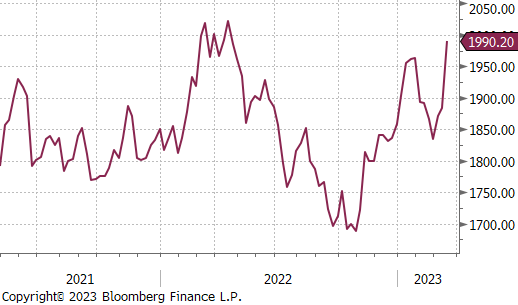
It was mostly a quiet week in the raw materials space, with domestic spot prices and the busheling 2nd month future unchanged. Mill margin fell due to a decreasing April HRC future price.
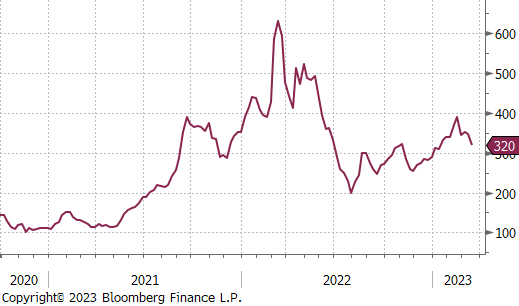
At the same time, Aussie coking coal continued its downward trend, losing another 7.9% by the end of the week.
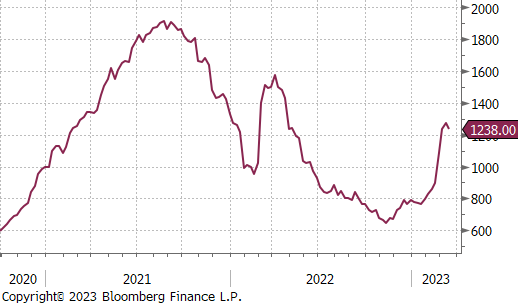
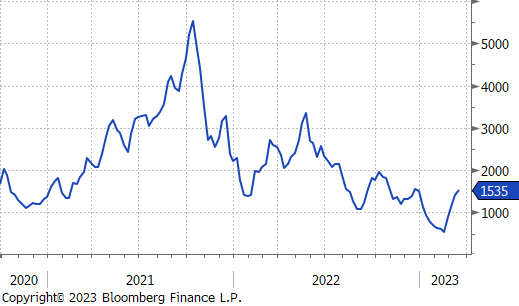
The Baltic Dry Index continued its strong rally, up another 13.1% last week, it is now up 163.5% over the last 5 weeks.
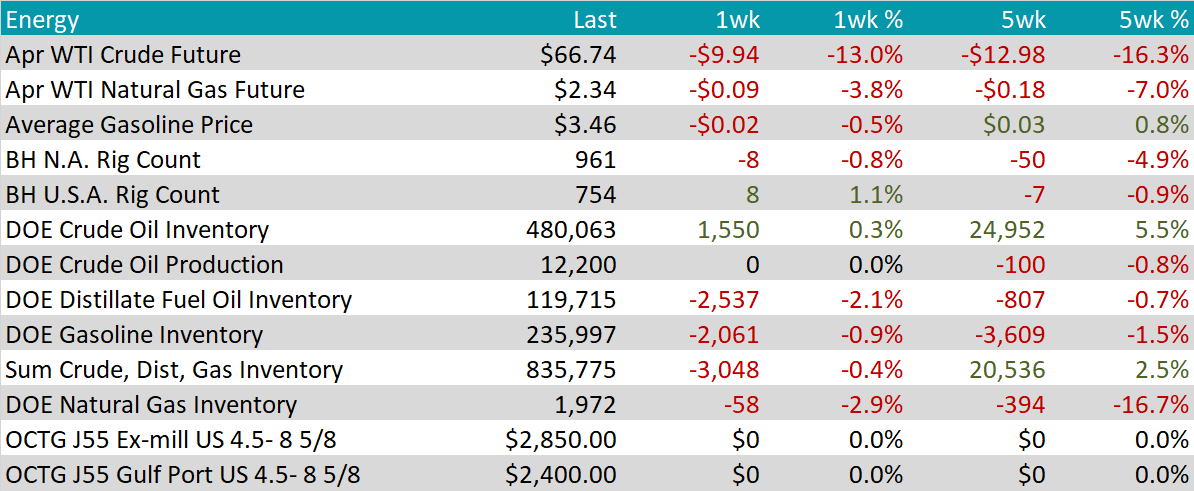
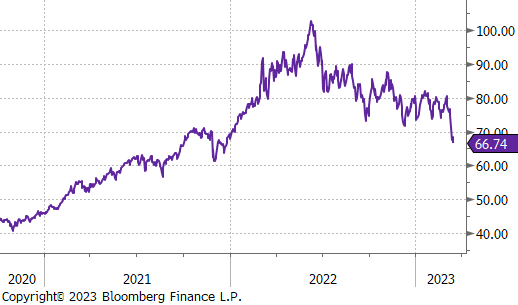
April WTI crude oil future lost another $9.94 or 13% to $66.74/bbl.
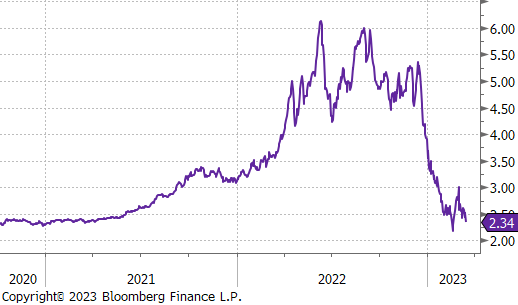
April WTI natural gas future lost $0.09 or 3.8% to $2.34/bbl.
The sell off in both was mostly driven from uncertainty around macro prospects due to the global banking turmoil.
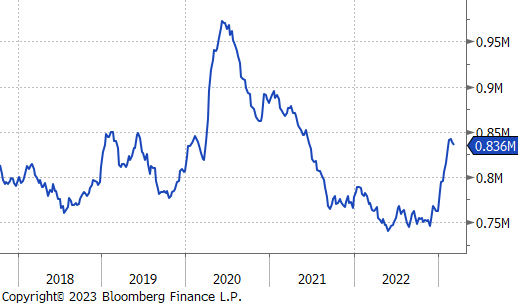
The aggregate inventory level was down 0.4%, for the second week in a row.
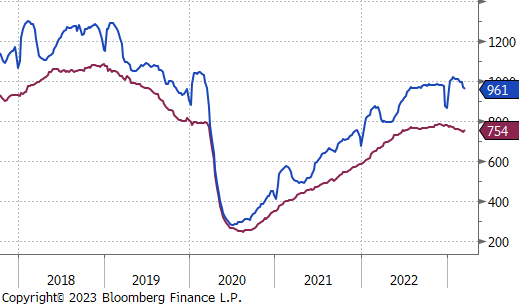
The Baker Hughes North American rig count was down 8 rigs, while the U.S. count was up by 8 rigs for the first time in 5 weeks
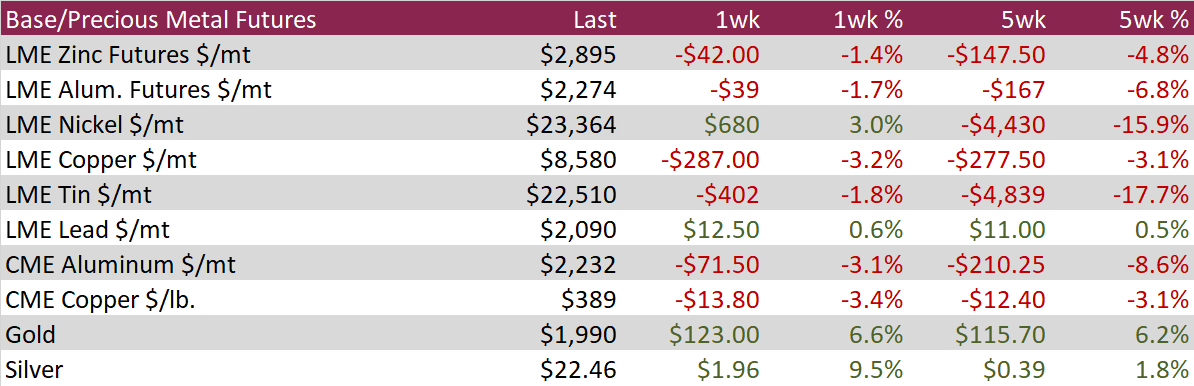
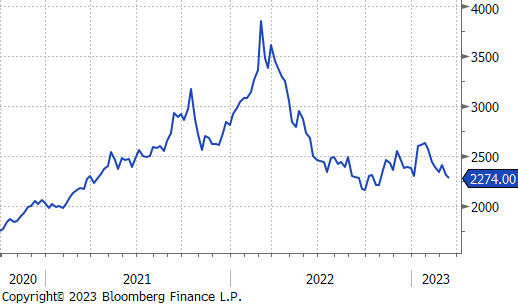
Aluminum futures fell 1.7% during the week as base metals came under pressure as macro headwinds adversely impacted investor sentiment. China’s Jan-Feb industrial production figures showed that metals output strengthened, with aluminum output rising 7.5% YoY despite further power issues in Yunnan affecting smelting capacity. Furthermore, Alcoa announced that it would reduce the utilization rate at its Portland smelter in Australia to 75% from 95% due to operational instability.
Copper fell 3.2% on the LME, finishing lower for 6 of the last 8 weeks as the market trimmed risk amid banking woes and expectations of further rate hikes by the Fed. The red metal found some support to end the week after China data showed growth in fixed asset investments and property investment rose more than expected over January and February.
Precious metals experienced strong gains during the week as fears of a global banking crisis sparked safe-haven demand and the DXY finished slightly down on the week. Silver and Gold rallied 9.5% and 6.6%, respectively. Gold ETF fund holdings rose for four straight days through Thursday to a three-week high and the largest Gold ETF, SPDR Gold Shares, recorded its biggest weekly fund inflow in the year.
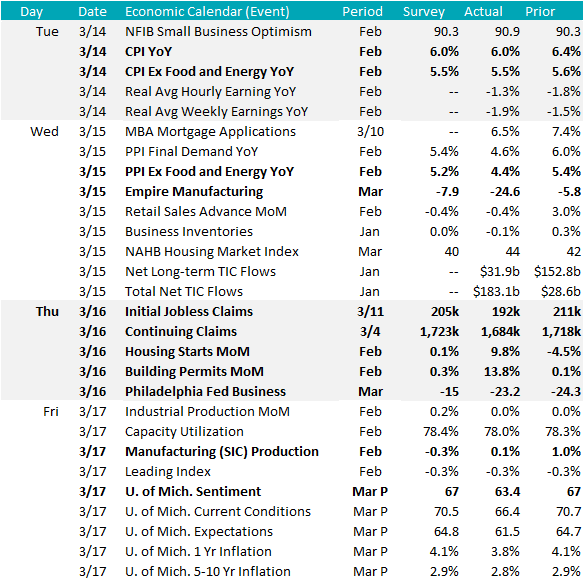
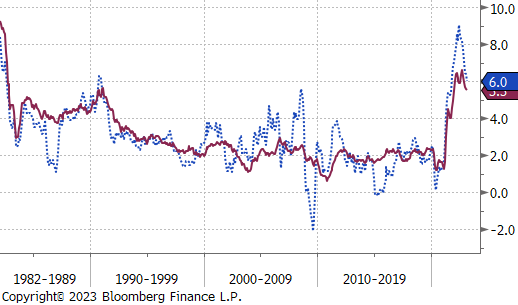
Inflation data from this week pointed in two different directions. Both Topline and Core (ex. Food and Energy) CPI YoY readings were in line with expectations but show that higher prices are stickier than anticipated late last year. At the same time, PPI (producers price index) came in well below expectations and show additional deflationary pressure coming down the pipeline. The statistical relationship between PPI and both CPI & PCE is strenuous, however, it does signal that supply chain disruption is continuing to ease and that cost-push inflation is subsiding.
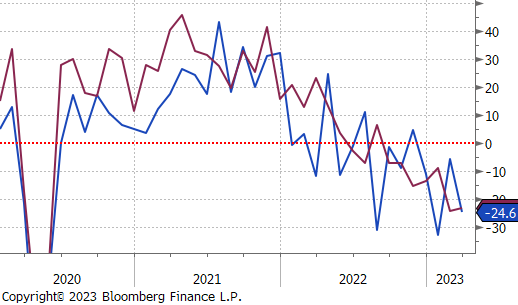
On the manufacturing side of this week’s data, we received both the Empire (NY) and Philadelphia Fed Manufacturing surveys. Both remain well in contraction territory. This data would suggest that the recent rally in steel prices has occurred without support from manufacturing. Depending on when demand from this sector starts to improve, we could see additional upside pressure on steel prices from under inventoried manufacturers.
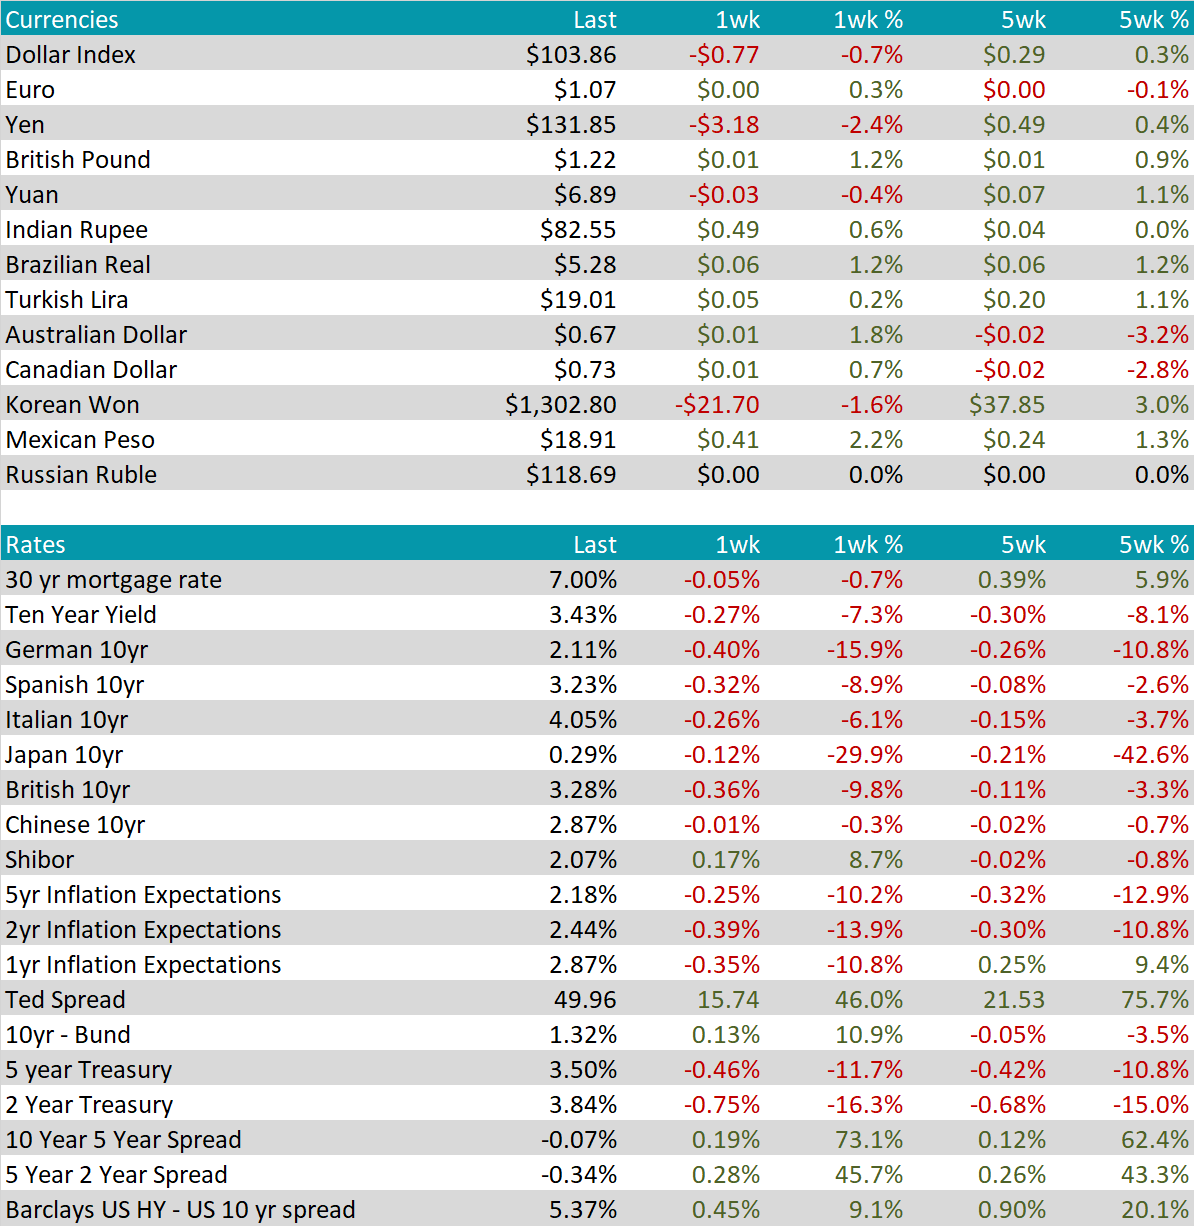
The market is still uncertain over what comes next. The Fed will announce their next rate decision on Wednesday 3/22. This will give participants a glimpse into how the Fed views recent economic developments. It is important to remember, the Fed is still the biggest player in the market, and their policy decisions serve as a base in valuations across all asset classes, especially fixed income, and currencies.
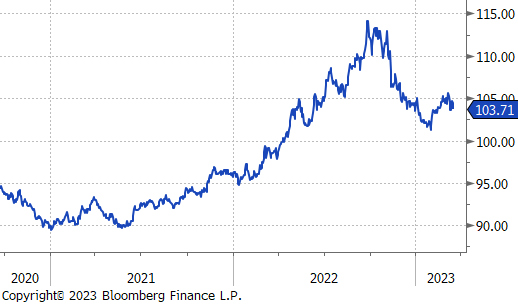
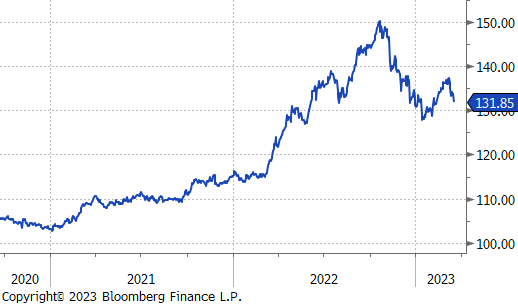
In currencies, The U.S. dollar sold off significantly down $0.77 to 103.86, while the Japanese yen was also down 2.4%, reaching its lowest level since early February. This comes as Bank of Japan members continue to stress the importance of ultra-easy monetary policy and low interest rates.
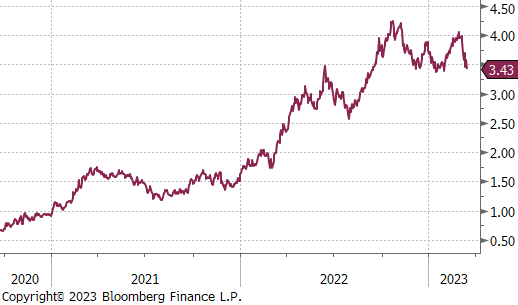
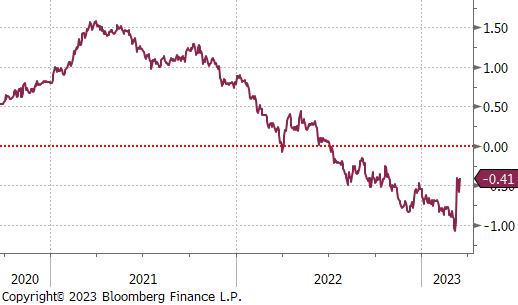
Interest rate markets spun around in an incredibly volatile week but finished the week relatively unchanged. The 10-year Treasury Note ended the week with a 3.43% yield, compared to the 2-Year around 3.84%, leading to a further compression of the 2/10-Year Treasury Spread at -0.41%.