Flack Capital Markets | Ferrous Financial Insider
March 21, 2025 – Issue #476
March 21, 2025 – Issue #476
Overview:
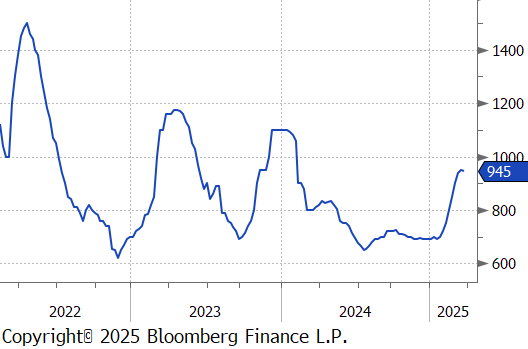
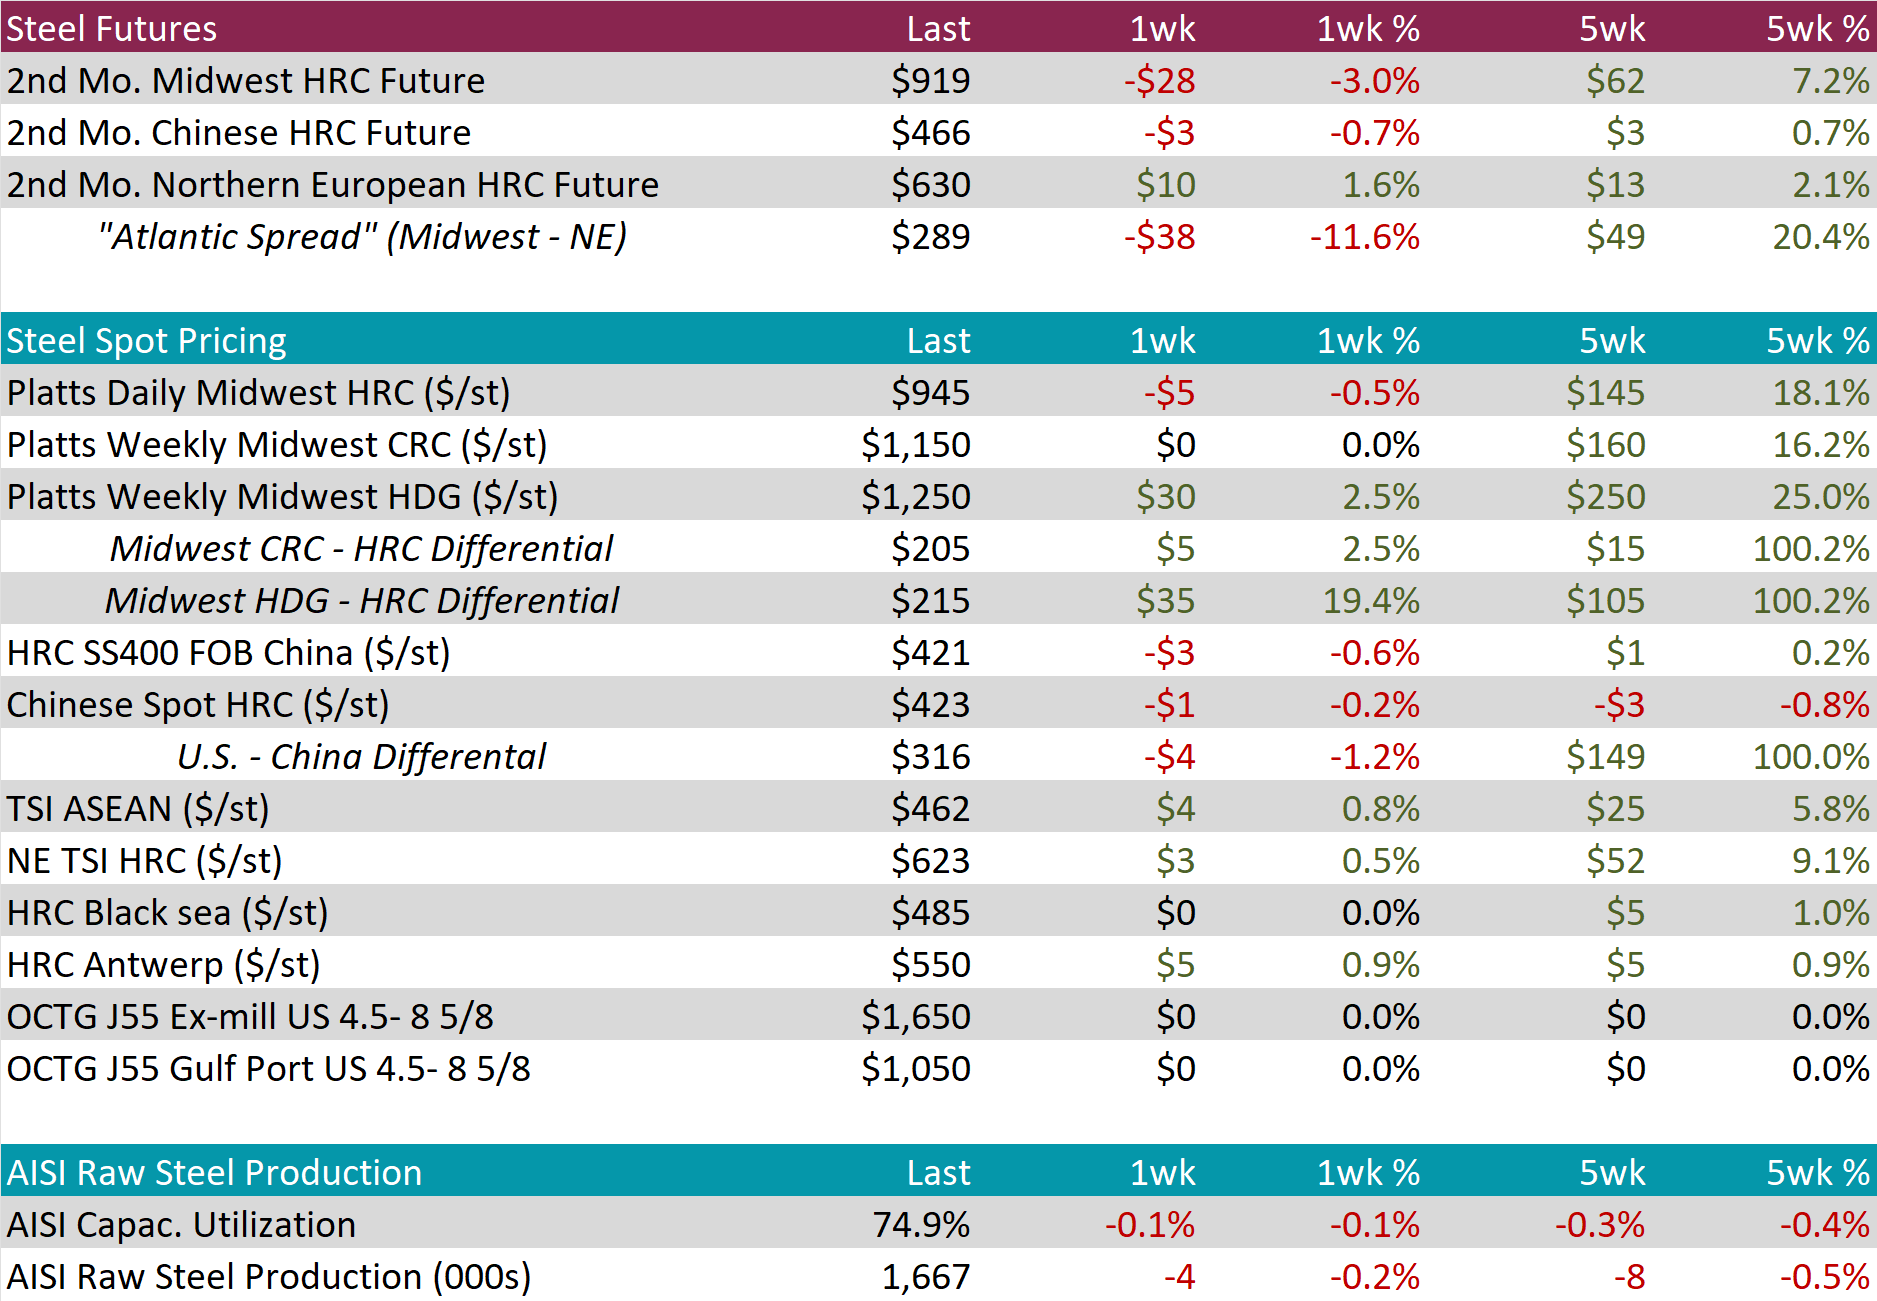
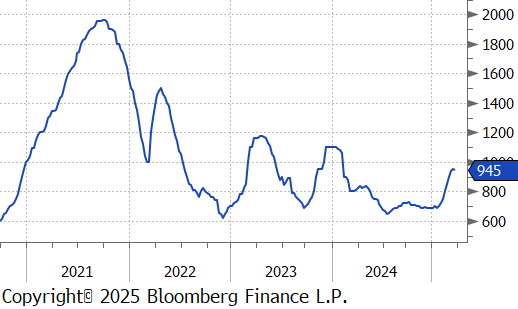
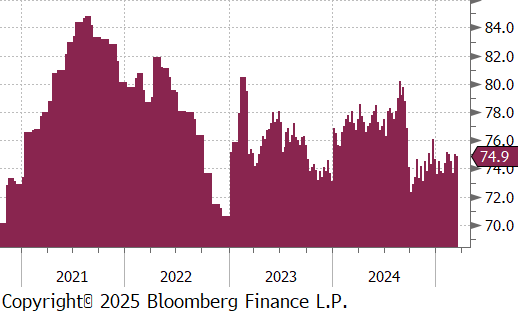
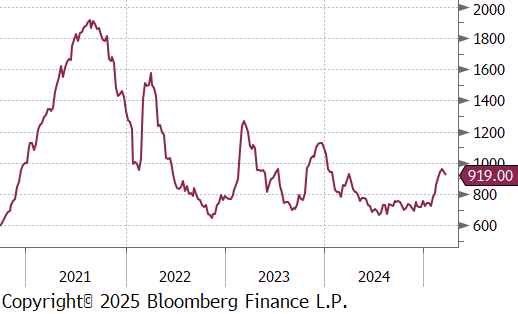
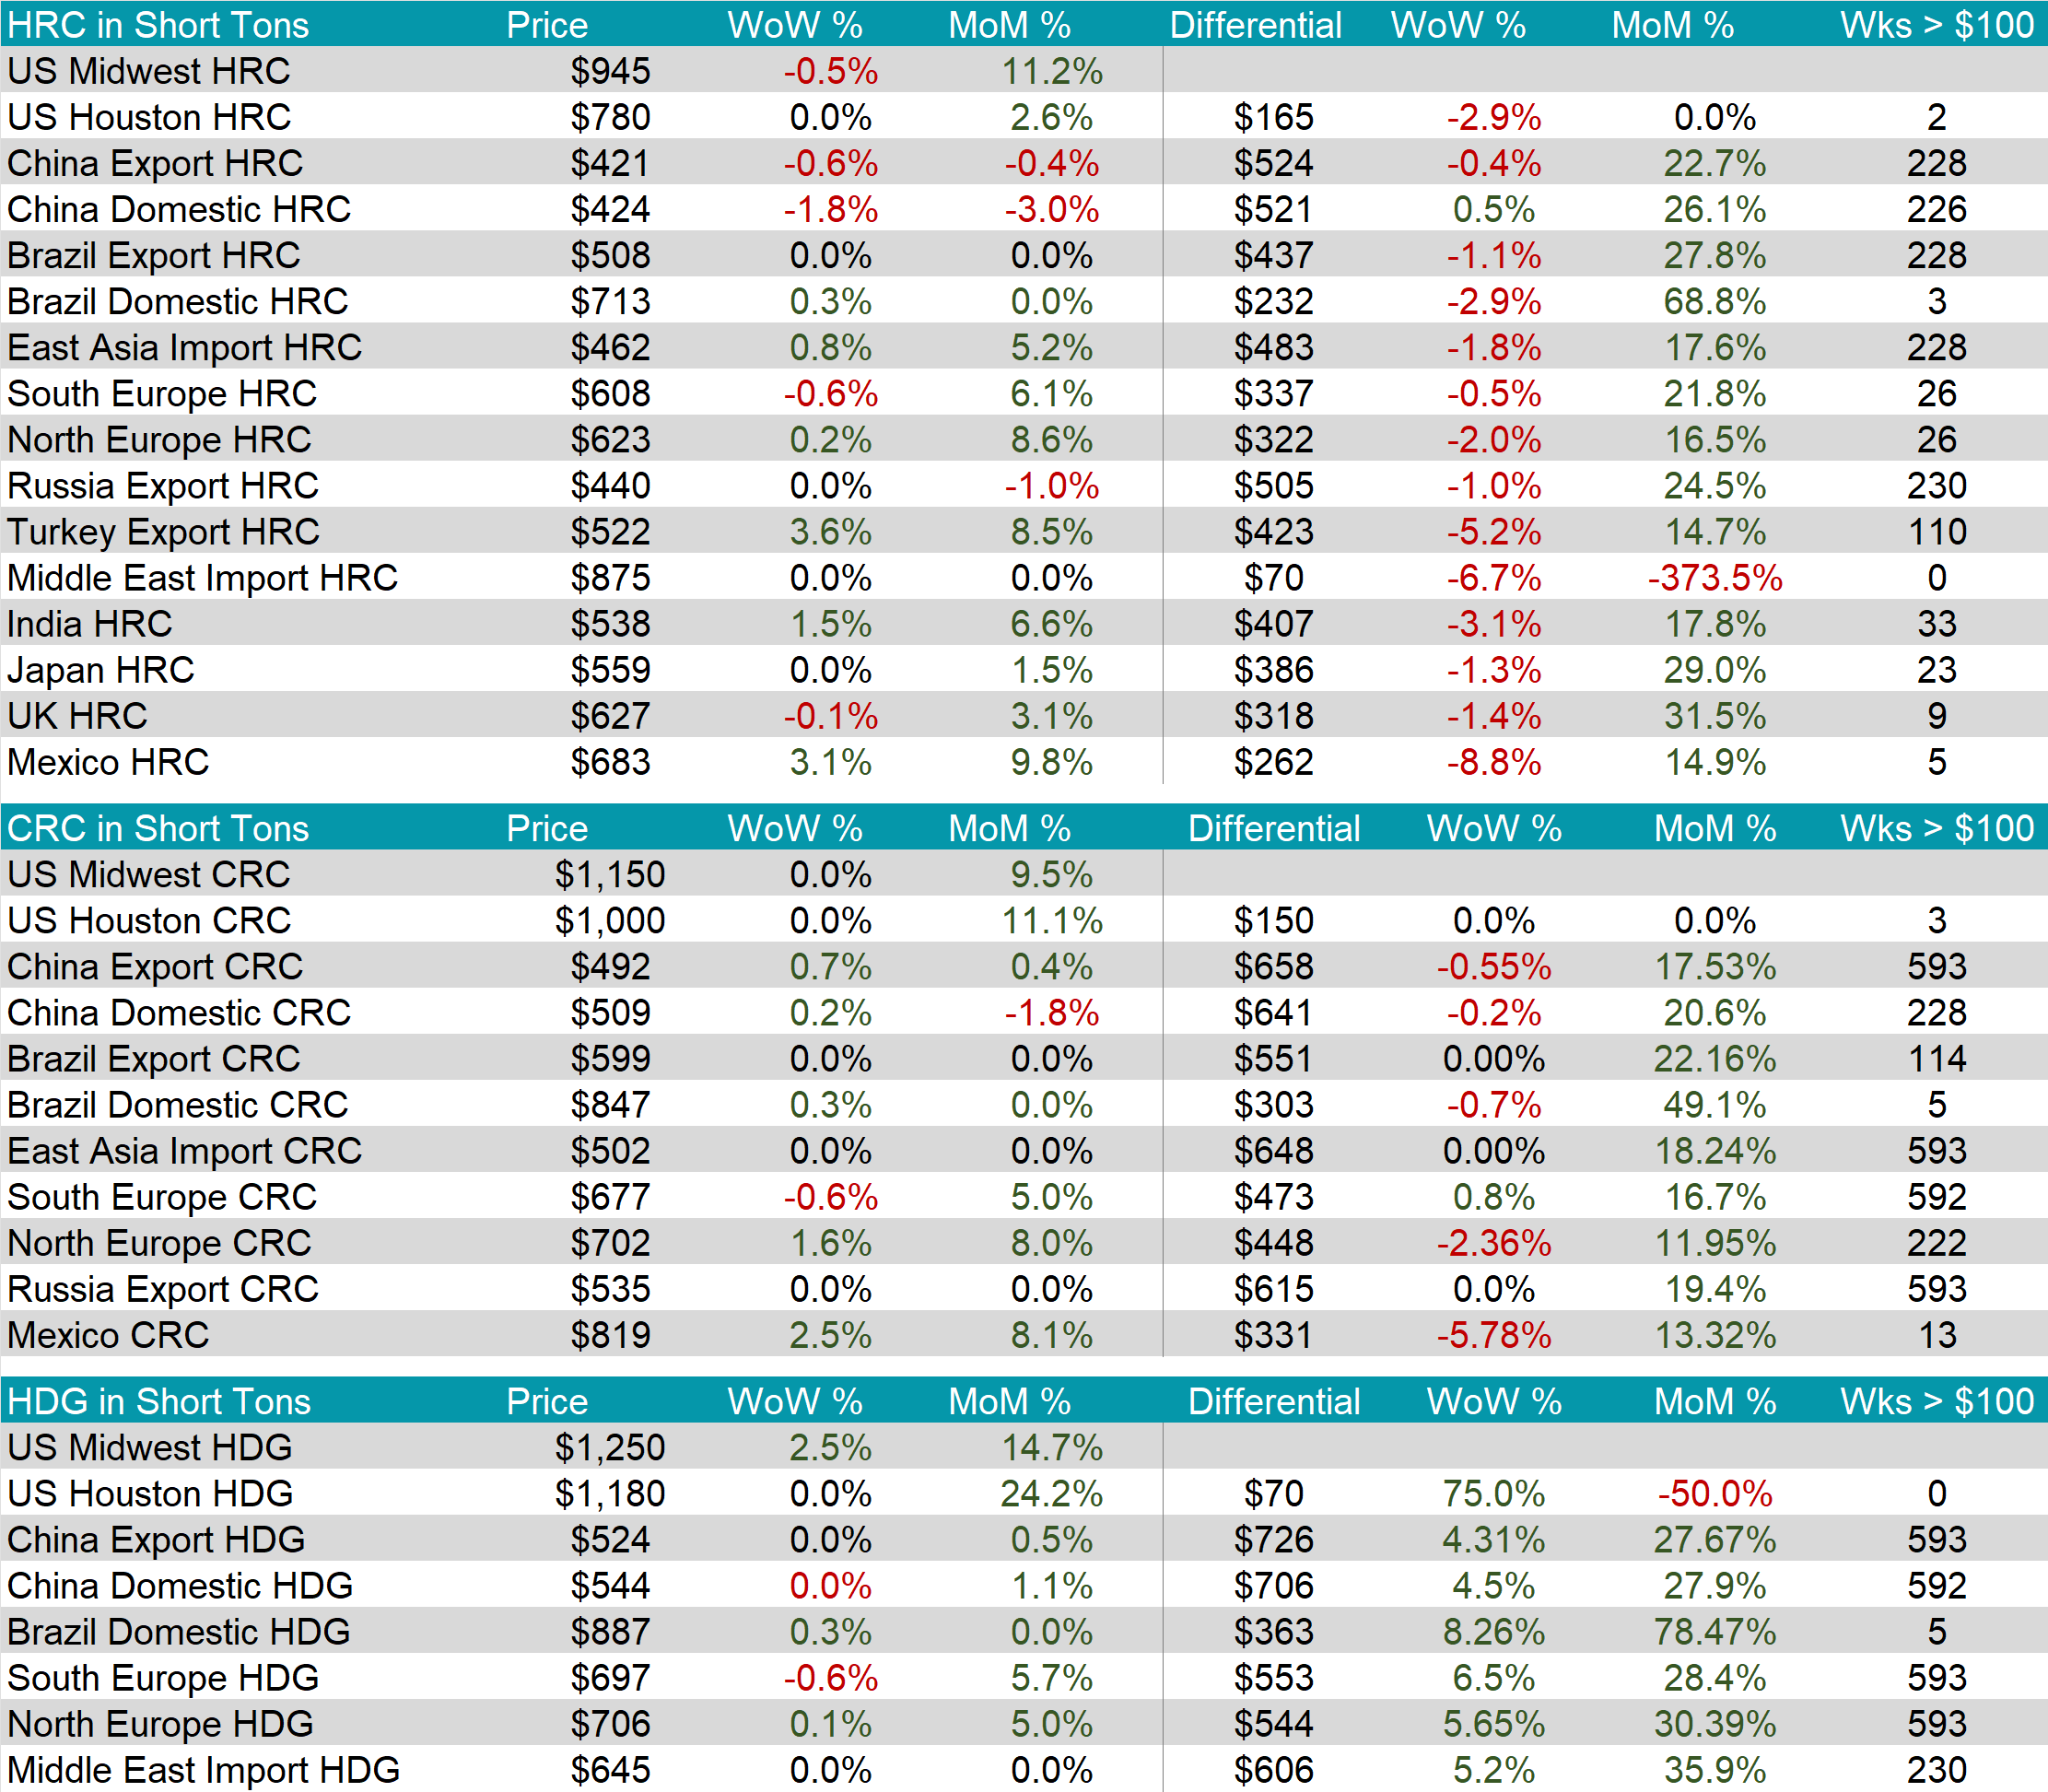
The HRC spot price slipped by $5 or -0.5% to $945, marking the first decline in nine weeks. At the same time, the HRC 2nd month future decreased by $28 or -3.0% to $919, marking the second consecutive decline.
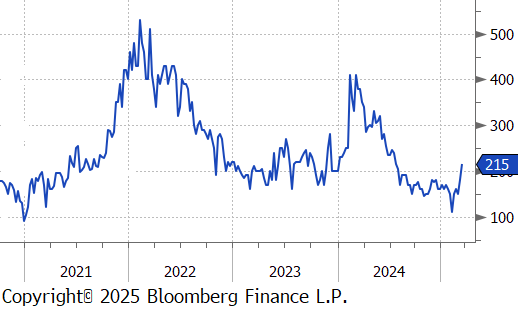
Tandem products were mixed, CRC unchanged and HDG up by $30, resulting in the HDG – HRC differential to jump up by $35 to $215.
Mill production eased once again, with capacity utilization ticking down by -0.1% to 74.9%, bringing raw steel production down to 1.667m net tons.
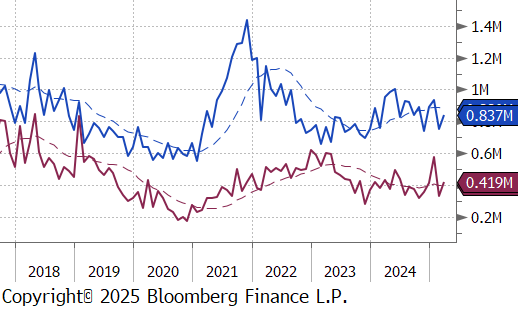
March Projection – Sheet 837k (up 82k MoM); Tube 419k (up 88k MoM)
February Projection – Sheet 755k (down 180k MoM); Tube 331k (down 249k MoM)
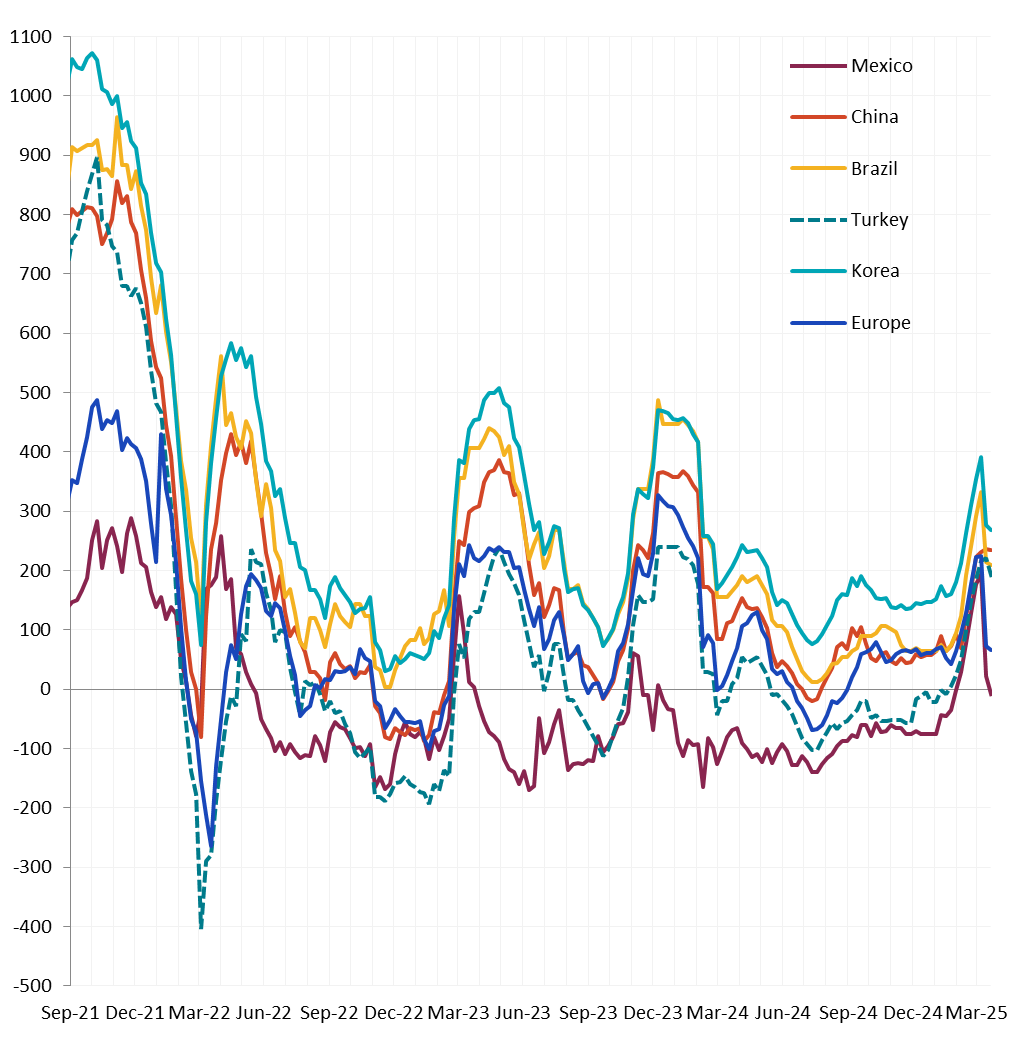
Differentials mainly contracted. Notable price changes were from: China Export HRC down by -0.6%, Korea HRC up by 0.8%, Turkey Export HRC up by $3.6%, and Mexico HRC up by 3.1%.
Scrap
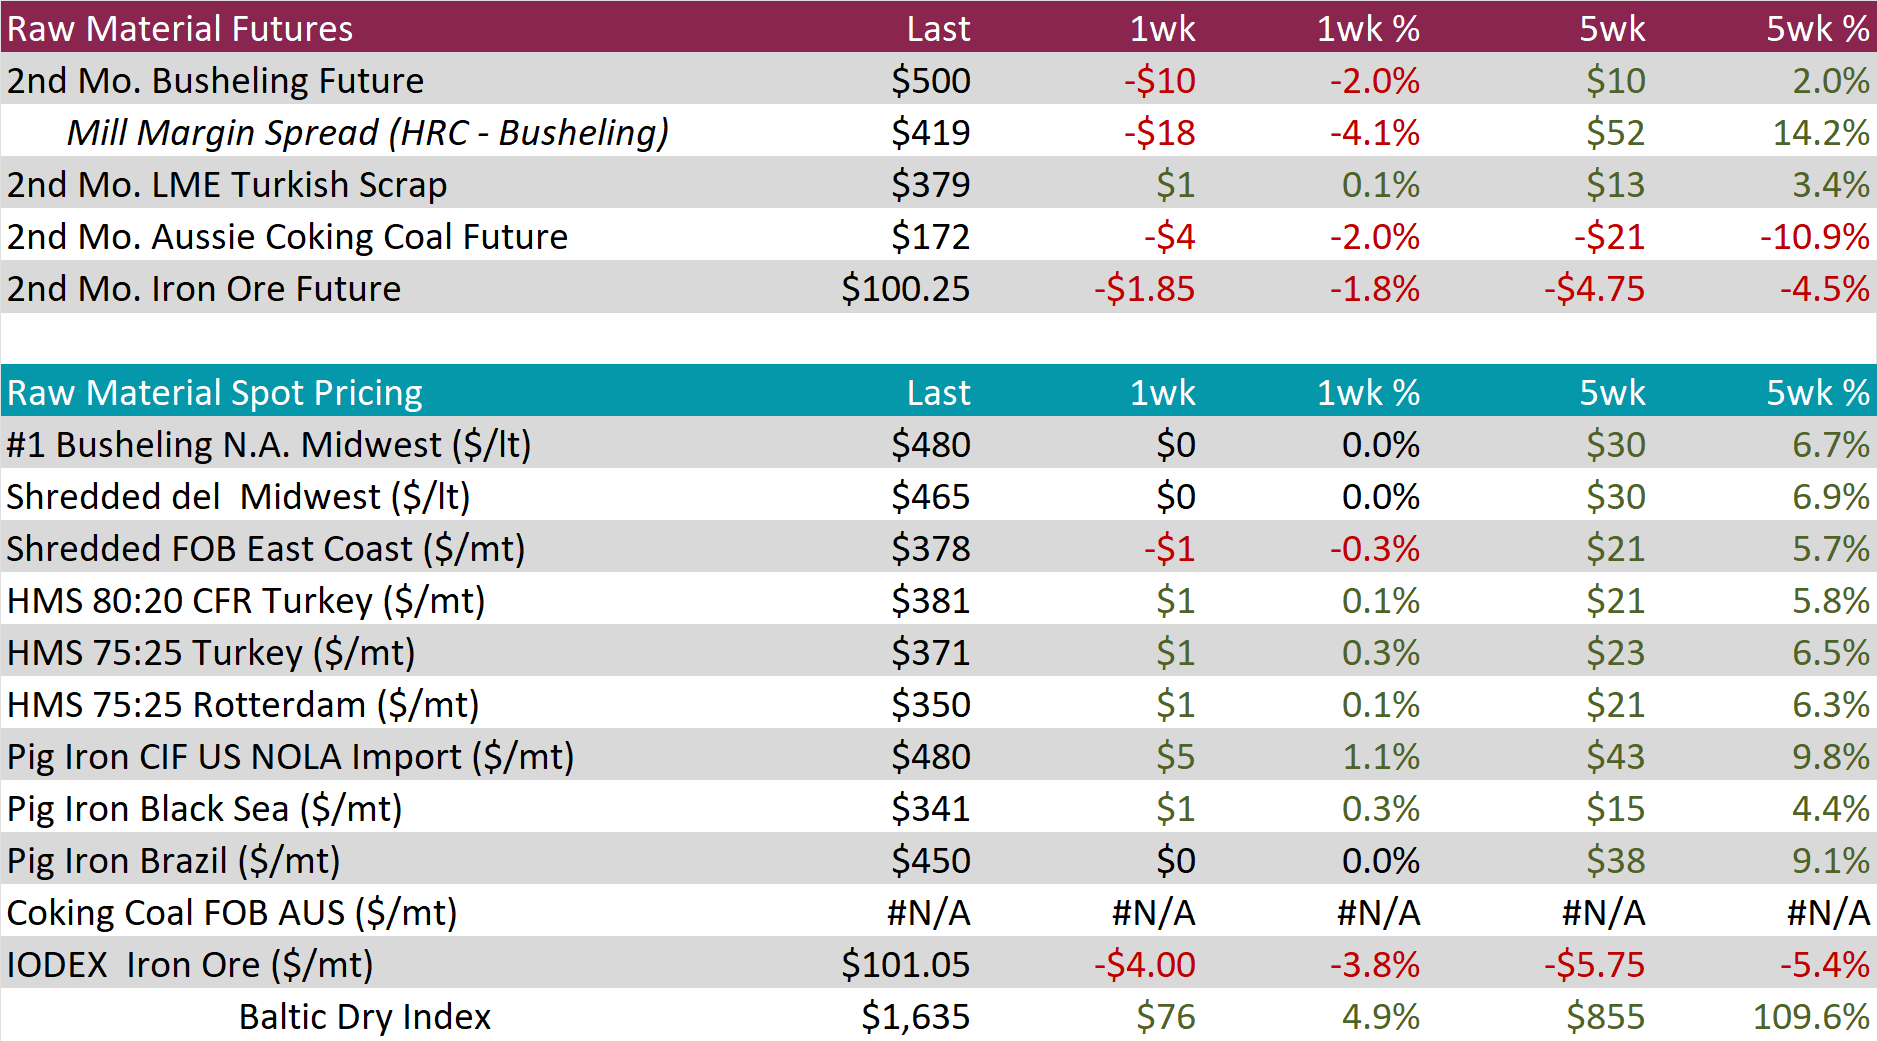
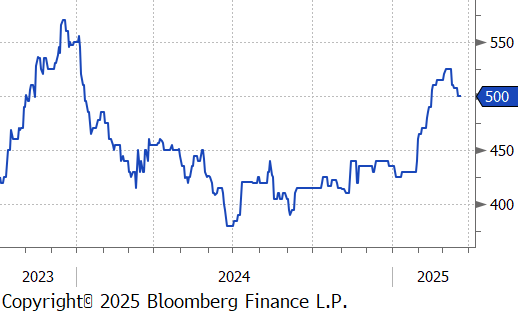
The 2nd month busheling future fell by $10 or -2.0% to $500, marking the second consecutive week of declines.
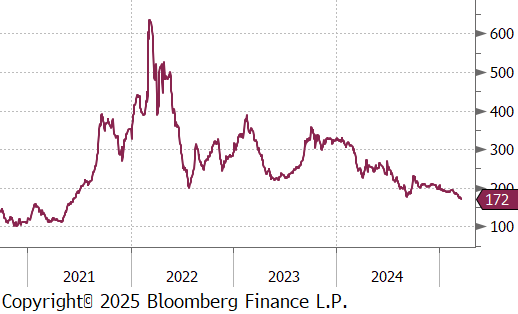
The Aussie coking coal 2nd month future declined by $4 or -2.0% to $172, marking the fourth straight week of losses.
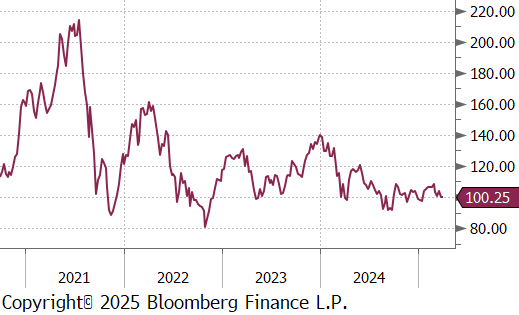
The iron ore 2nd month future decreased by $1.85 or -1.8% to $100.25, retreating from last week’s rebound.
Dry Bulk / Freight
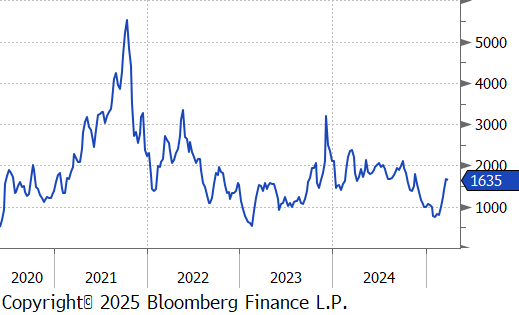
The Baltic Dry Index climbed by $76 or 4.9% to $1,635, marking the fifth consecutive week of increases and the highest level since October 2024.
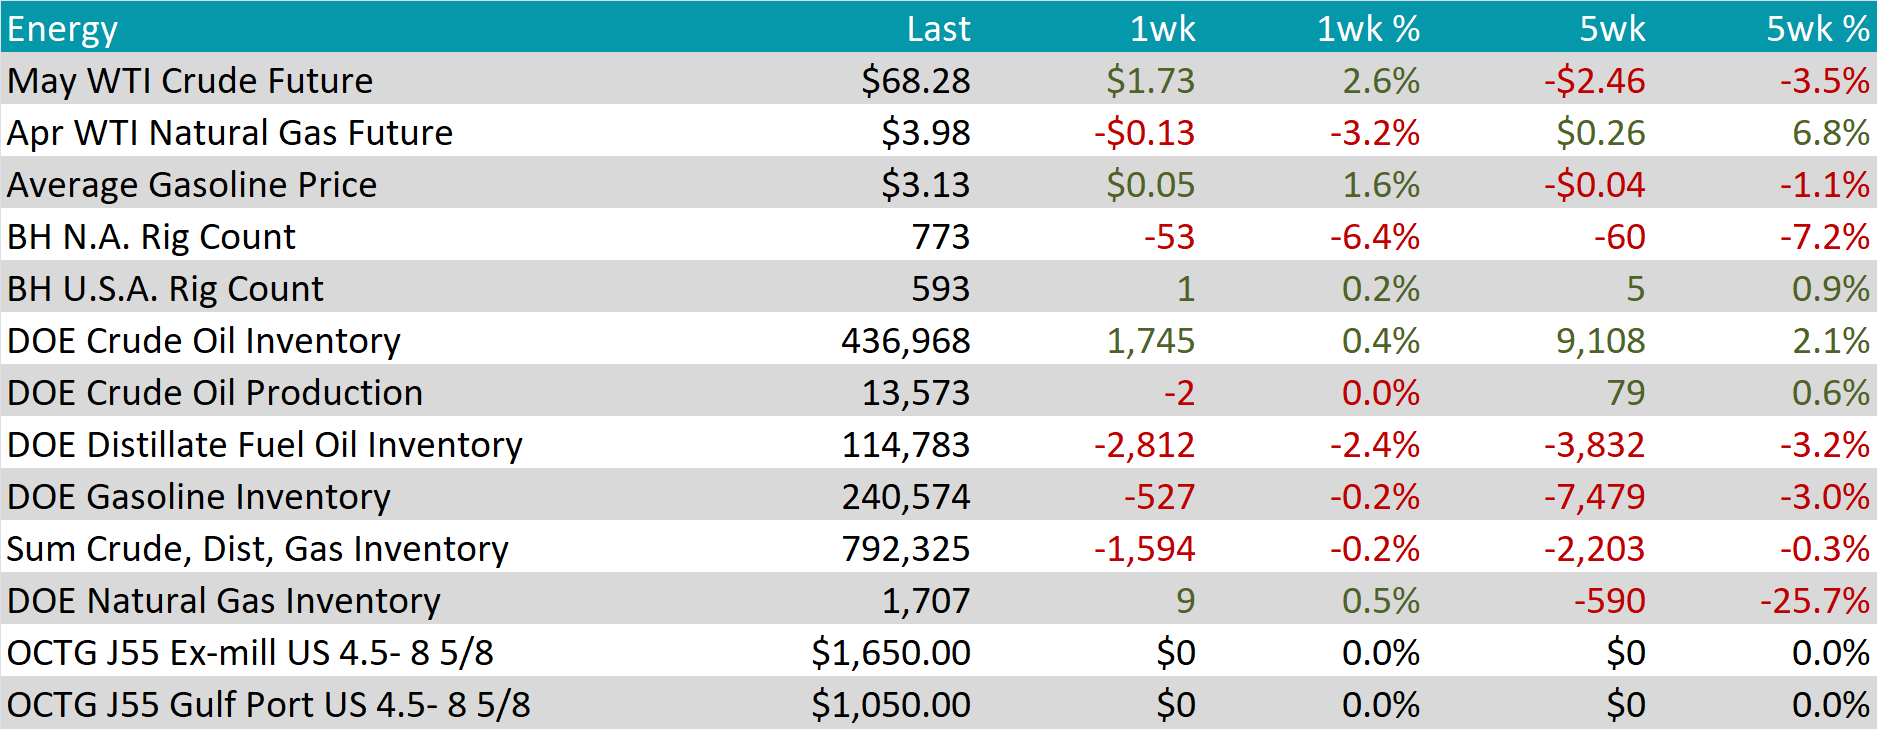
WTI crude oil future gained $1.73 or 2.6% to $68.28/bbl.
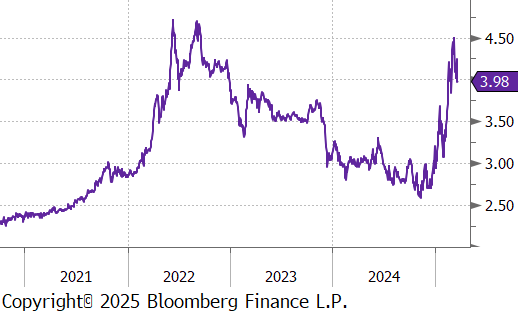
WTI natural gas future lost $0.13 or -3.2% to $3.98/bbl.
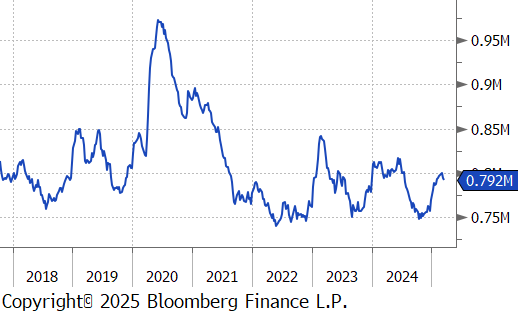
The aggregate inventory level experienced a decline of -0.2%.
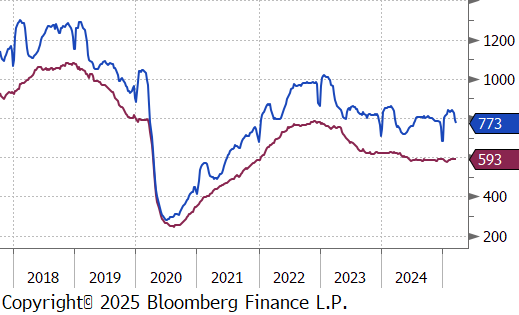
The Baker Hughes North American rig count reduced to 773 rigs, while the US up-ticked to 593.
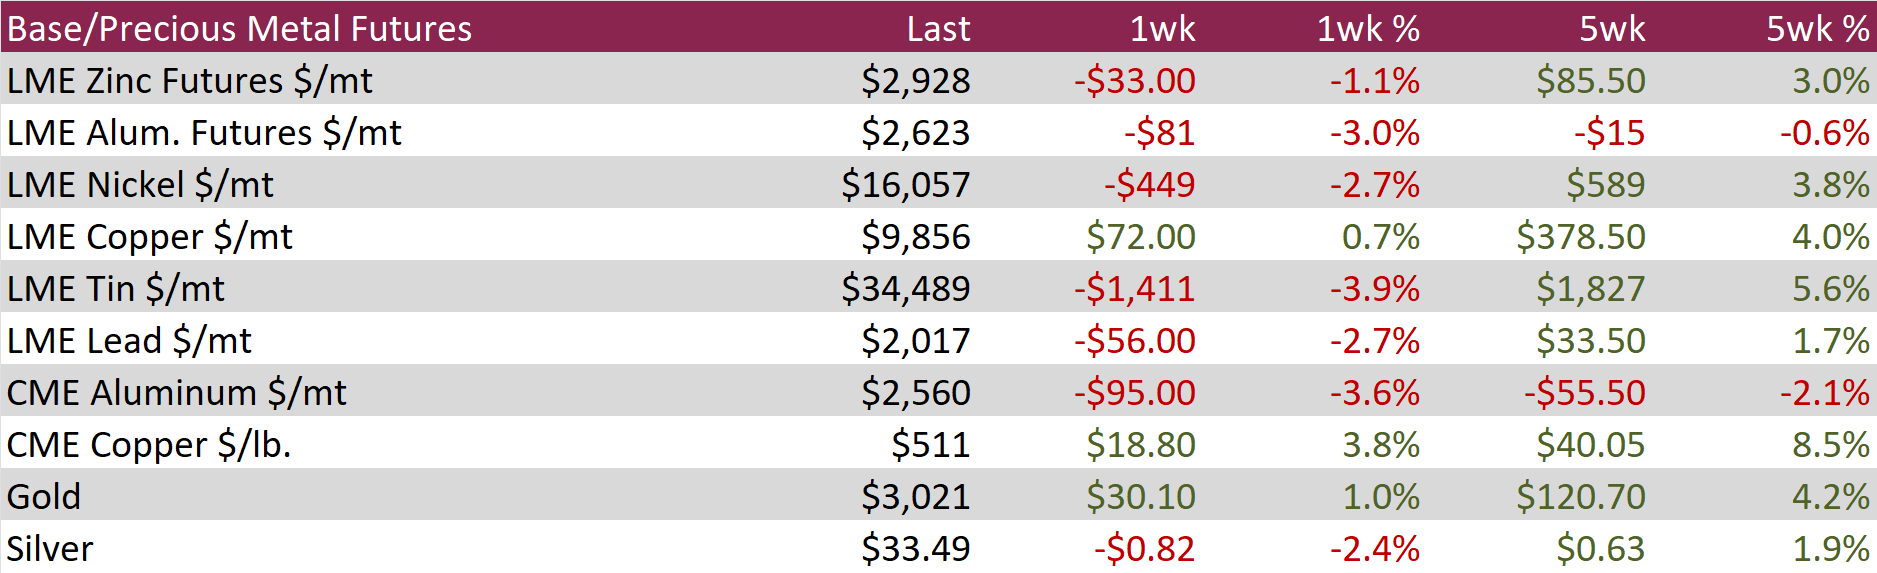
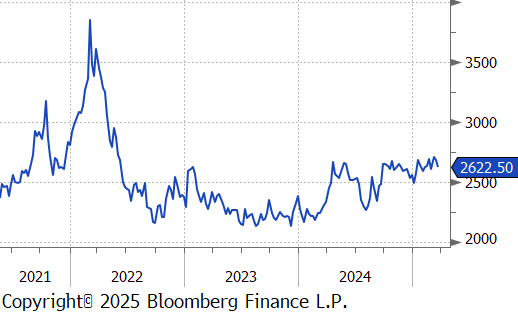
Aluminum futures dropped $81 (-3.0%) to $2,623 as raw material availability improved. Expanded alumina production in Guinea, Australia, and China pushed prices to one-year lows, aiding smelter efficiency. However, finished aluminum supply is set to tighten as China, after hitting a record 44 million tons in 2024, enforces its 45 million-ton cap to curb oversupply and meet carbon targets. Additionally, muted Chinese exports—following the removal of tax rebates—have lifted international prices as domestic sales take priority, reinforcing a more constrained global market.
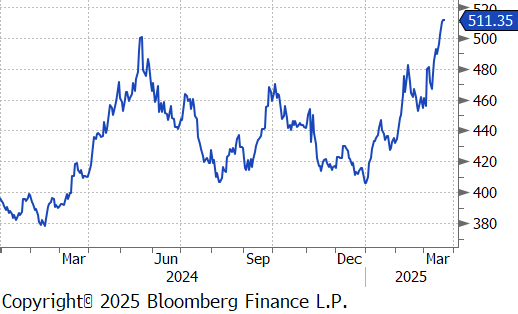
Copper futures jumped $18.80 (3.8%) to $511, nearing record highs amid U.S. tariff speculation and China’s stimulus measures. A recent executive order by Donald Trump investigating copper imports has fueled expectations of a 25% tariff, prompting higher premiums and accelerated shipments, tightening supply elsewhere. Structural constraints, including underinvestment in mining and limited refining capacity, persist as demand surges due to EV growth, AI advancements, and the renewable energy shift. Meanwhile, China’s 5% GDP growth target and fresh economic stimulus further strengthen copper’s bullish outlook.
Precious Metals
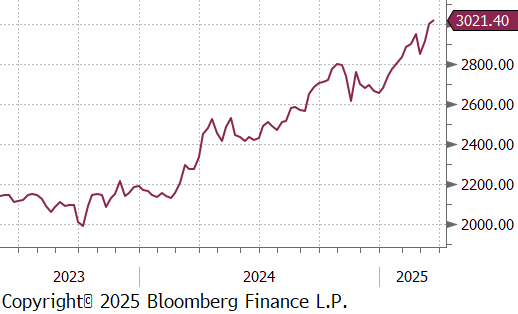
Gold rose by $30.10 or 1% to $3,021, buoyed by safe-haven demand amid ongoing economic and geopolitical uncertainty, as well as growing expectations of Federal Reserve rate cuts. President Donald Trump is set to introduce new reciprocal tariffs on April 2, though he has suggested some aspects of the plan may be adjusted. Meanwhile, tensions in the Middle East escalated as Israel resumed airstrikes targeting Hamas positions in the Gaza Strip. In diplomatic developments, U.S. delegates are set to meet with Russian officials in an effort to broker a ceasefire in the Black Sea and advance peace talks in the Ukraine war, following prior discussions with Ukrainian diplomats. On the monetary policy front, the Federal Reserve left interest rates unchanged last week but signaled the possibility of two rate cuts later this year, reinforcing gold’s long-term bullish outlook as investors seek hedges against economic uncertainty.
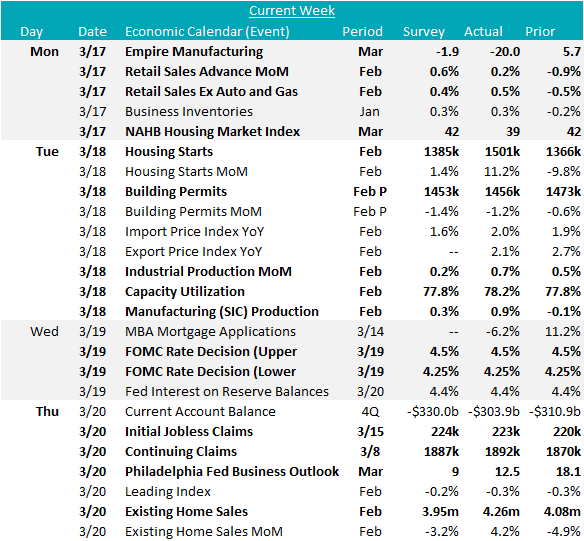
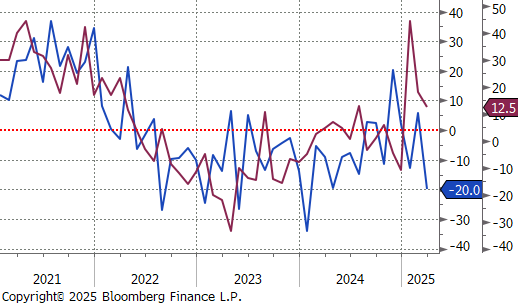
The March Fed Manufacturing Surveys from this week, both declined to varying degrees, Empire (NY) showed a significant contraction, printing down to -20, versus an expected decline to -1.9. Philadelphia, on the other hand, remains in expansion territory, printing at 12.5, down from the February reading, but above the expect level of 9. Furthermore, 6-month outlook for both moved sharply lower to their lowest levels since the end of 2023, while still slightly in expansion territory. More encouragingly, the FED Industrial Production data came in significantly above expectations in February, increasing 0.7% MoM, well above the expected 0.2% rise. This was primarily driven by Manufacturing output, up 0.9% MoM, sharply rebounding from last month -0.1% decline, and above the expected 0.3% increase.
February data on the housing market quelled the most pressing concerns around a rapid deterioration. Housing starts strongly rebounded, rising 11.2% MoM to 1,501k starts, while building permits dipped slightly, down -1.2% to 1,456k. Existing home sales in the same month rebounded to 4.26M, well above the expectation of a sharp decline to 3.95M. Looking forward to March, builders’ sentiment soured, with the NAHB Housing Market Index declining to 39, matching the August 2024 low, with current sales conditions and traffic both pushing the index lower against steady expectations. National Average 30yr Fixed Mortgage Rates remained above the September 2024 low of 6.62%. After falling sharply at the end of February, they have begun to edge higher, rising from 6.7% to 6.73% over the past two weeks.
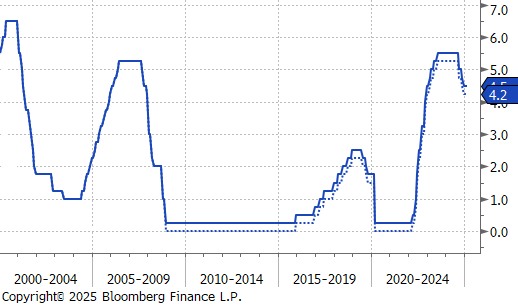
Finally, the FOMC (Federal Open Market Committee) met this week, and left FED Funds Interest Rates unchanged at 4.25-4.5%, as expected. The SEP (Summary of Economic Projections) & Dot Plot is where the real intrigue was, with two rate cuts priced in for this year (unchanged), though the distribution leans hawkish, suggesting the possibility of fewer cuts. Growth expectations were revised down to 1.7%, while inflation and unemployment forecasts rose to 2.7% and 4.4%, respectively. We remain confident in the view that when it is all said and done, one rate cut is the max for this year, and none is the most likely outcome.