Flack Capital Markets | Ferrous Financial Insider
March 24, 2023 – Issue #372
March 24, 2023 – Issue #372
The highlight of this week was one of the most anticipated FOMC rate decisions and press conferences in the current hiking cycle. The final decision on rates was to increase 25 bps (0.25%), which the market priced in as expected. While the decision itself did not shock observants, the two-weeks prior to this decision caused whiplash.
On March 8th in testimony to congress, Fed Chairman Jerome Powell opened the door for reaccelerating interest rate hikes to 50 bps. This was in reaction to a stronger than anticipated labor market and sticky inflation data. Two days later there was a bank-run on Silicon Valley Bank and expectations for severe economic fallout were immediate, culminating market expectation that the Fed would not hike 50 bps and at different subsequent points, the market was pricing in a higher probability of pausing hikes to assess the impact.
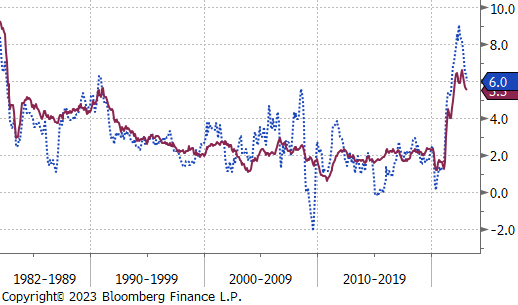
Looking towards the future, the impact of what the Federal Reserve does with interest rates should not be understated. In the Summary of Economic Projections (SEP), the median Federal funds rate projection at the end of 2023 was unchanged at 5.1%. This implies one additional interest rate hike and then holding rates at that level for the remainder of the year. One meaningful change, which informs the groups broader mindset, came from an expectation of slightly higher Core PCE at the end of 2023 and 2024, moving up to 3.6%, and 2.6%, respectively, compared to December projections of 3.5%, and 2.5%. In response, the projection of the Fed funds rate ending in 2024 increased from 4.1% to 4.3%, in essence removing one 25 bps interest rate cut next year.
This means that, the FOMC believe that interest rates will need to be held in a restrictive range for a longer period than they did in December, which was also confirmed in Chairman Powell’s press conference. This outlook sits in stark contrast with the current market view. According to data on Friday the 24th, expectations are for three 25 bps rate cuts this year, and four more 25 bps cuts in 2024.
The Occam’s Razor interpretation of this data is that the economy would soon be in a significant recession, which would require the Federal Reserve to start cutting rates sharply.
When thinking about what this will mean for steel, the short and longer-term implications vary, widely. Looking back at the SEP the Fed still sees positive, albeit minimal, GDP growth of 0.4% this year, and 1.2% in 2024 (down from 0.5%, and 1.6%, respectively). If that is the case and we avoid a severe turndown, demand will be meaningfully higher than the market anticipates and has inventory for. This would set up a similar dynamic to what happened at the end of last year which caused the sharp rally observed over the last 4 months. On the other side, the pace at which interest rates have climbed is unprecedented and the full implication of that and tighter credit from the banking sector will take time to understand. In short, there is volatility ahead and times like these are the reason for risk management.
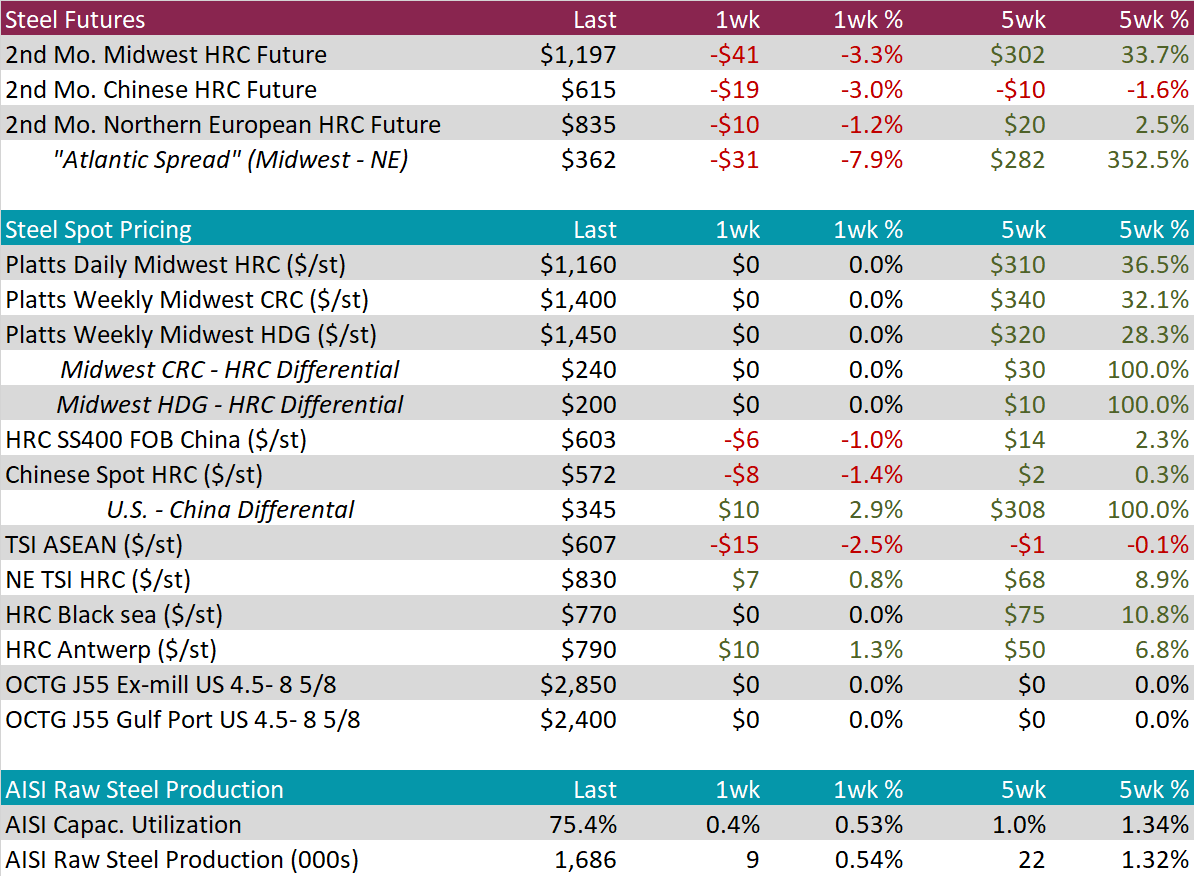
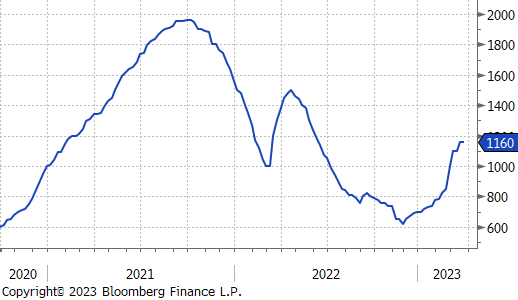
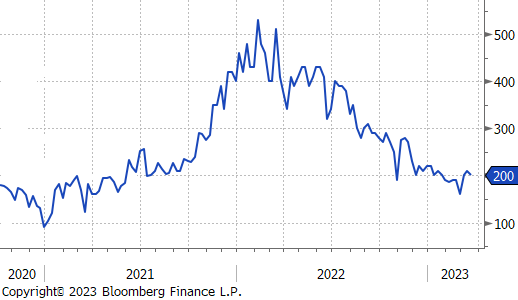
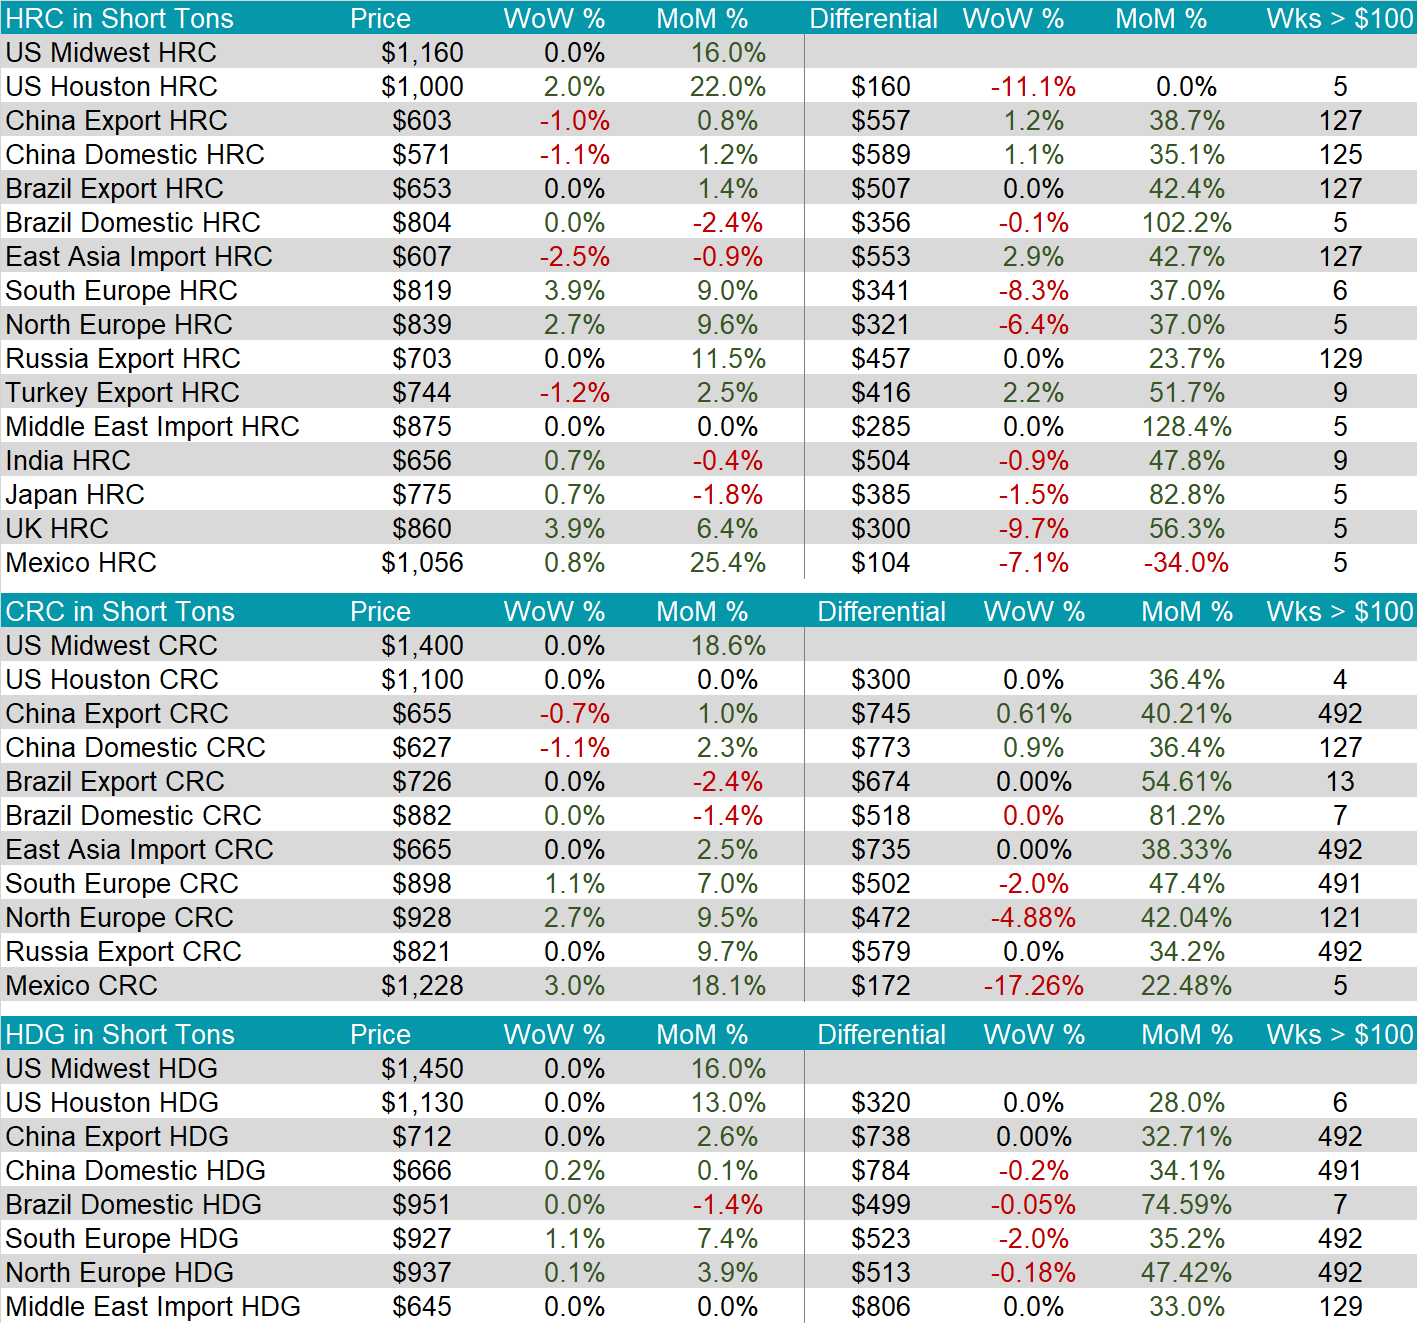
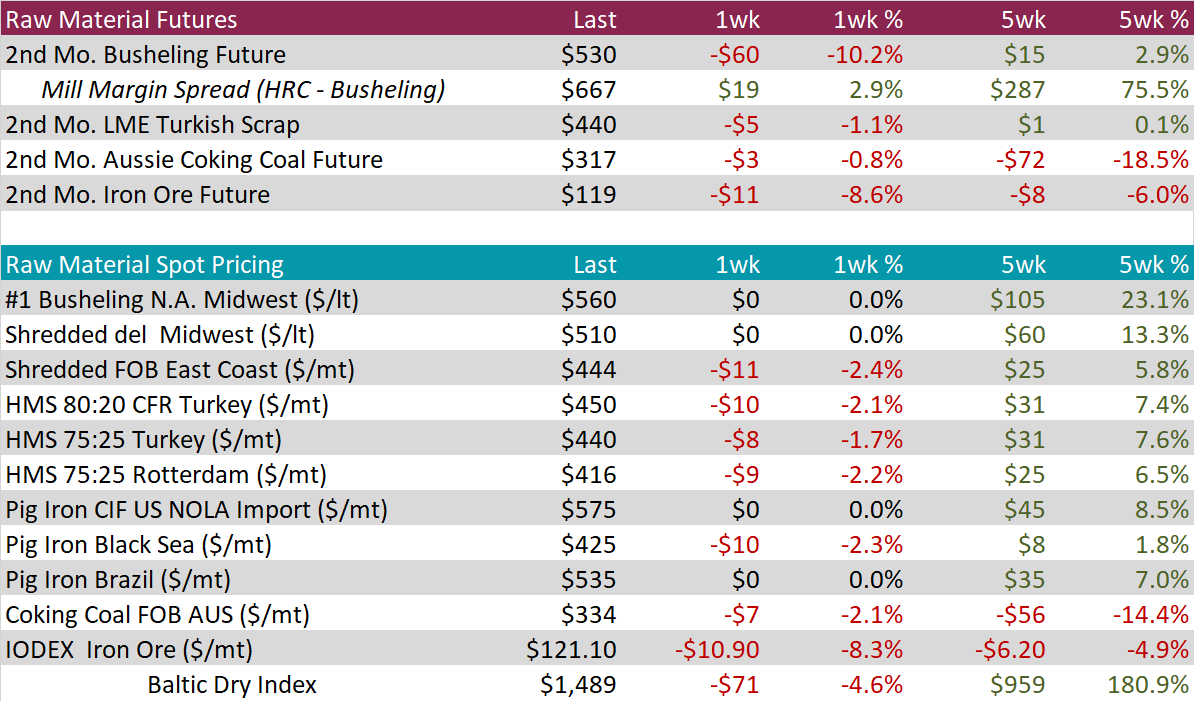
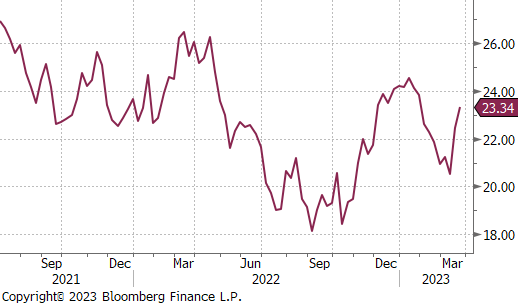
Domestic HRC prices were unchanged in the spot market last week with very little activity. On the future’s side, the 2nd month future (April) was down 3.3%. Since March 9th, the day before Silicon Valley Bank collapsed, the front 6 months of futures contracts have fallen 10.9%. Tandem products were also unchanged on the week, leaving differentials unchanged.
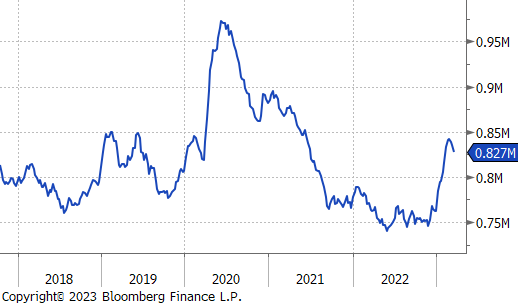
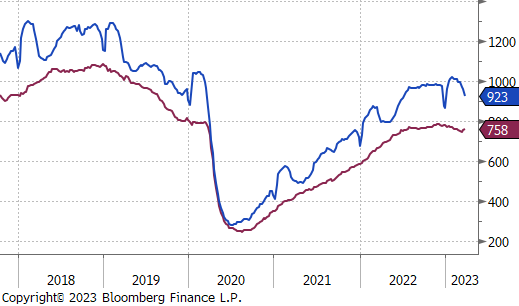
U.S. Domestic Production increased last week as capacity utilization reached 75.4%, it’s highest level since mid-October last year.
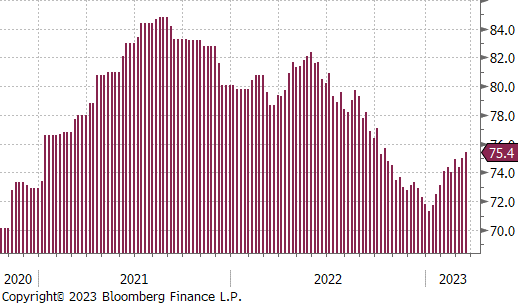
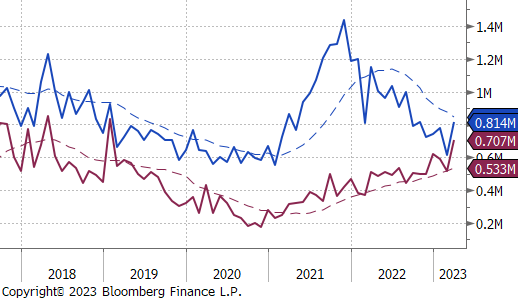
March Projection – Sheet 814k (up 200k MoM); Tube 707k (up 193k MoM)
February Projection – Sheet 615k (down 163k MoM); Tube 514k (down 73k MoM)
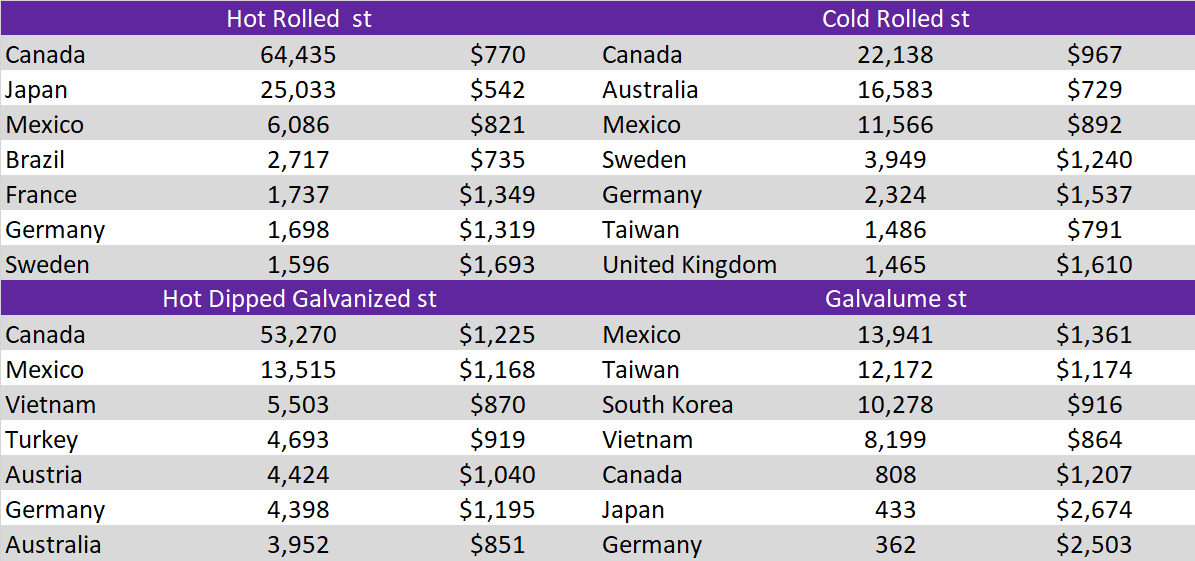
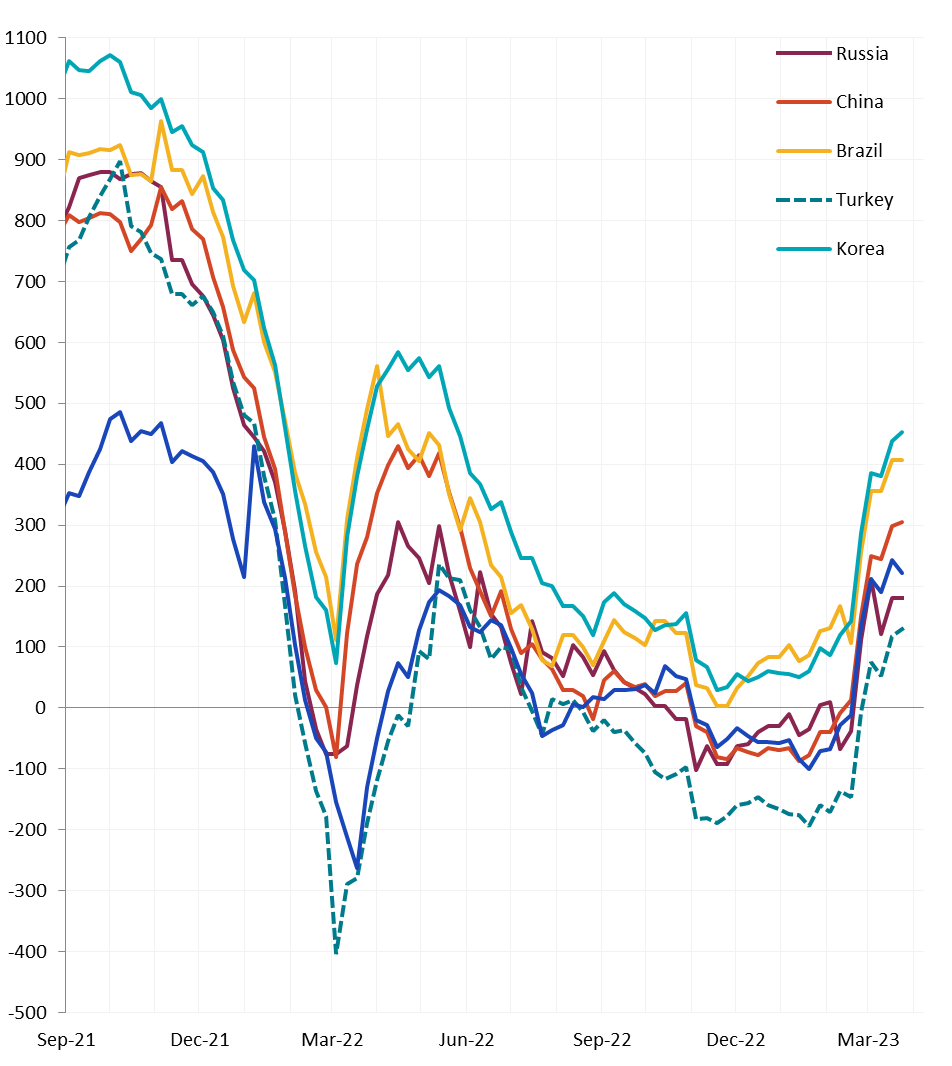
The recent trend of increasing differentials continued for most of the watched countries. This week, however, the increase was driven by a lower global price, which fell for the first time in 16 weeks.
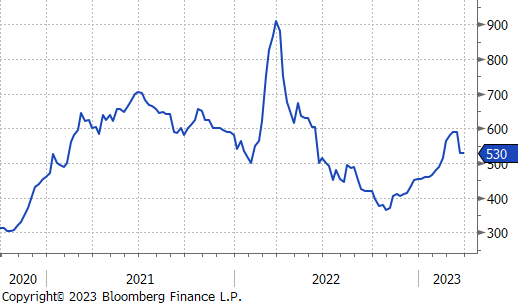
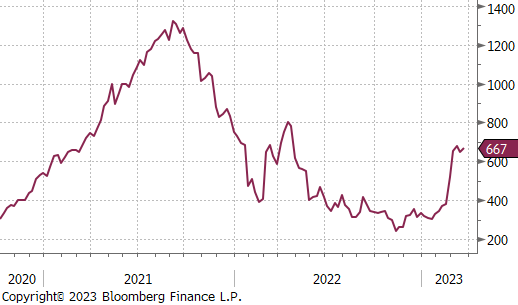
It was another quiet week in the spot market for busheling with April settlements still multiple weeks away, however the futures solid off significantly, with the 2nd month (May) contract down 10.2%. This led to a slight uptick in mill margin spread with HRC futures prices also down, but not as sharply.
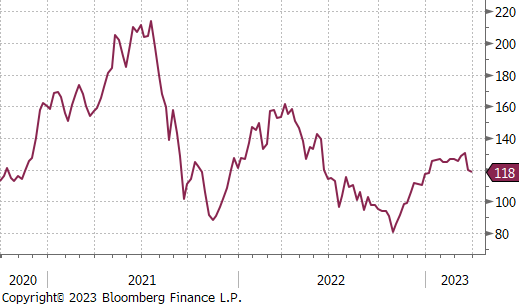
Iron ore futures and spot prices (IODEX index) were both down sharply last week, 8.6% and 8.3%, respectively.
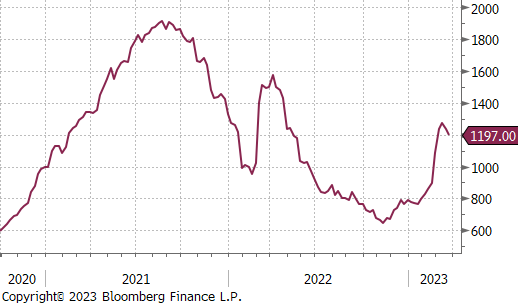
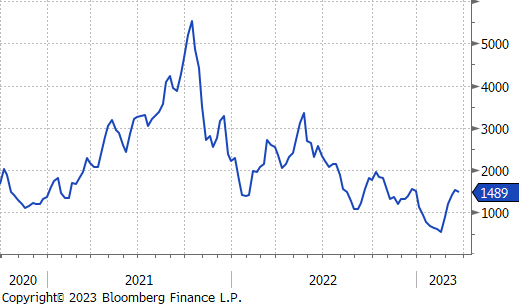
The Baltic dry index was down 4.6%, even with this week’s move lower, the current level of $1,489 is still 108.9% higher than the price from 5 weeks ago.
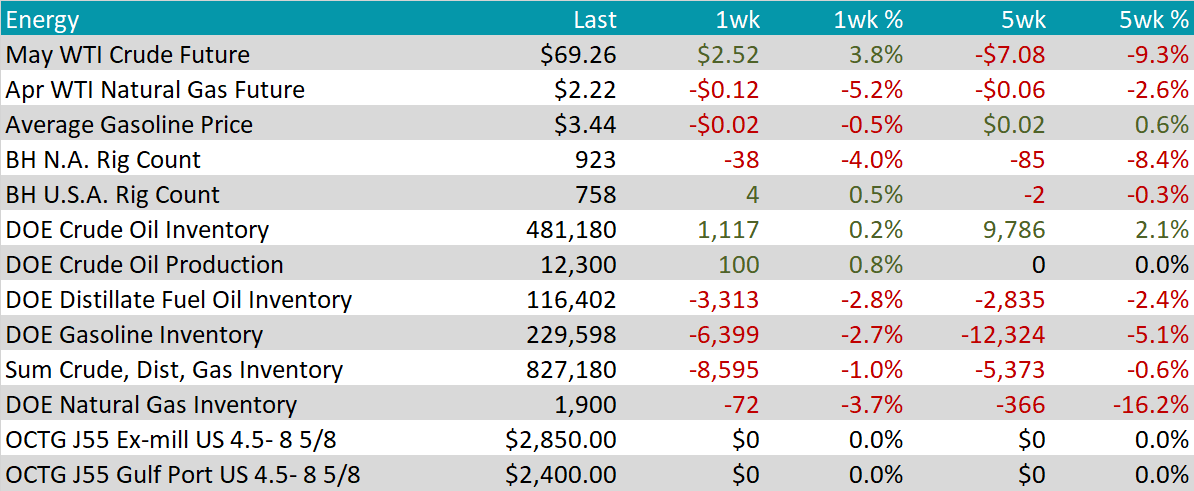
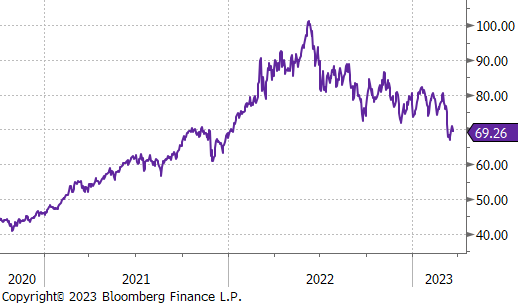
May WTI crude oil future gained $2.52 or 3.8% to $69.26/bbl. The price rebounded after two weeks of falling prices brought the future to its lowest level since late-December 2021.
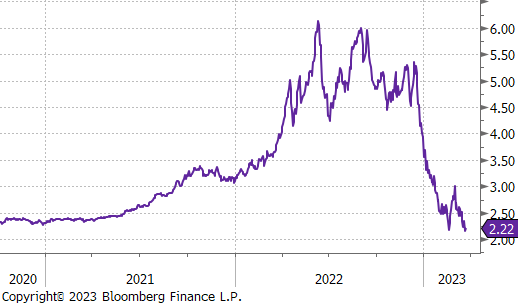
April WTI natural gas future lost another $0.12 or 5.2% to $2.22/bbl.
The aggregate inventory level was lower again this week, down 1%.
The Baker Hughes North American rig count was down 38 rigs, while the U.S. rig count was up by another 4 rigs.
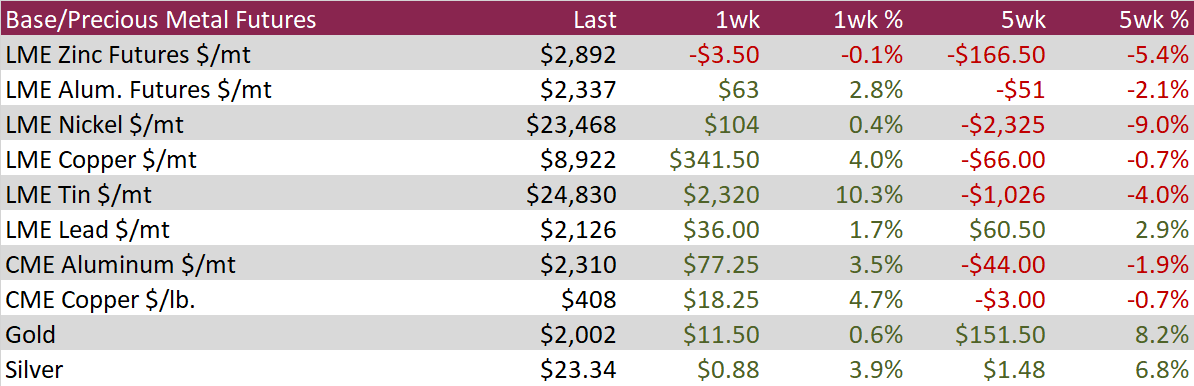
Aluminum futures on the LME rallied 2.8% during the week following two consecutive weeks of declines. The dollar paired gains and Chinese demand data provided some support to base metals as inventories in China retreated from a recent peak.
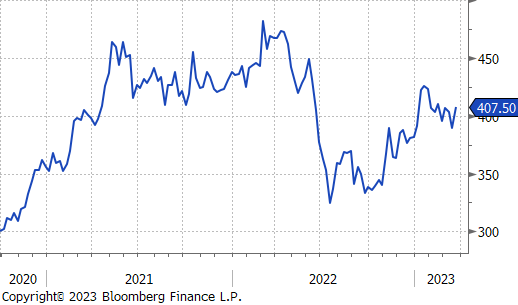
Copper futures on the CME rallied 4.7% during the week, erasing declines from the previous week and recapturing the psychological $4/lb level. This was the largest weekly advance for the red metal since Mid-January despite little-change in its fundamental outlook.
Base metals, along with other dollar-priced commodities, have been weighed down by fears around a potential banking crisis and the culmination of aggressive interest rate hikes by the US Fed. Concern around these headwinds eased late in the week following Jerome Powell’s press conference which was notably less hawkish than any recent testimony or speeches.
Silver futures advanced an additional 3.9% on the CME during the week, extending last weeks rally of 9.5% and making silver the second strongest performer behind Gold over the past 5 weeks. Silver futures have weakened YTD while its precious metal counterpart, Gold, has advanced approximately 8% YTD as investors prepare for Fed pause or pivot, and as banking sector fears boost haven demand. The strong correlation between these two precious metals may keep silver prices supported if gold continues to push higher.

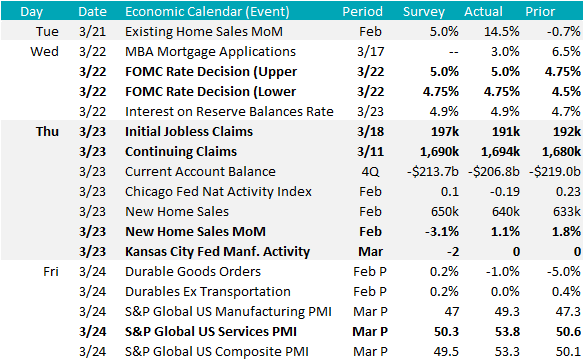
This week was light on economic data, outside of the FOMC decision.
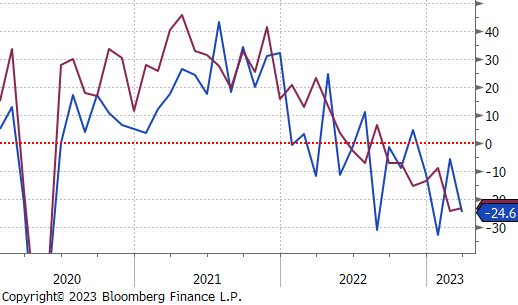
The March Kansas City Federal Reserve Manufacturing survey came in slightly better than expectations but was unchanged at 0 on the month, suggesting that manufacturing in the region has been steady since January.
Housing data in February came in slightly above expectations for both existing and new home sales.
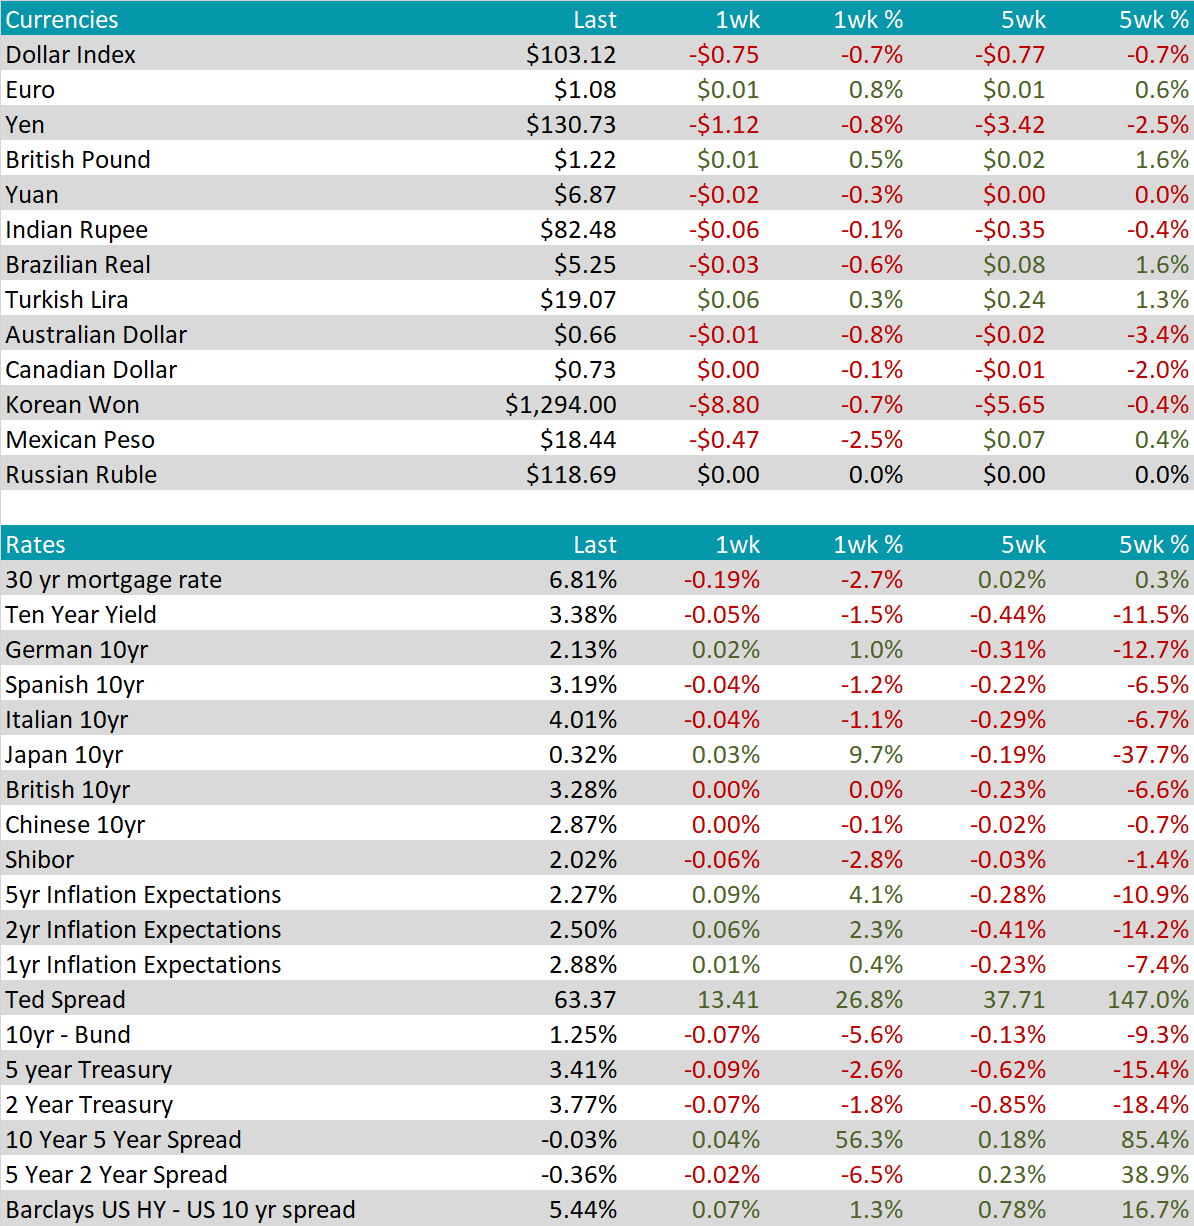
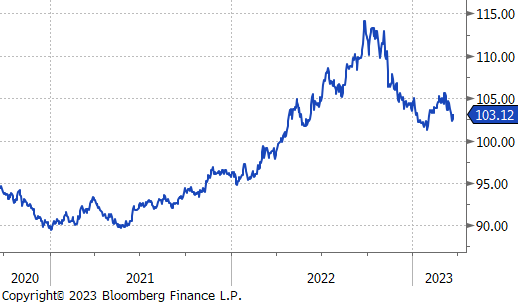
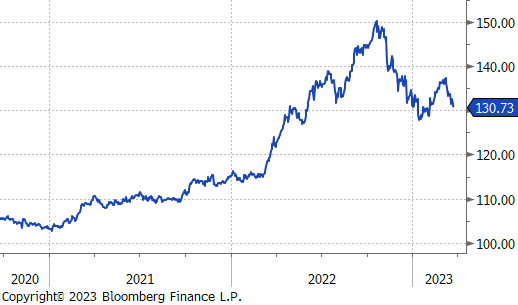
The U.S. dollar was down $0.75 last week, while the Japanese yen, appreciated towards $130. This marked the strongest Yen level in over 6 weeks. During that period, Japanese topline inflation rate slowed sharply in February, while underlying prices ex-energy increased.
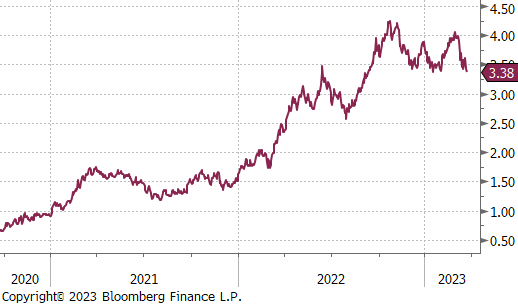
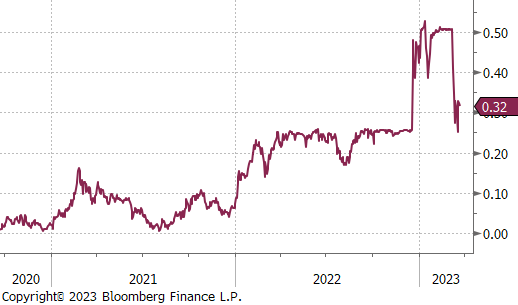
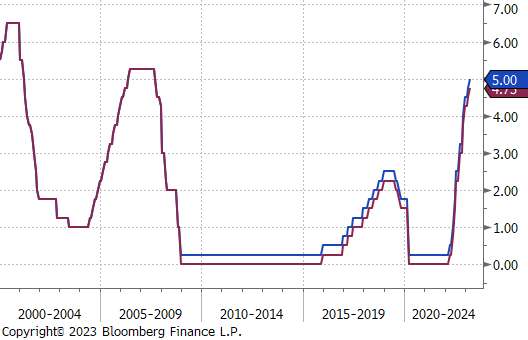
On the rates front, Japanese central bankers continued to emphasize their commitment to ultra-easy monetary policy, while the US Federal Reserve hiked rates by 25 bps. The U.S. 10yr treasury yield was down 5 bps to 3.38%, just above it’s recent low of 3.37% which was last tested on January 18th. The Japanese 10yr treasury yield was up 3 bps to 0.32%.