Flack Capital Markets | Ferrous Financial Insider
March 29, 2024 – Issue #425
March 29, 2024 – Issue #425
Overview:
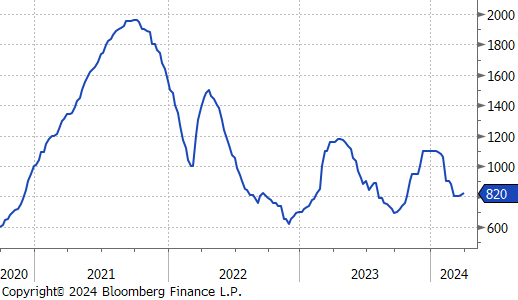
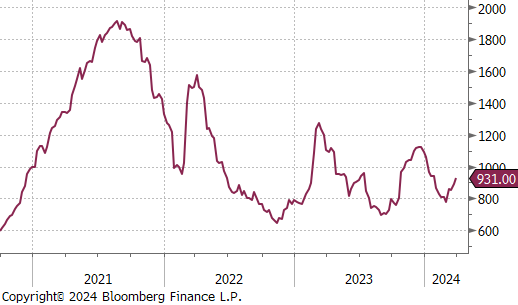
The HRC spot price rose further, this week increasing by $10 or 1.2% to $820, resulting in the 5-week change to go up by $121 or 14.9%. At the same time, the 2nd month future jumped up by $42 or 4.7% to $931, hitting its highest level in nine-weeks.
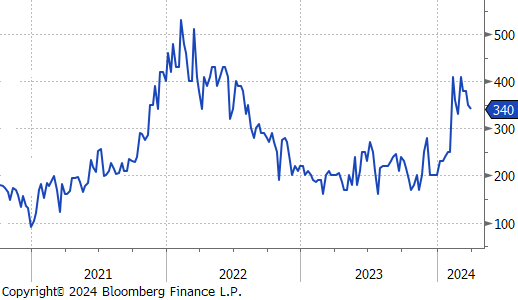
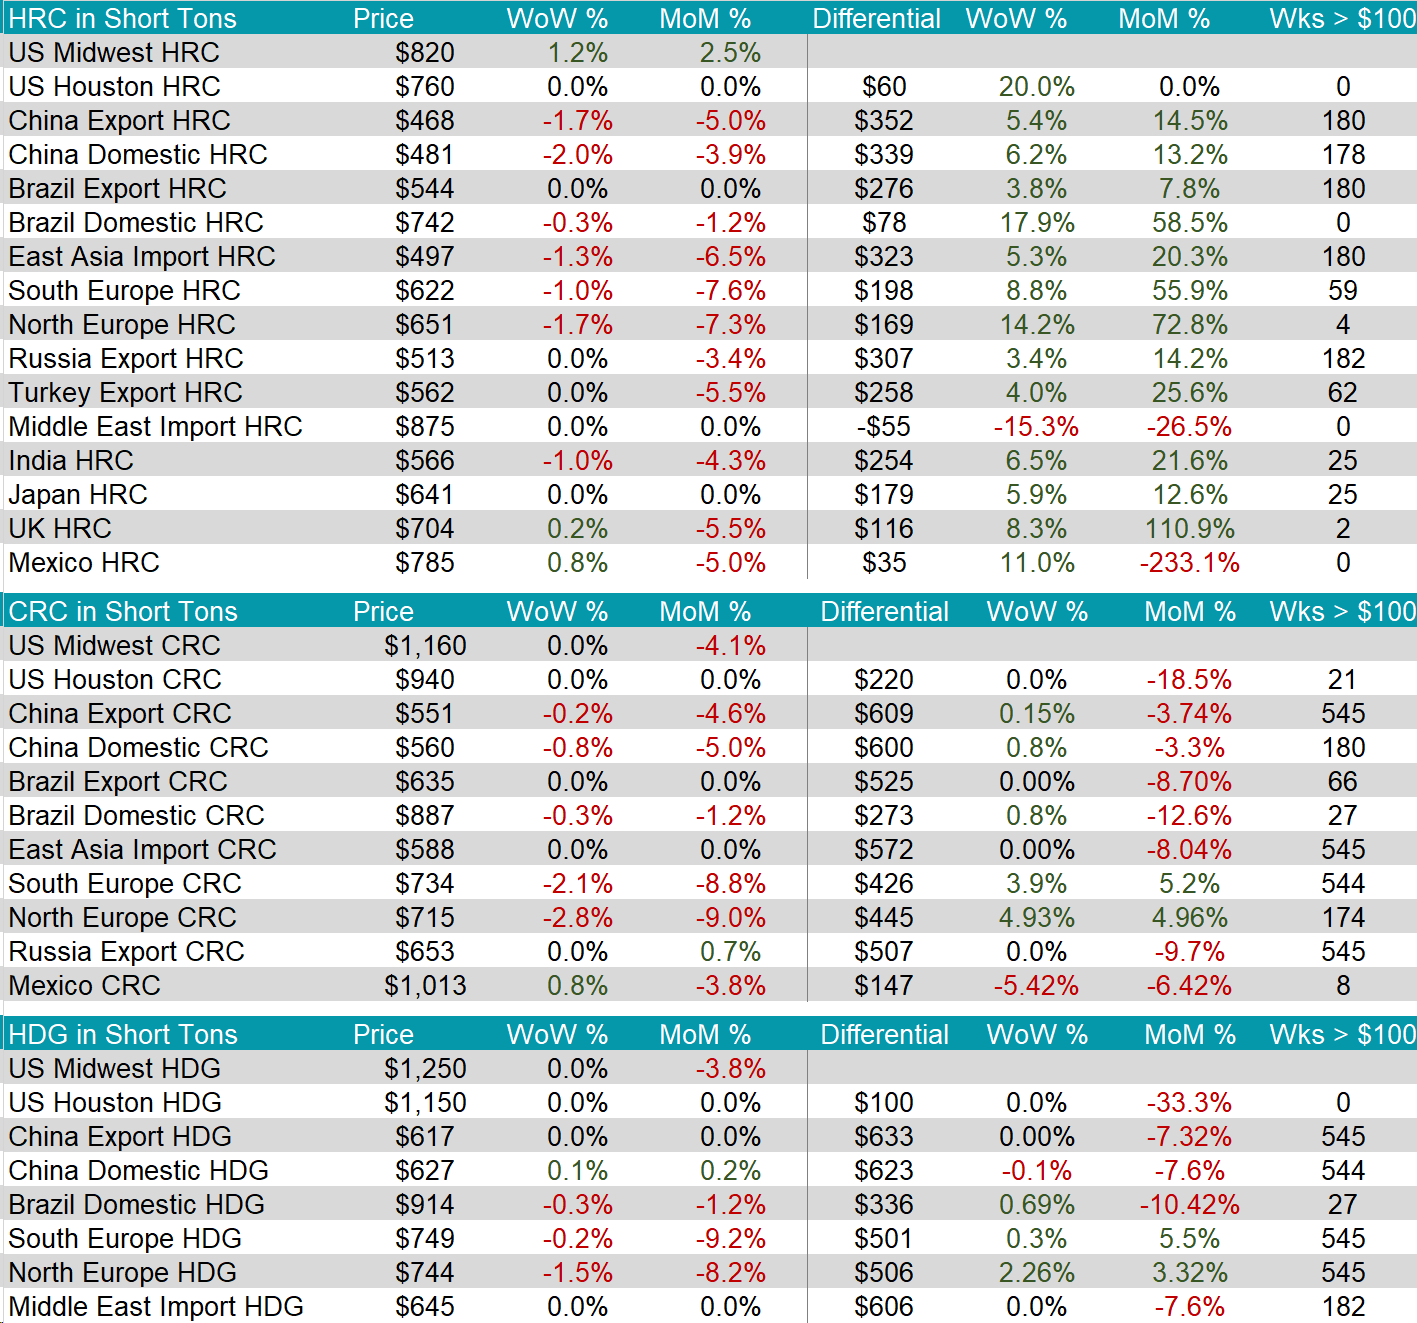
Tandem products both remained unchanged, causing the HDG – HRC differential to fall by $10 or -2.9% to $340.
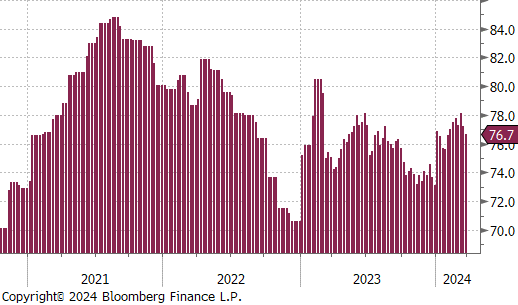
Mill production continued to scale back, with capacity utilization ticking down by -0.5% to 76.7%, bringing raw steel production down to 1.703m net tons.

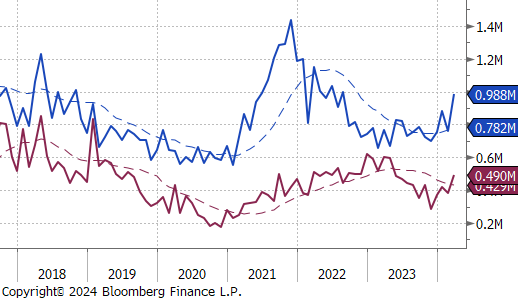
March Projection – Sheet 988k (up 229k MoM); Tube 490k (up 107k MoM)
February Projection – Sheet 759k (down 123k MoM); Tube 383k (down 37k MoM)
**While the uptrend remains intact, the initial estimate for Feb/Mar was reduced by ~160k, last week. This suggests those tons are being impacted by continued supply chain disruption from earlier in the first quarter.

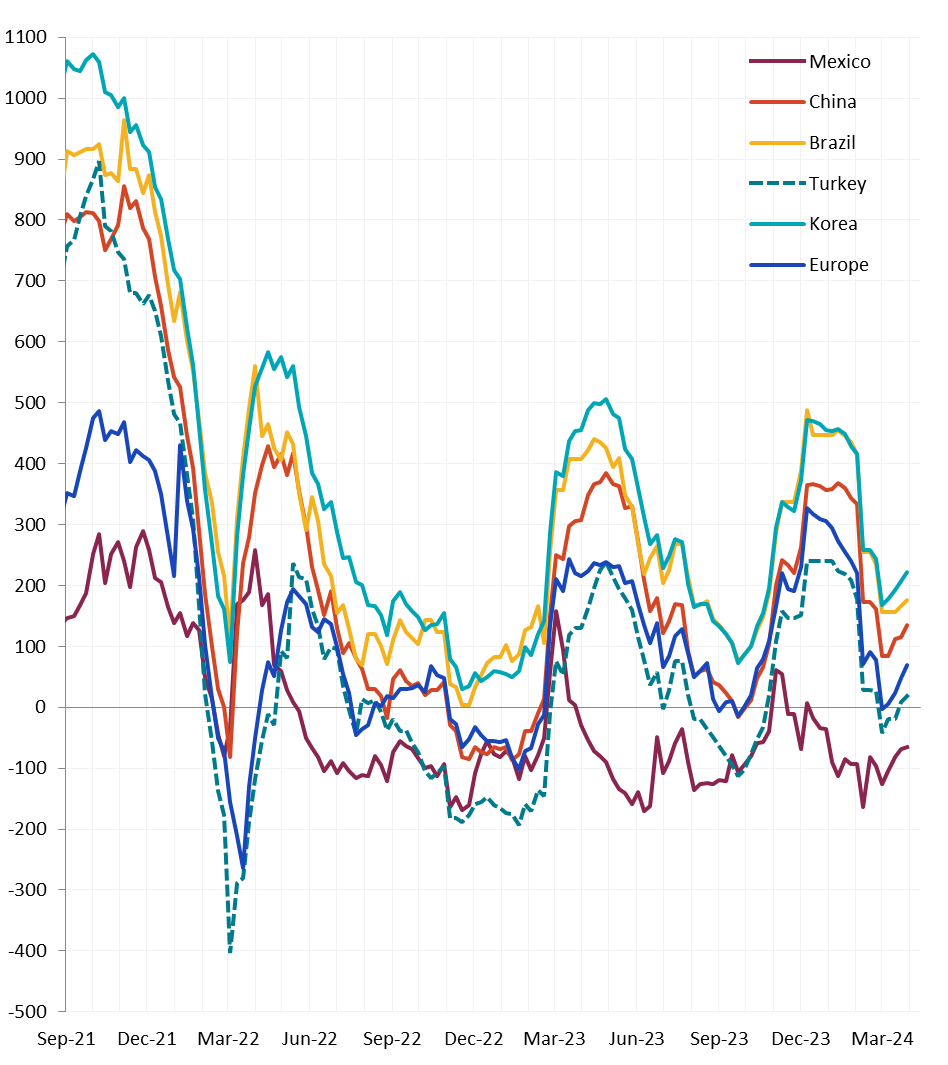
All watched global differentials expanded this week, with China Export HRC and domestic HRC declining by -1.7% and -2.0%, respectively. Another notable decline was the Korean HRC, which fell by -1.3%.
Scrap
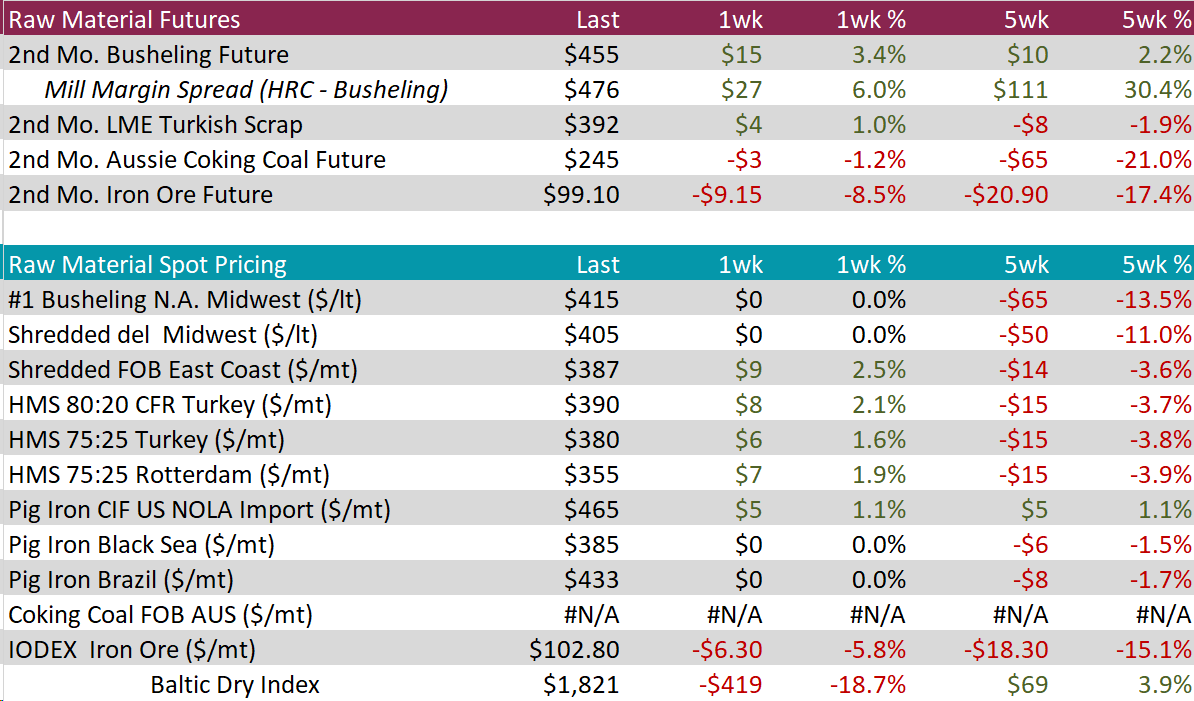
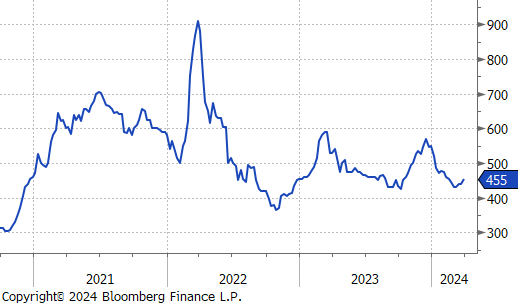
The 2nd month busheling future rose by $15 or 3.4% to $455, continuing its upward trend since reaching recent price low of $430.
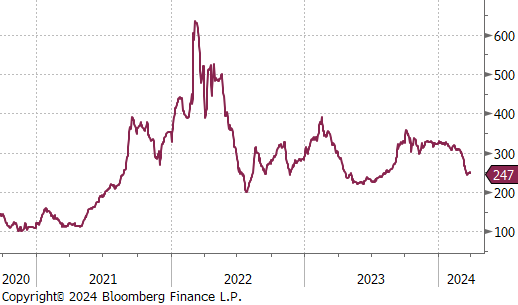
The 2nd month Aussie coking coal future fell by $3 or -1.2% to $245.
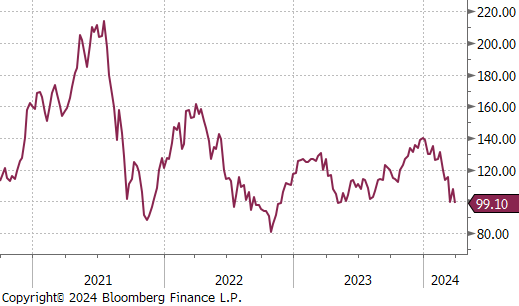
The 2nd month iron ore future dropped by $9.15 or -8.5% to $99.10, falling below the $100 price level for the first time since May 2023.
Dry Bulk / Freight
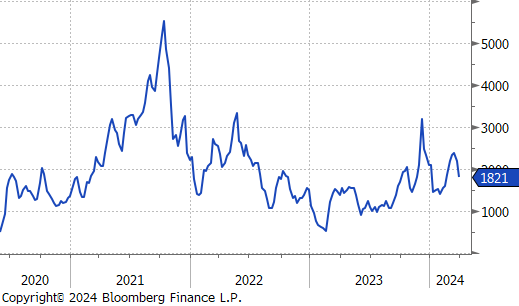
The Baltic Dry Index declined by $419 or -18.7% to $1,821, furthering its downturn since reaching the recent high of $2,350 two-weeks ago.
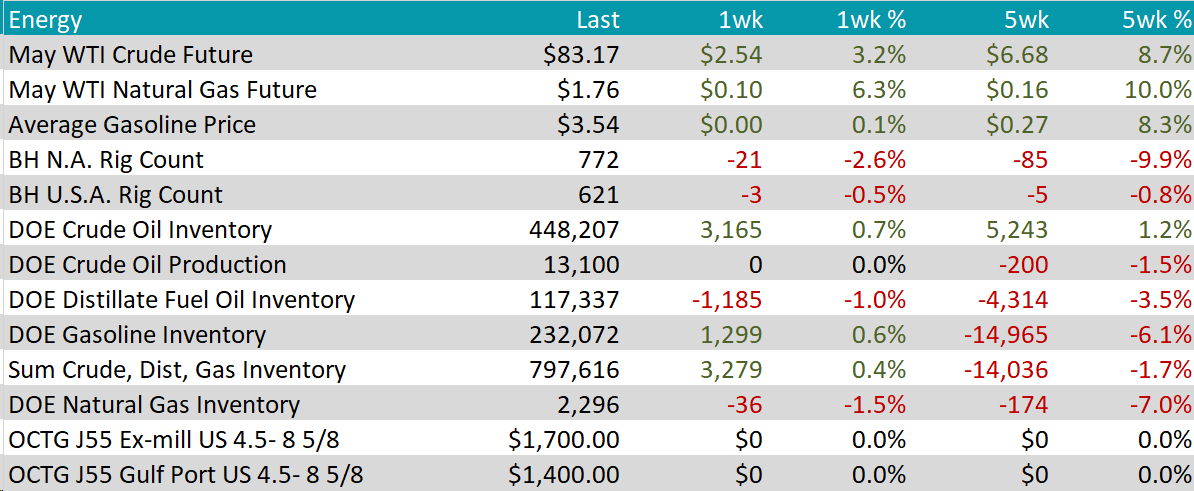
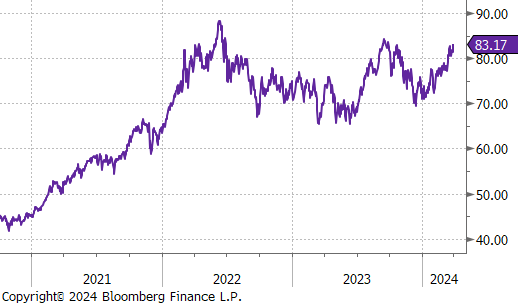
WTI crude oil future gained $2.54 or 3.2% to $83.17/bbl.
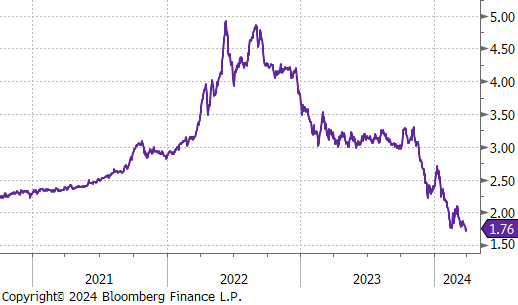
WTI natural gas future gained $0.10 or 6.3% to $1.76/bbl.
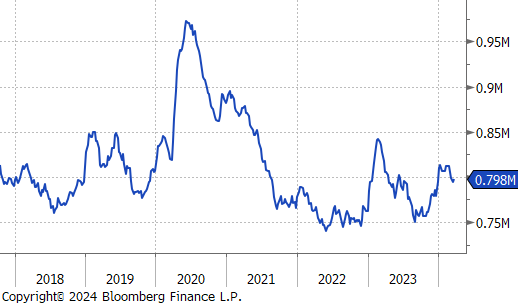
The aggregate inventory level experienced a slight increase of 0.4%.
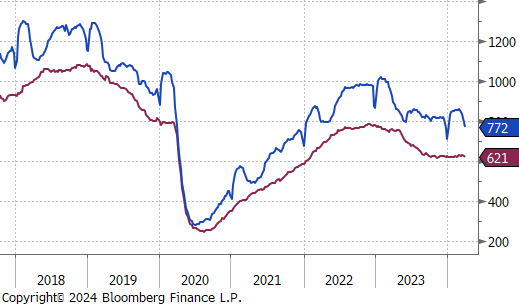
The Baker Hughes North American rig count reduced by 21 rigs, bringing the total count down to 772 rigs. The US rig count also decreased, declining by 3 rigs, bringing the total count down to 621 rigs.
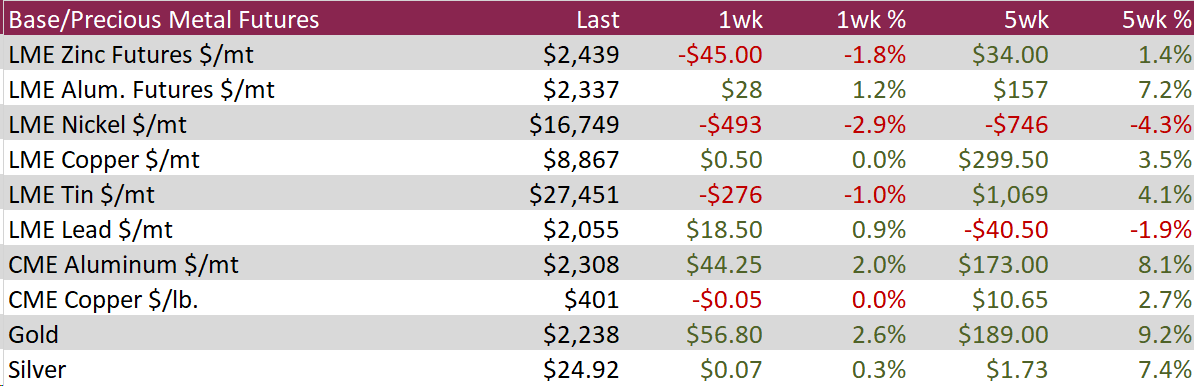
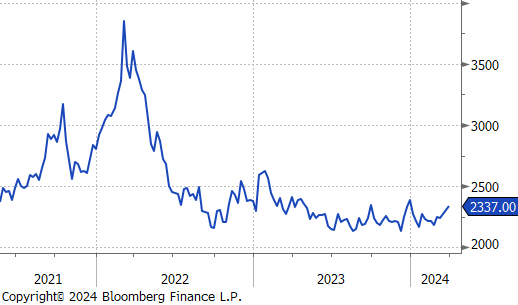
Aluminum rose by $28 or 1.2% to $2,337, driven by encouraging economic indicators from China that alleviated fears of waning demand from the world’s main consumer of base metals. Surprisingly, positive manufacturing PMI figures from China in March indicated a rebound in factory activities, likely a response to Beijing’s economic stimulus and support measures. Moreover, concerns over the supply of aluminum contributed to the price increase. The Aluminum Corp of China highlighted the ongoing uncertainty around the country’s bauxite supply, heavily reliant on Guinea, where recent disruptions have been caused by an explosion at a critical fuel depot. Further supporting prices, aluminum smelters in Yunnan, China’s fourth-largest production region for the metal, faced ongoing output restrictions due to the annual dry season.
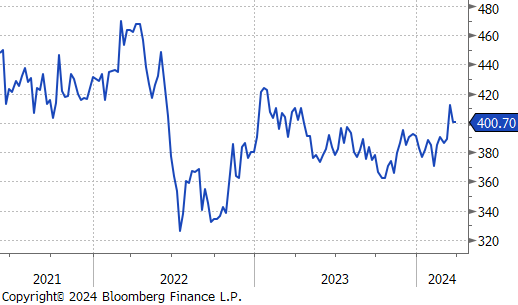
Copper somewhat stabilized, falling slightly by $0.05 or 0.0% to $401, buoyed by unexpectedly strong economic data from China. This development countered the growing fears of diminishing demand. Both the official and Caixin Purchasing Managers’ PMIs in China indicated an uptick in manufacturing activity for March, surpassing predictions and hinting at potential momentum in the sector. This comes after a period where challenges in China’s manufacturing industry dampened the demand for base metals. Furthermore, the prospect of reduced supply supported prices, as Chinese copper smelters considered collective production cuts due to dwindling ore supplies. Despite this, an increase in stocks by 5,000 tonnes to 290.3 thousand tonnes highlighted a continued excess, marking an increase of over 800% since the beginning of the year. Additionally, the Yangshan copper premium is anticipated to close the month significantly lower, reflecting a decreased demand for physical copper among factories.
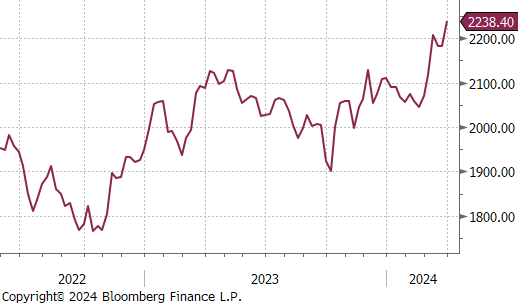
Gold jumped up by $56.80 or 2.6% to $2,238, hitting new highs as weaker-than-anticipated U.S. inflation figures solidified expectations for the Federal Reserve to begin reducing interest rates in June. The inflation data, indicated that the PCE price index, the central bank’s preferred inflation measure, increased by 0.3% in February. This marked a slowdown from the revised 0.4% rise in January, which had aligned with analysts’ predictions. Despite this, Fed Chair Jerome Powell emphasized on Friday that the central bank is not rushing to lower rates, noting that the latest inflation metrics align with the Fed’s objectives. Market sentiment now leans heavily towards a near 70% probability of the Fed initiating rate cuts in June, with expectations set for a total reduction of 75 basis points throughout the year. The anticipation of lower interest rates enhances the attractiveness of gold as an investment, as it lowers the opportunity cost associated with holding the non-yielding asset.
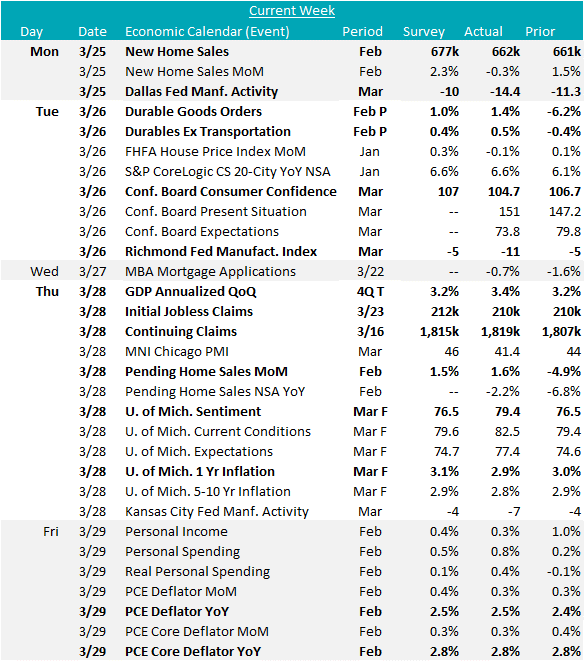
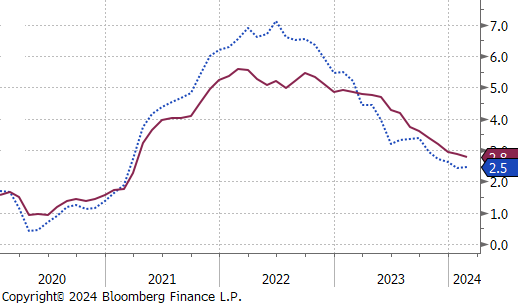
4Q23 GDP revised higher, driven by more robust consumer spending, which appears to remain strong well into the first quarter, with real personal spending from (PCE Report) up 0.4% in February. Looking more closely at that report, the Topline and Core PCE prints came in line with expectations, at 2.5% and 2.8%, respectively. Both continue to trend lower but are above the Fed target. It is important to note that the disinflationary base effect which encouraged markets that prices were under control will start to subside once we have cleared the summer months and will start to be a hurdle in getting PCE to 2%.
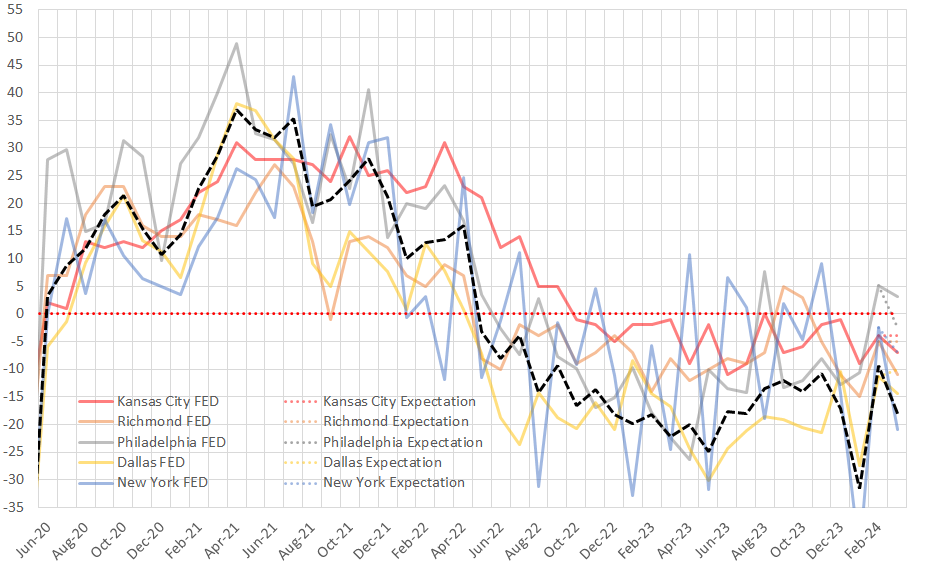
March’s Fed manufacturing surveys disappointed compared to market expectations and showed overall declines across the board. There were signals of a burgeoning recovery in the first two months of the year. This move appears to be a cautionary tale for optimism driven solely by hopes of impending interest rate cuts, when you dig into the commentary.
Housing data was mostly stable this week, after significant upside surprises in last week’s data for the sector. New home sales were only down slightly at 662k, compared to January and slightly below expectations. While pending home sales were up 1.6%, beating expectations of a 1.5% increase.
The Headline University of Michigan Consumer Sentiment Survey printed at its highest level in 32 month, more than 2.5 years at 79.4. The most encouraging signal from the data is that inflation expectations came in below the initial estimate for both the 1-year and longer-term periods.