Flack Capital Markets | Ferrous Financial Insider
March 31, 2023 – Issue #373
March 31, 2023 – Issue #373
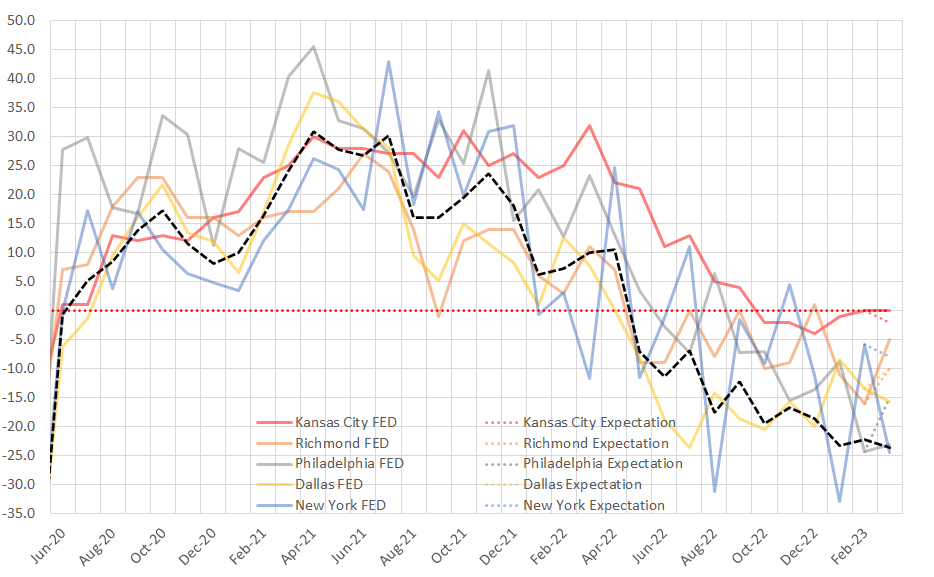
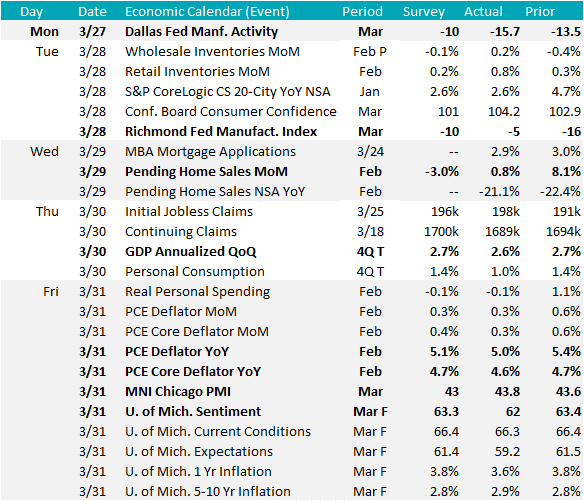
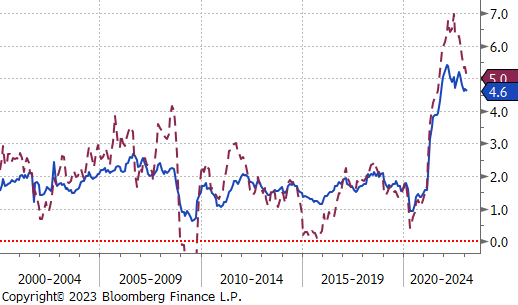
Throughout the month, a variety of Federal Reserve manufacturing surveys are released which provide insight into sector dynamics prior to the ISM Manufacturing Report (released on the first weekday of each month). In the chart on the right, we show each of the five regions and how they printed versus consensus expectations (dotted) and a black dashed line which equally weights the reports based on their respective ranges. This provides a number than can be compared to the ISM. Last week we received the final two prints with Dallas and Richmond published on Monday and Tuesday of last week.
The overall takeaway from the data is that the manufacturing sector continues to contract, with concerns around demand shown in a slowdown of new orders. On top of that, both production and employment readings showed further pullback, as well.
Looking at this data it might be hard to reconcile the recent rally in steel prices. Some may even use this as justification to predict a similar collapse in prices to what was witnessed last year or in 2008. While it is an important risk management skill to keep downside price risk and inventory management front of mind, we view the reluctance to buy necessary material at the end of 2022 as one of the primary drivers for the rally.
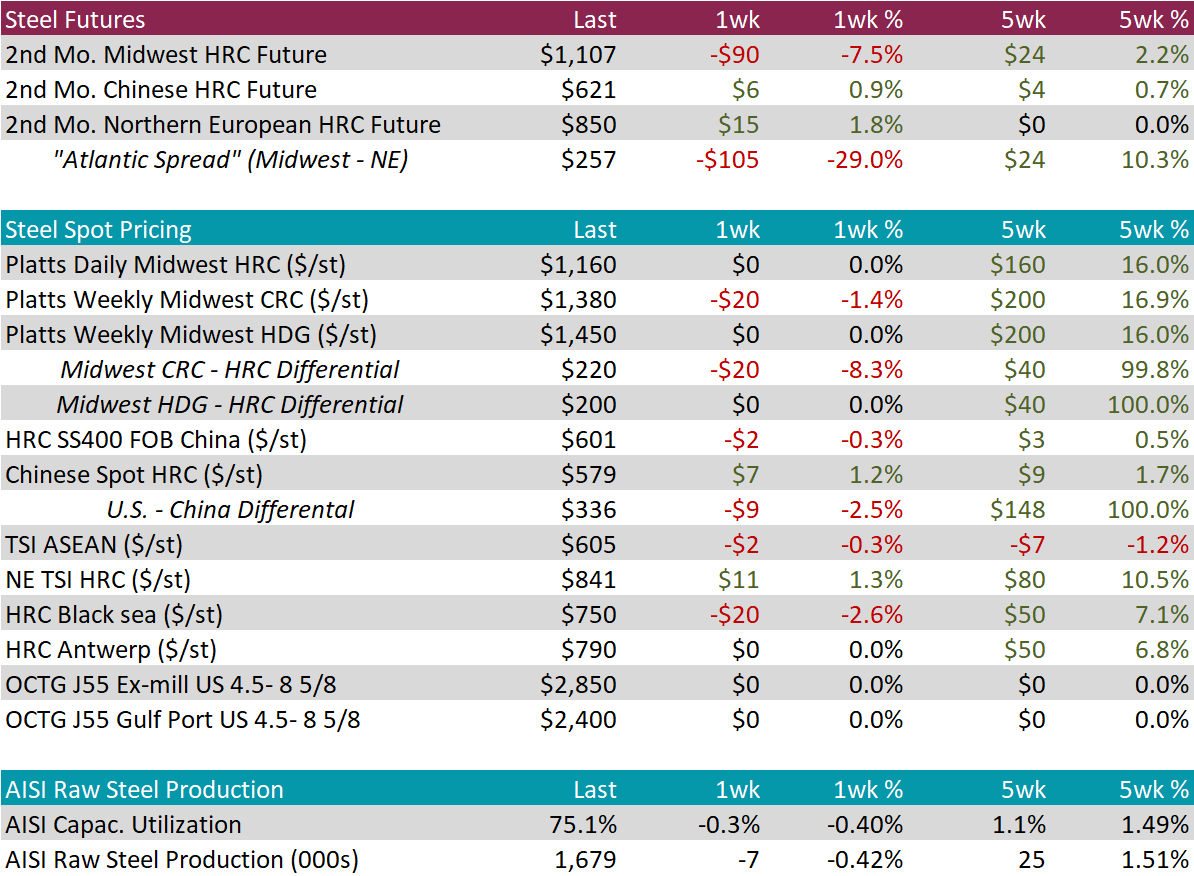
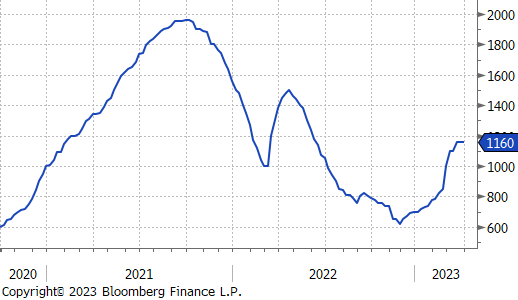
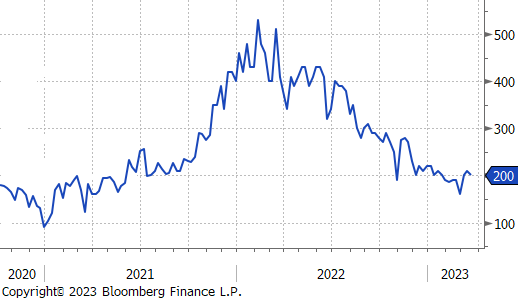
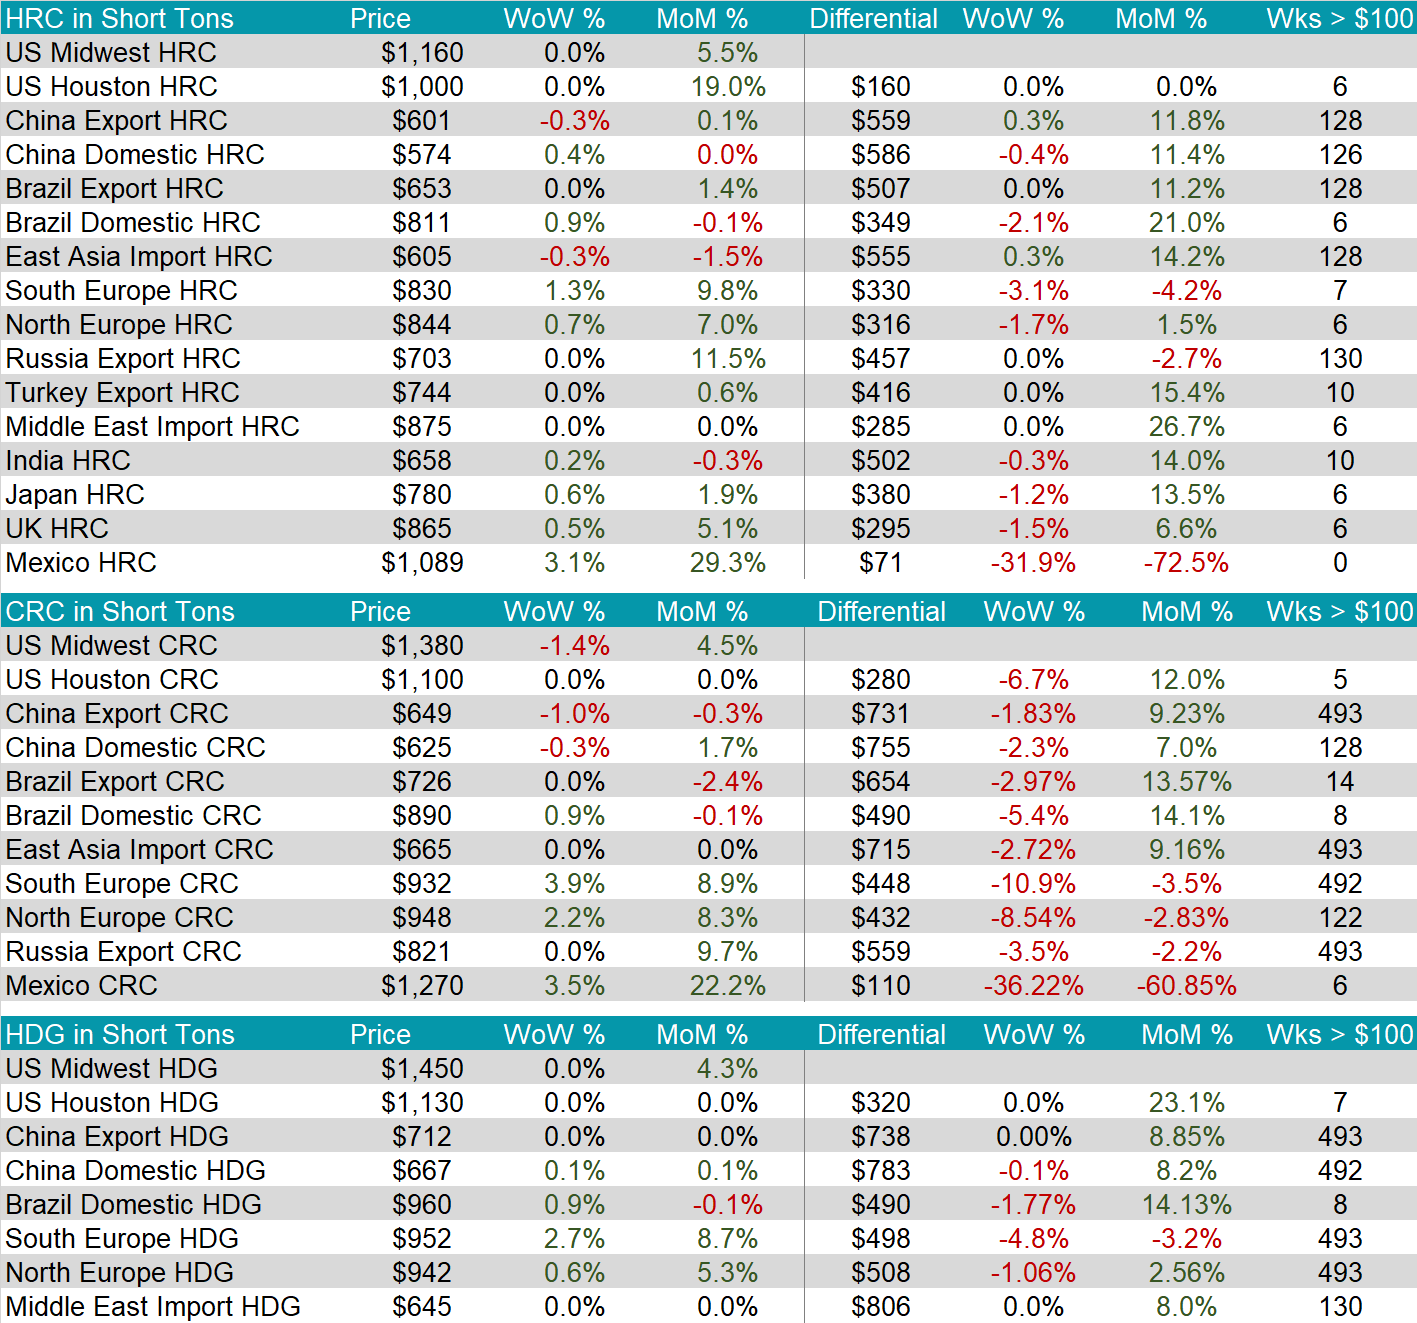
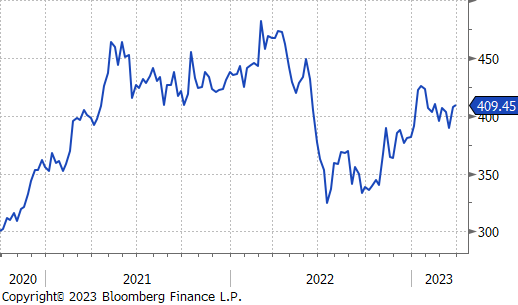
Remember, current import arrivals are near their lowest levels in the last 2 years and mills continue to show restraint in bringing production online. As it stands, price dynamics imply that restrained supply is below these reduced demand levels, with lead times extended well above their historic average. While these dynamics could change, and demand over the longer-term is unclear, “waiting” is again proving to be a poor strategy. The current HRC price is $160 higher than 5 weeks ago
The HRC spot price was unchanged again, last week, while the 2nd month future was down 7.5%. A large part of the sharp move lower for the 2nd month price was the “roll” from April to May.
Tandem products diverged slightly this week, with CRC falling for the first time in 17 weeks, down 1.4%, while HDG was unchanged.
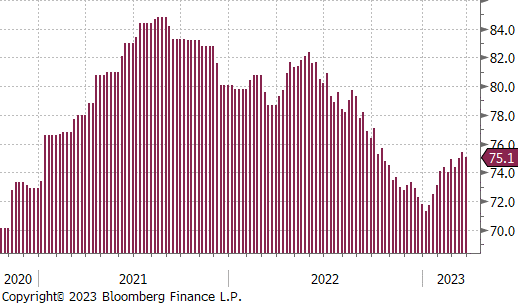
Capacity utilization was lower this week and has clearly lost momentum. This lines up with reports of upcoming seasonal maintenance outages over the coming weeks.
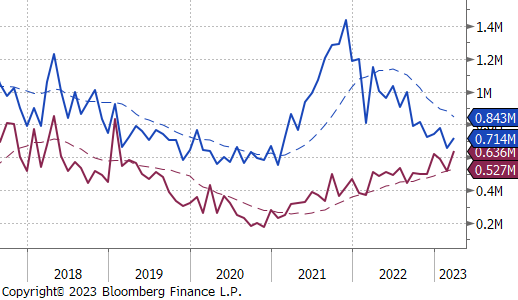
March Projection – Sheet 714k (up 56k MoM); Tube 636k (up 117k MoM)
February Census Data – Sheet 658k (down 119k MoM); Tube 518k (down 69k MoM)
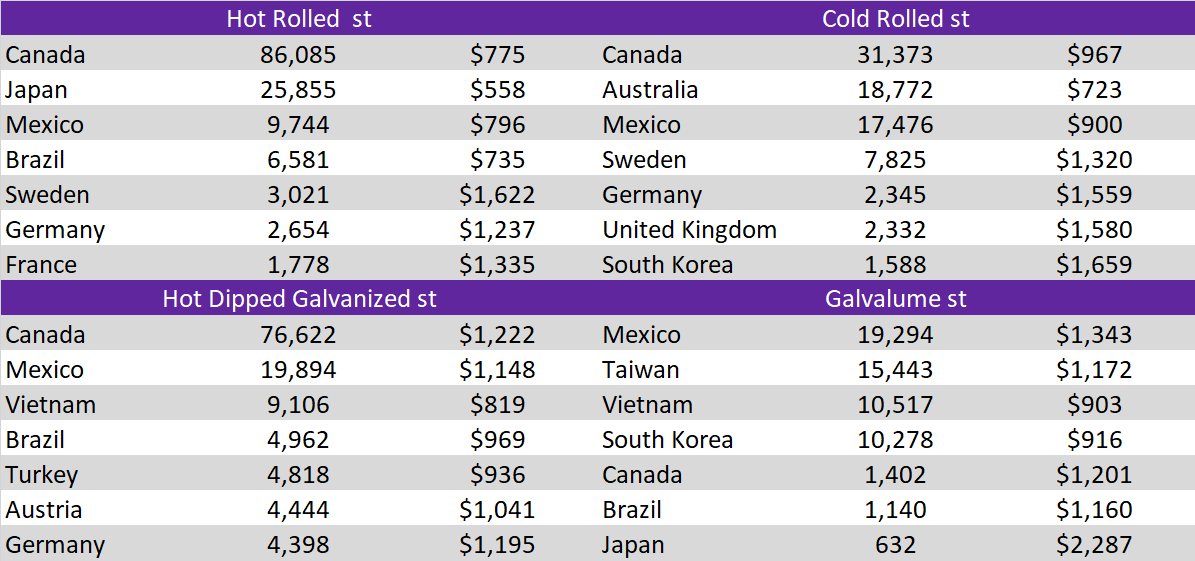
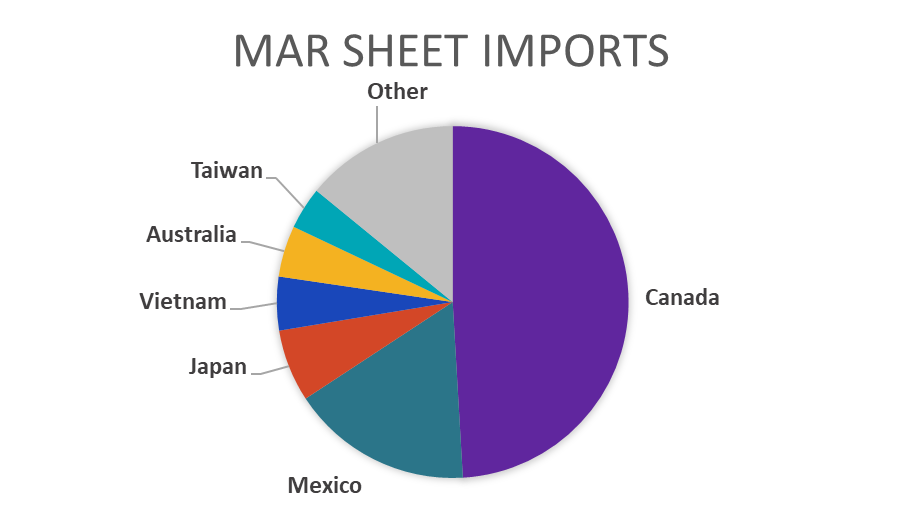
The pace of arrivals dramatically slowed in the second half of March; however, we still anticipate a modest uptick in the sheet imports compared to February levels.
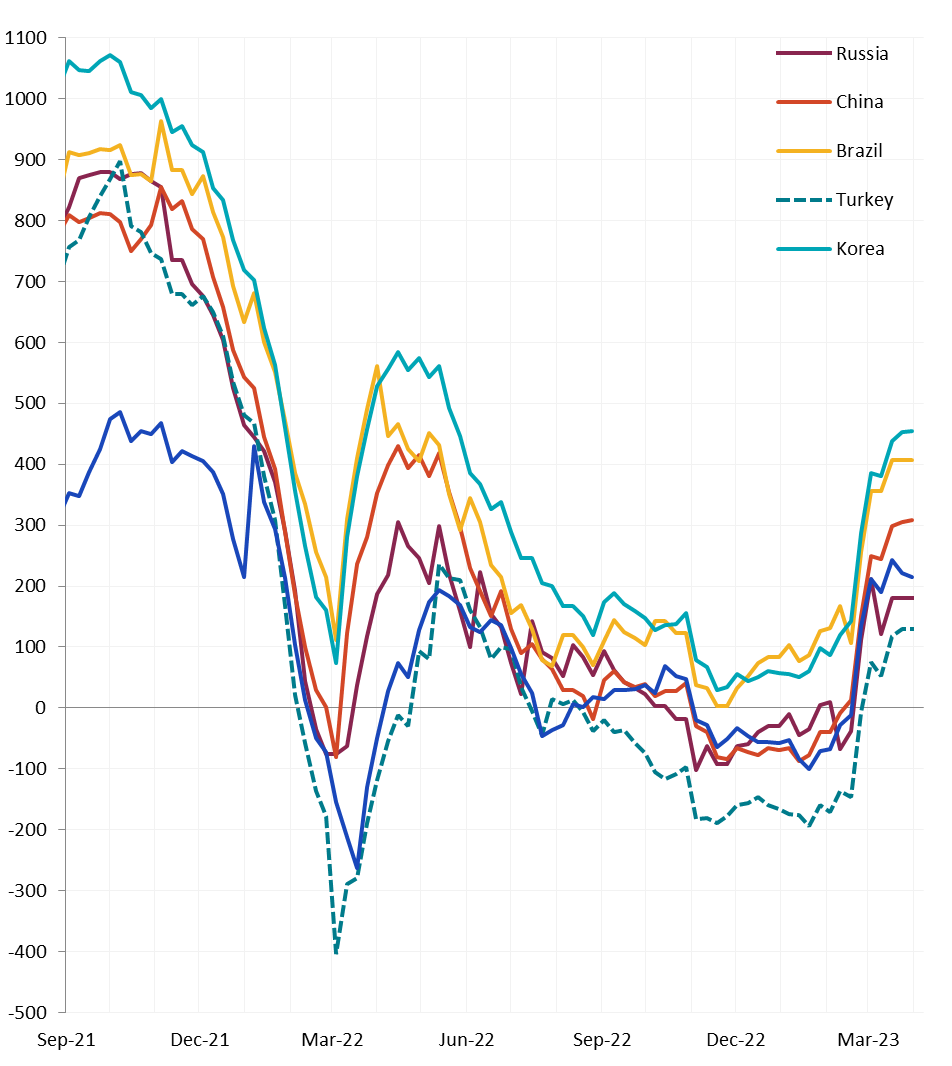
Differentials increased again for China and Korea with their respective prices both moving lower for the 2nd week in a row. The rest of the world saw pricing slat to slightly higher.
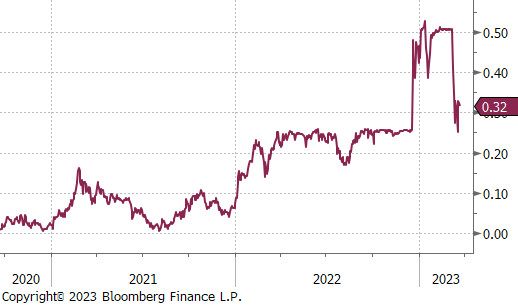
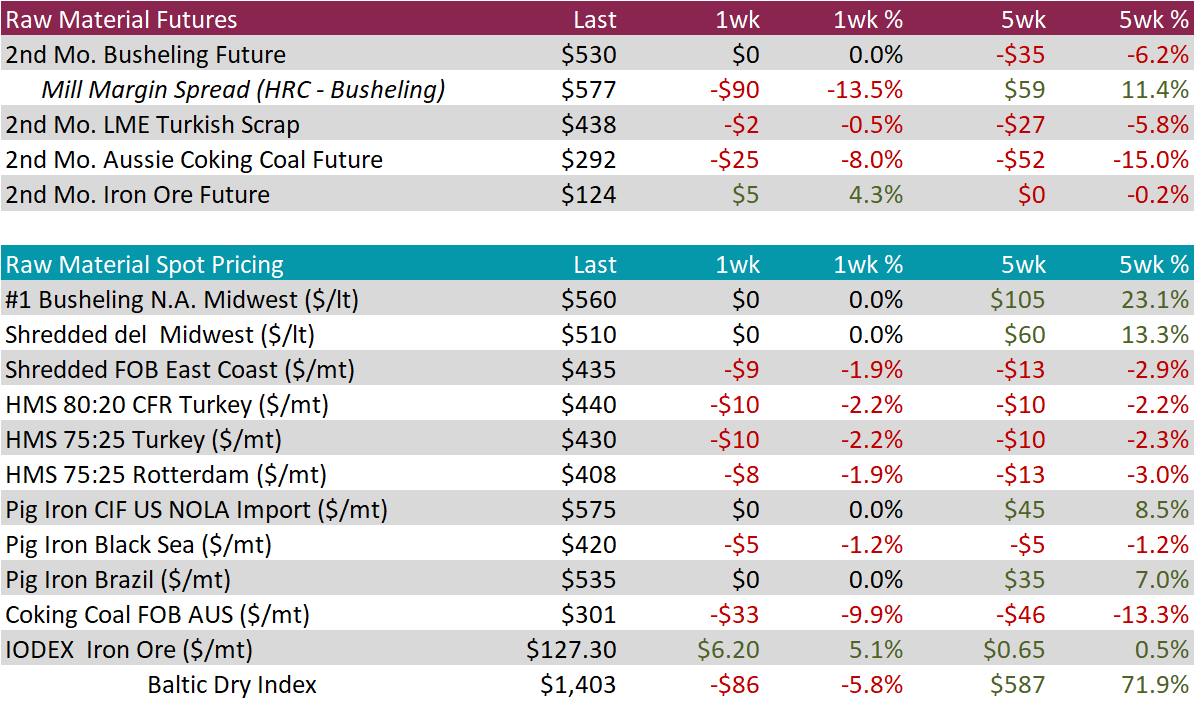
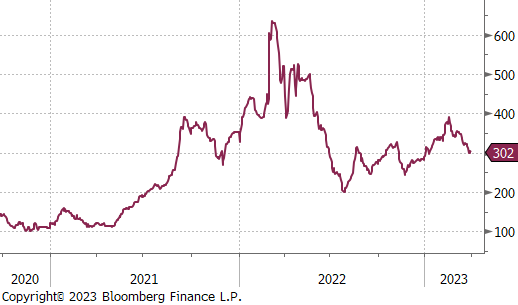
It was another quiet week in the U.S. domestic scrap market while the 2nd month futures for Aussie coking coal down 8%. This was a continuation of the longer-term trend, with the price now down 15%, over the last 5-weeks.
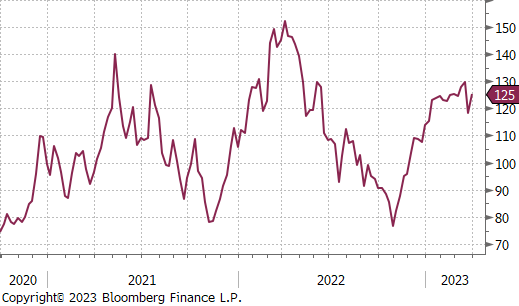
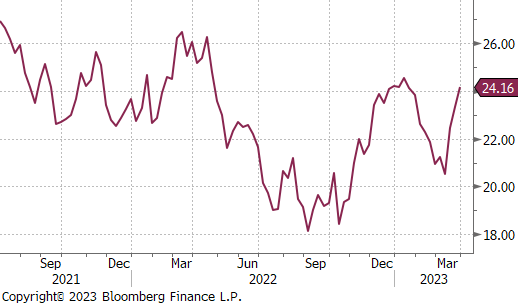
The 2nd month Iron ore future was up 4.3% after briefly trading below its trading range of $120-130, last week.
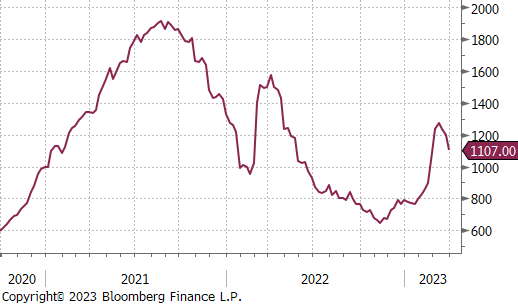
The Baltic dry index was down another 5.8% this week. The current level remains 71.9% higher than the price from 5-weeks ago.
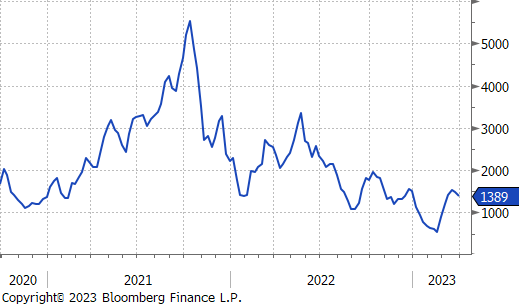
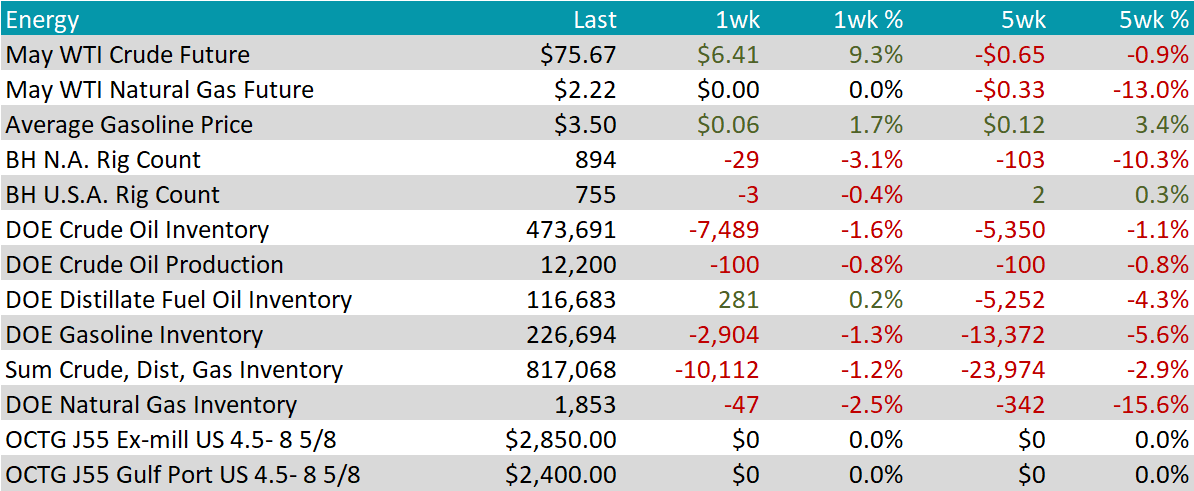
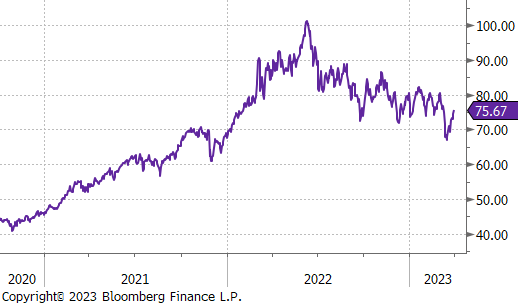
WTI crude oil future gained another $6.41 or 9.3%, up to $75.67/bbl.
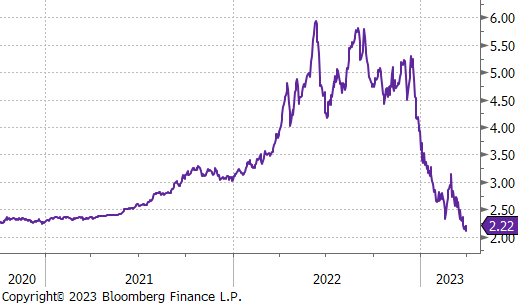
WTI natural gas future was unchanged at $2.22/bbl.
The aggregate inventory level fell further, down another 1.2% last week.
The Baker Hughes North American rig count was down another 29 rigs, and the U.S. rig count was down 3 rigs, after 3 weeks of an increasing count.
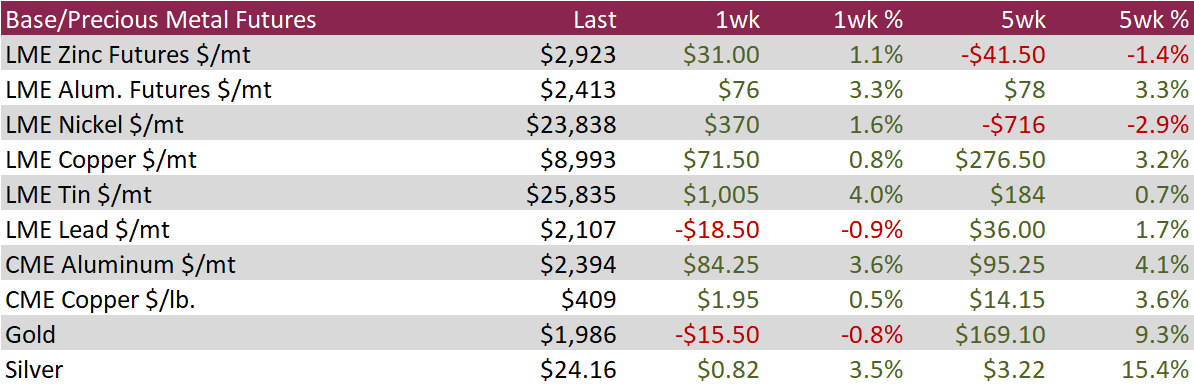
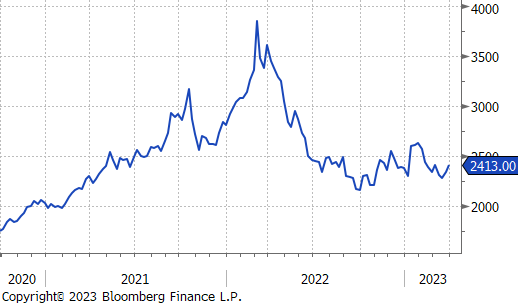
Aluminum futures rose 3.3% during the week to cap its largest weekly advance since mid-January and extending gains for the second straight week. The metal edged higher on the back of strong manufacturing data out of China and a weaker dollar, despite ongoing fears of the banking crisis.
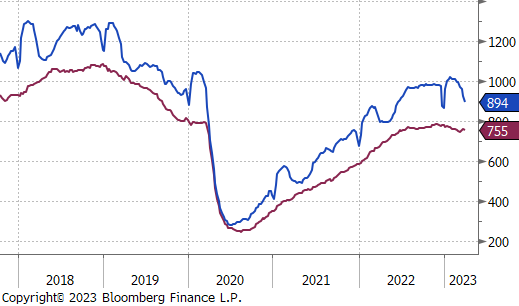
Copper inched higher during the week, taking a cue from the rally in stock markets and other risk assets. The red metal has been weighed down by recession fears, stronger dollar, China’s ZCP, and the banking crisis. Inventories on-exchange remain low and are providing some optimism for prices if headwinds to growth ease and if demand out of China rebounds.
Silver futures performed strongly for a third consecutive week, extending the 5-week performance to +15.4%. Silver has seen buyers emerge as the US economy appears to be cooling and market participants begin pricing in more leeway for the Fed to pause rate hikes in May. Shifts in rate expectations have triggered declines in treasury yields, which has boosted silvers allure.
The Fed’s preferred measure of inflation data was released this week and came in just below expectations for both Topline PCE and Core (ex-food and energy) PCE. Compared to recent month’s, there was little fanfare as the data came right in line with expectations. That said, this month’s print was another reminder that higher prices have been stickier than anticipated. In response, the Fed has consistently noted that they will hold the terminal rate at an elevated level until they are confident that inflation is moving back to 2%.
The University of Michigan Consumer Sentiment Survey is one of the first data releases to encapsulate changes in sentiment following the collapse of SVB with ~40% of the respondents submitting their response after March 10th. Even with that being the case, the primary reported concern continues to be high price inflation. Current conditions came in slightly below their preliminary reading while expectations were more significantly impacted to the downside.
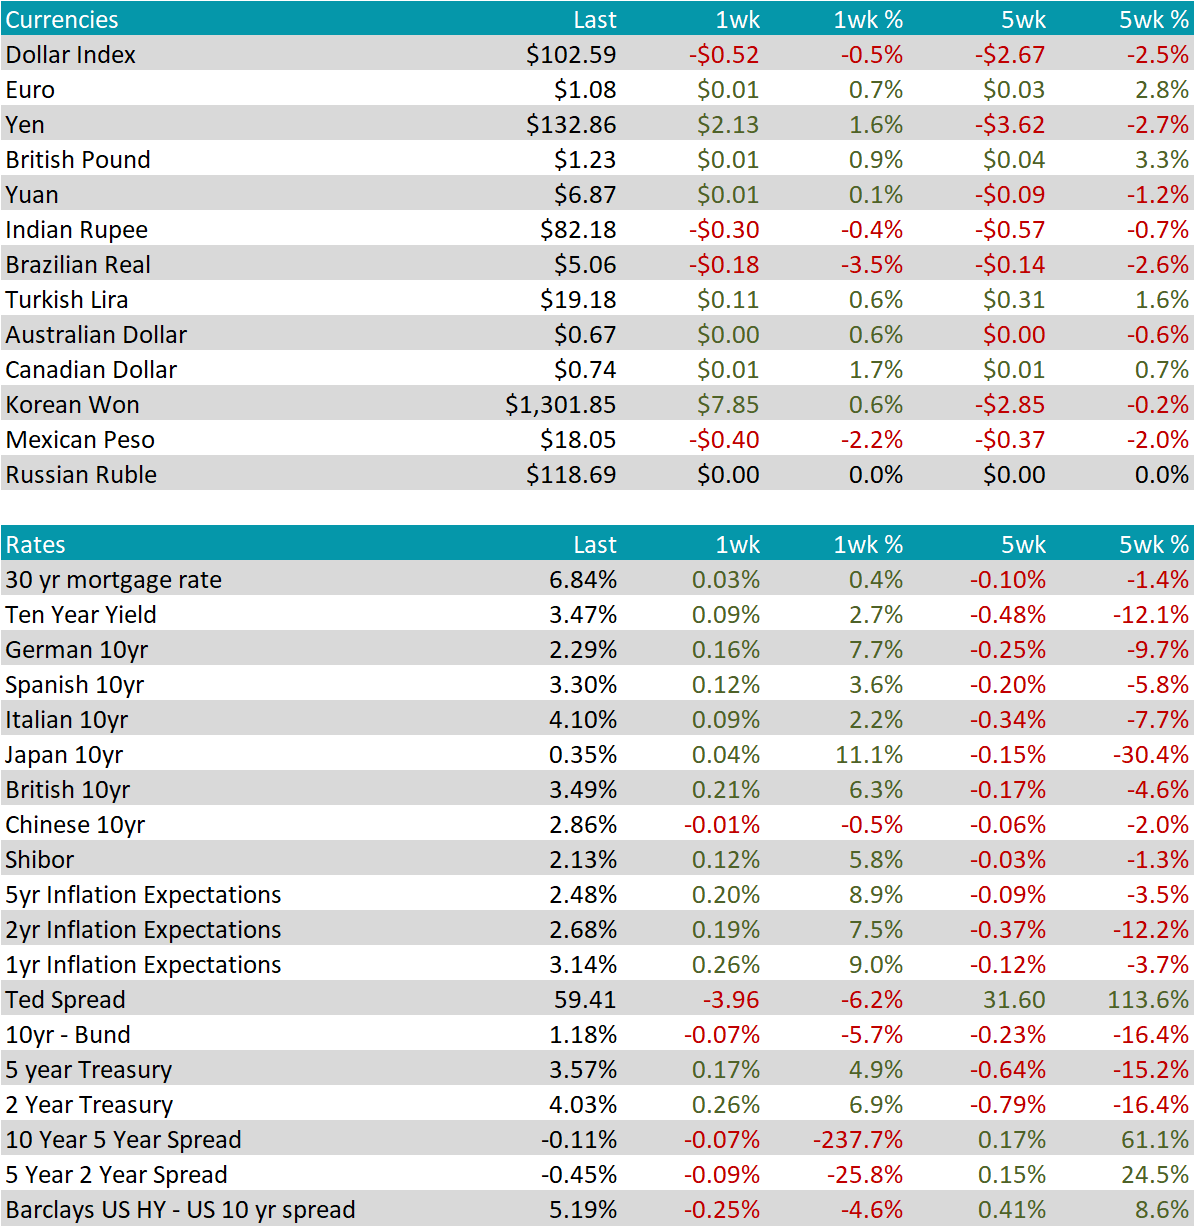
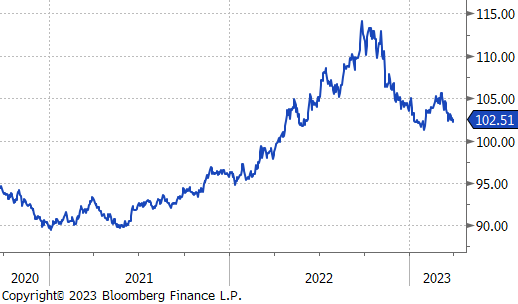
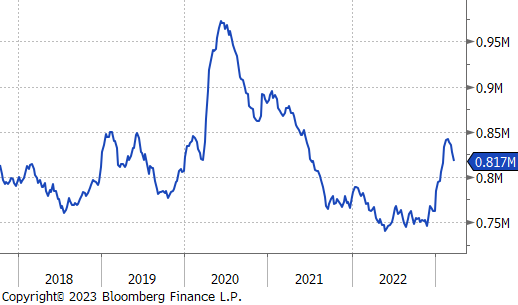
U.S. Dollar was down another $0.52 last week, closing at $102.59. The Japanese Yen depreciated this week and came off its strongest level after a 3-week rally.
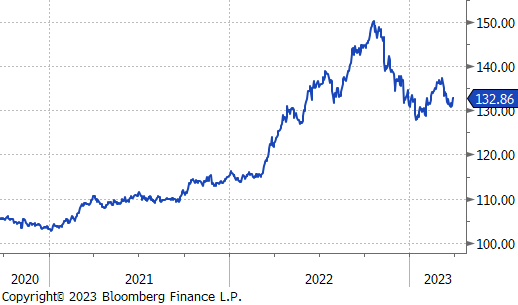
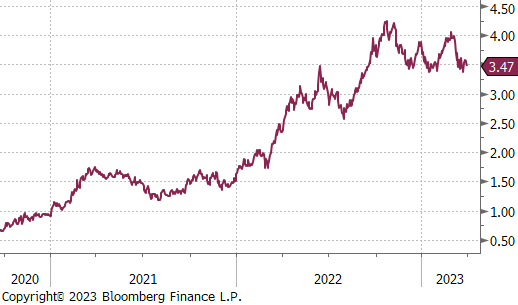
U.S. 10yr treasury yield was up 9 bps and the rest of the major countries ex-China all saw higher yields as well. The Japanese 10yr yield saw the most significant base effect increase, up 11.1% on the week.