Flack Capital Markets | Ferrous Financial Insider
March 8, 2024 – Issue #422
March 8, 2024 – Issue #422
Overview:
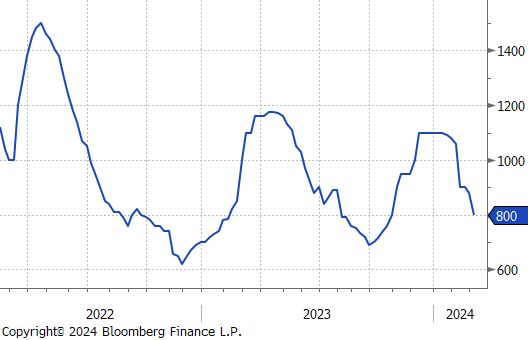
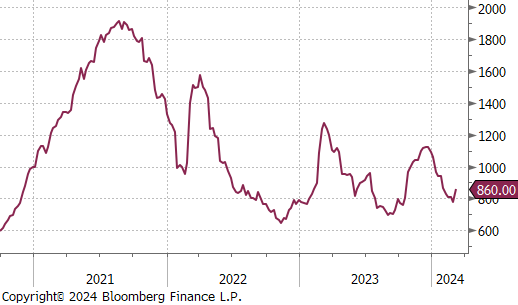
The HRC spot price remained unchanged at $800. At the same time, the 2nd month future rose by $80 or 10.3% to $860, marking a significant rebound.
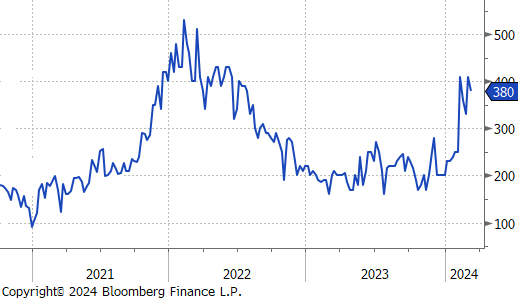
Tandem products both fell by $30, resulting in the HDG – HRC differential to also fall by $30 or -7.3% to $380.
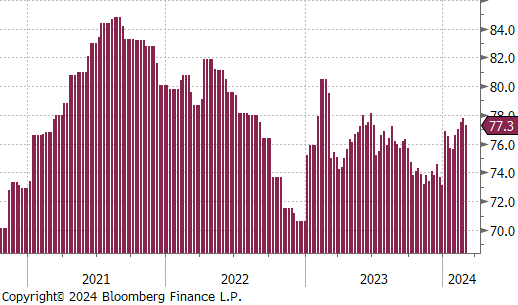
Mill production experienced a slight pull back, with capacity utilization ticking down by 0.5% to 77.3%, bringing raw steel production down t0 1,716m net tons.


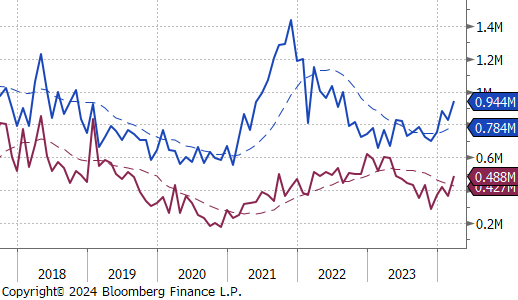
March Projection – Sheet 944k (up 115k MoM); Tube 488k (up 122k MoM)
February Projection – Sheet 829k (down 53k MoM); Tube 366k (down 54k MoM)
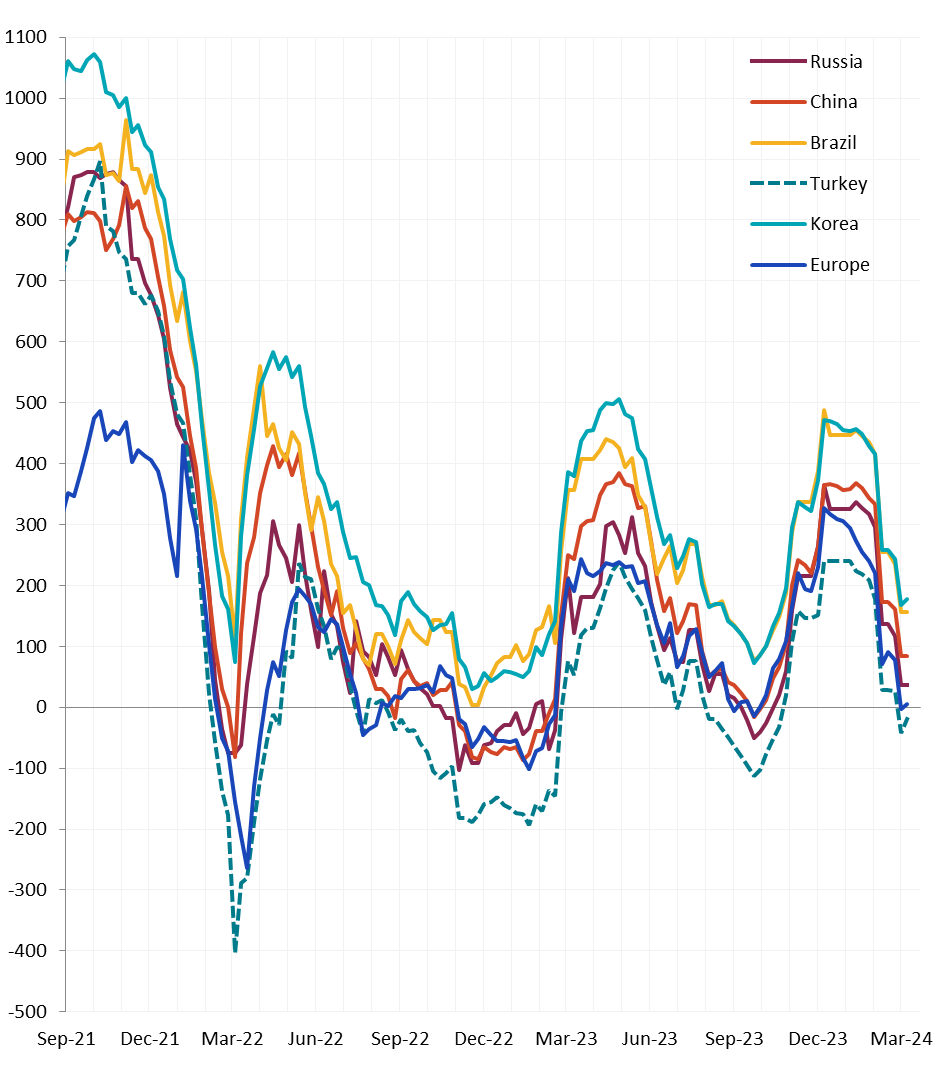
Watched global differentials all either increased or remained the same, with Turkey declining by -3.1% and Korea’s Import HRC seeing a -1.9% decrease.

Scrap
The 2nd month busheling future remained unchanged at $430. Meanwhile, the spot price fell by $65 or -13.5% to $415, hitting its lowest price since October 2023.
The 2nd month Aussie coking coal future declined by $11 or -3.7% to $287, falling further from the $300 price level.
The 2nd month iron ore future slightly rose by $0.05 or 0.0% to $114.25, resulting in the five-week price change to be down by $12.65 or -10.0%.
Dry Bulk / Freight
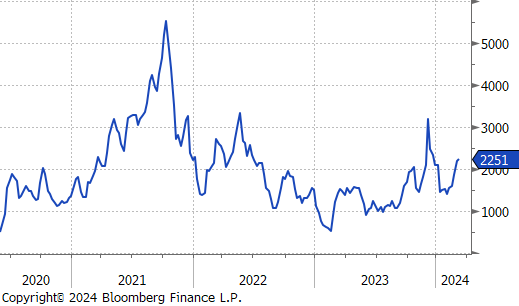
The Baltic Dry Index went up by $140 or 6.6% to $2,251, marking the fifth consecutive week of increases as the price continued to rebound.


WTI crude oil future lost $1.96 or -2.5% to $78.01/bbl.
WTI natural gas future lost $0.03 or -1.6% to $1.81/bbl.
The aggregate inventory level saw a slight decline of -0.9%
The Baker Hughes North American rig count dropped by 13 rigs, bringing the total count to 847 rigs. At the same time, the US count reduced by 7 rigs, bringing the total to 622 rigs.


Aluminum fell by $5 or -0.2% to $2,240, as concerns over a possible EU ban on Russian aluminum loom. While the EU didn’t introduce new aluminum sanctions on the anniversary of Ukraine’s invasion, insiders suggest more import restrictions may be imminent. Such measures could lead to a significant 500,000-ton deficit in Europe’s aluminum supply, putting pressure on Middle Eastern suppliers to quickly fill the gap. In 2023, these suppliers, which accounted for 9% of the world’s aluminum, sent around 2 million metric tons to Europe. This comes as EU’s aluminum imports from Russia have fallen to 8% of its total, down from 12% in 2022 and 19% in 2018. A broader ban covering primary aluminum products could severely disrupt Europe’s supply chain, affecting everything from market premiums and the carbon footprint to the competitiveness of downstream industries. Furthermore, the situation is complicated by increasing shipping costs from the Middle East and Asia, partly due to attacks in the Red Sea.
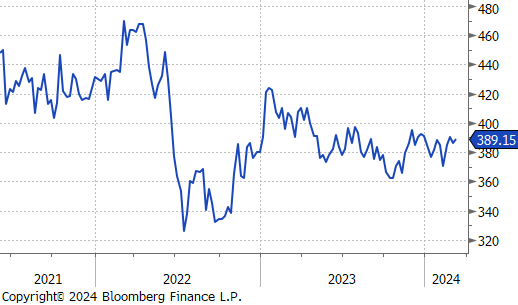
Copper rose by $3 or 0.8% to $389, buoyed by dwindling global inventories and supply chain issues. Since December, mining disruptions have led to a further decrease in stocks, negatively affecting the profits of Chinese smelters and possibly leading to a reduction in their output. The London Metal Exchange (LME) reports copper stock levels are at their lowest since August. Notably, Codelco, the world’s largest copper producer, saw its production drop nearly 16% in January compared to the previous year, although other producers in the same region reported increases. On the demand front, China recorded a 2.6% growth in unwrought copper imports and a 0.6% rise in copper concentrate imports during the first two months of 2024, hitting a new record for this period. Despite a cooling property market in China, the electric vehicle and renewable energy sectors are expected to sustain strong copper demand.
Silver held steady at $24.55, slightly rising by $1.19 or 5.1%, nearing highs not seen in over two months, buoyed by a weaker dollar and lower yields. This comes as the latest U.S. job data offers the Federal Reserve some flexibility to consider reducing interest rates within the year. Despite February’s nonfarm payrolls exceeding expectations, there were significant downward adjustments for January and December. Moreover, the unemployment rate reached its highest in two years, and wage growth decelerated more than anticipated. Fed Chair Powell previously suggested that the commencement of monetary easing could be approaching, contingent upon further signs of inflation moving back towards the 2% goal. Throughout the week, silver was on track to achieve a gain of over 5%.


February Nonfarm Payrolls meaningfully beat expectations, up 275k versus the expected increase of 200k. Manufacturing payrolls were down 4k versus an expected 7k increase. Much of the deeper conversation around today’s jobs report centers around the fact that the gangbusters job’s report from January was revised lower, from 353k jobs added, to 229k. For some, this is a signal that the labor market is not as strong as it appeared, however, even after the revision, January payrolls would have beat the initial estimate by nearly 50k jobs.
Job Openings remained high in January as well, with data coming in at 8,863k openings, above the expected 8,850k. The openings/unemployed worker ratio increased slightly to 1.44, from 1.42.
The Unemployment Rate rose to 3.9% and is at its “highest” level since January 2022. Taking a step back, the current level remains historically lower but is overall trending in a similar direction to jobless claims. Continuing claims came in slightly above expectations of 1,880k to 1,906k, while initial claims remain recently subdued around the 200-220k level since early September. For initial claims, this range is well below the threshold which would start to cause concern – that would trigger if the 4-week moving average pushed above 260k.
As mentioned in this week’s flash report, January Durable Goods New Orders came in below expectations down 6.2% versus the preliminary data which pointed to a 6.1% decline. Although the ex. Transportation data also disappointed, (down -0.4% versus -0.3%) we view the impressive rebound in February auto sales as a clear indication that durables improved off low January levels.


