Flack Capital Markets | Ferrous Financial Insider
May 3, 2024 – Issue #430
May 3, 2024 – Issue #430
Overview:
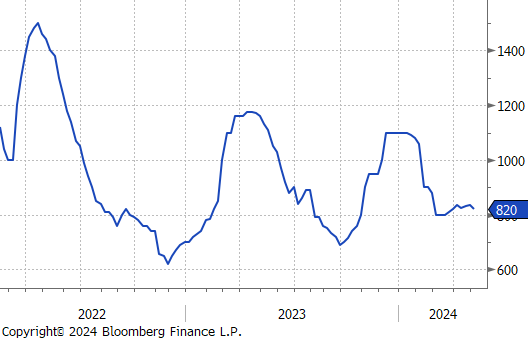
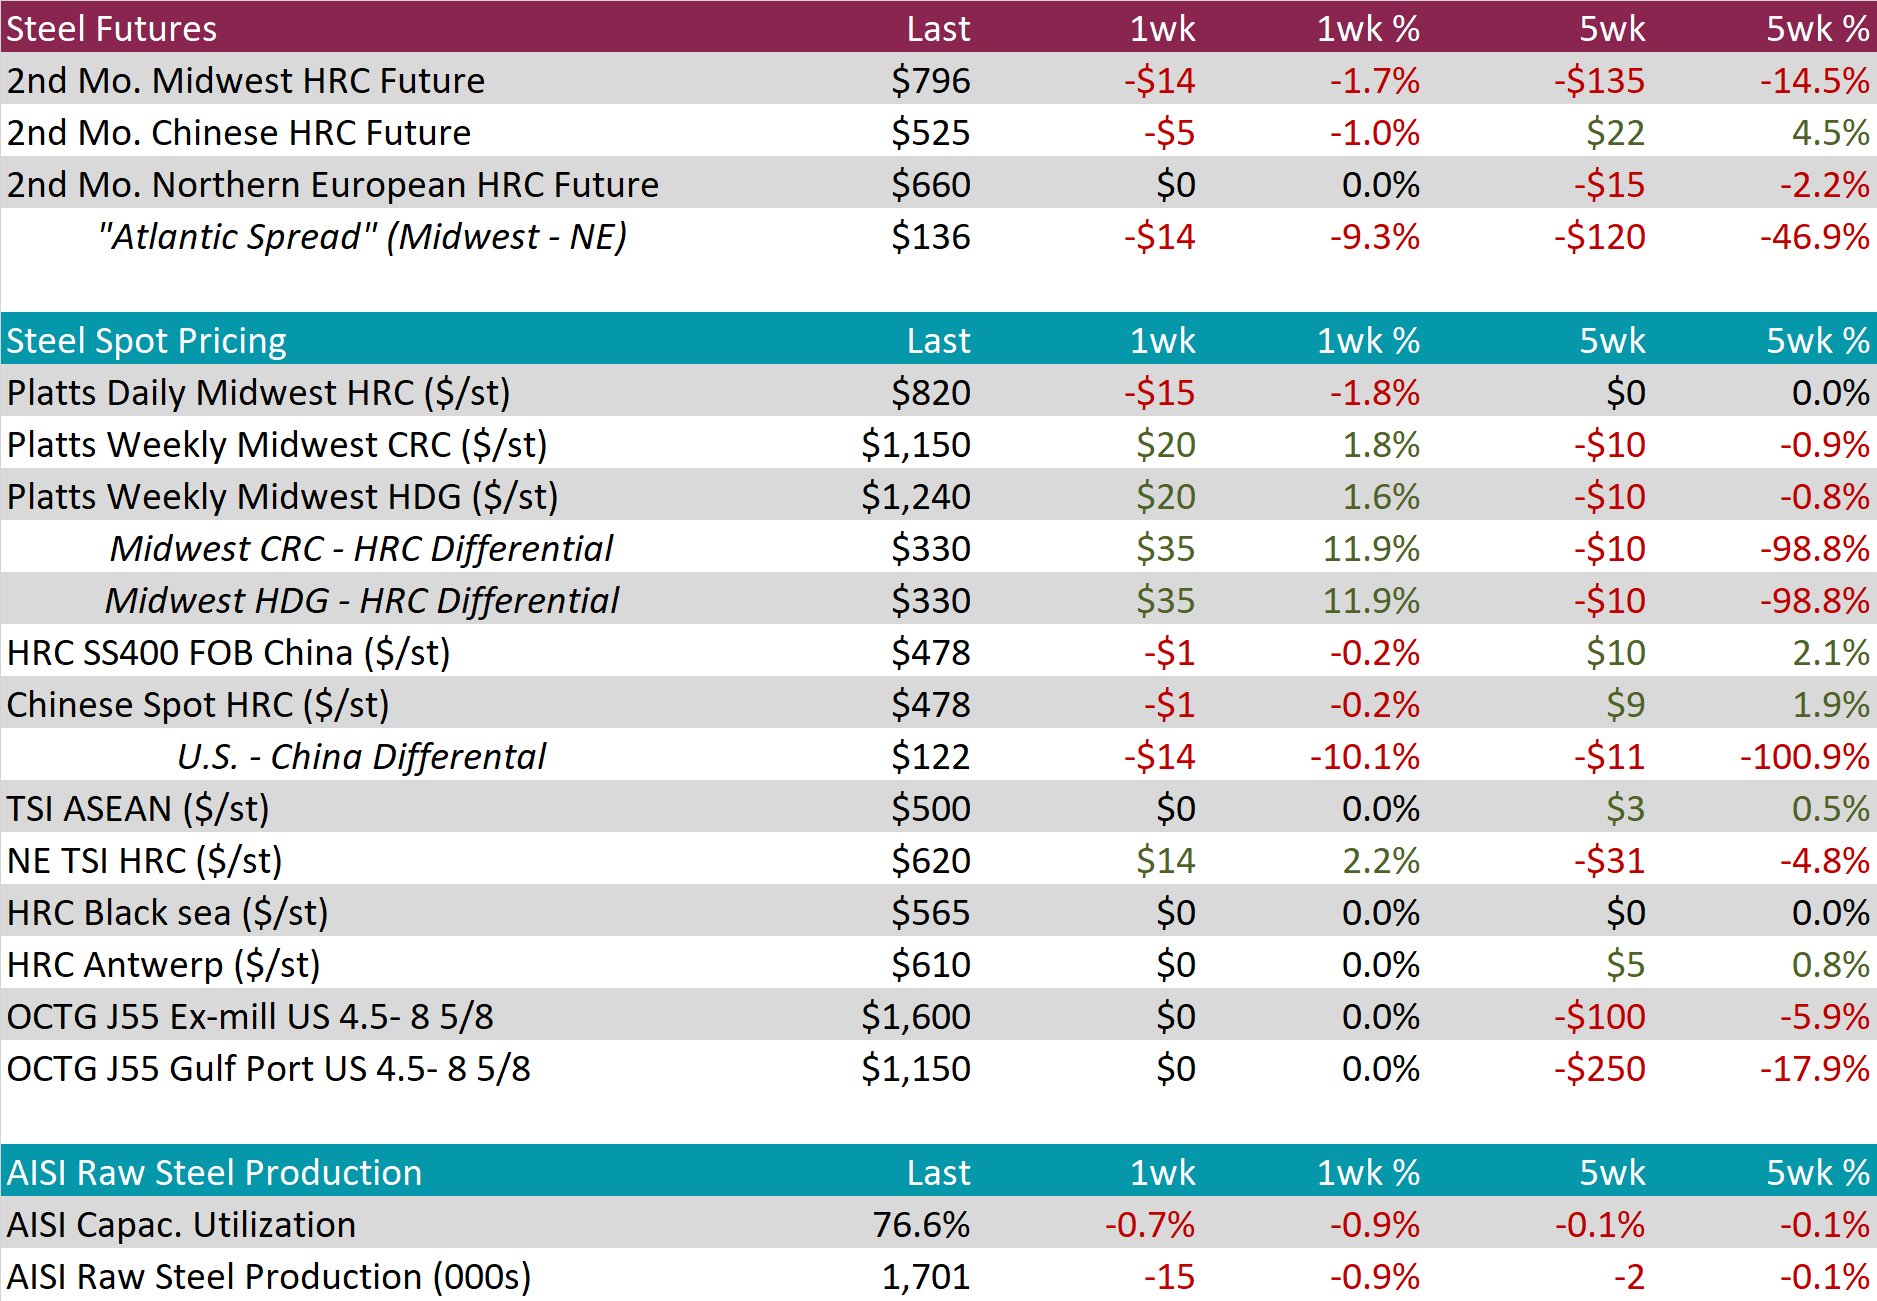
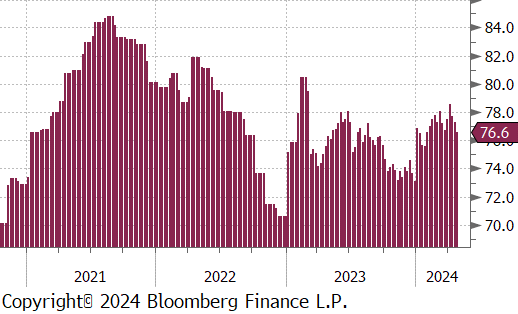
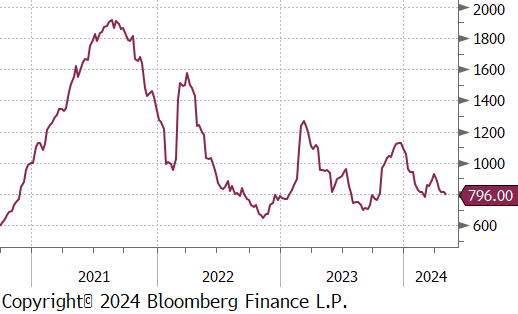
The HRC spot price fell by $15 or -1.8% to $820, reaching the lowest price in five-weeks. Meanwhile, the 2nd month future declined by $14 or -1.7% to $796, marking a total price decrease of $135 since its recent downward trend began five-weeks ago.
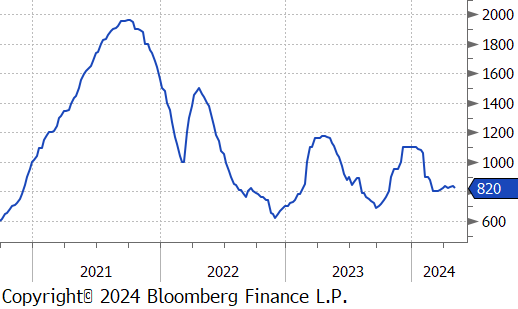
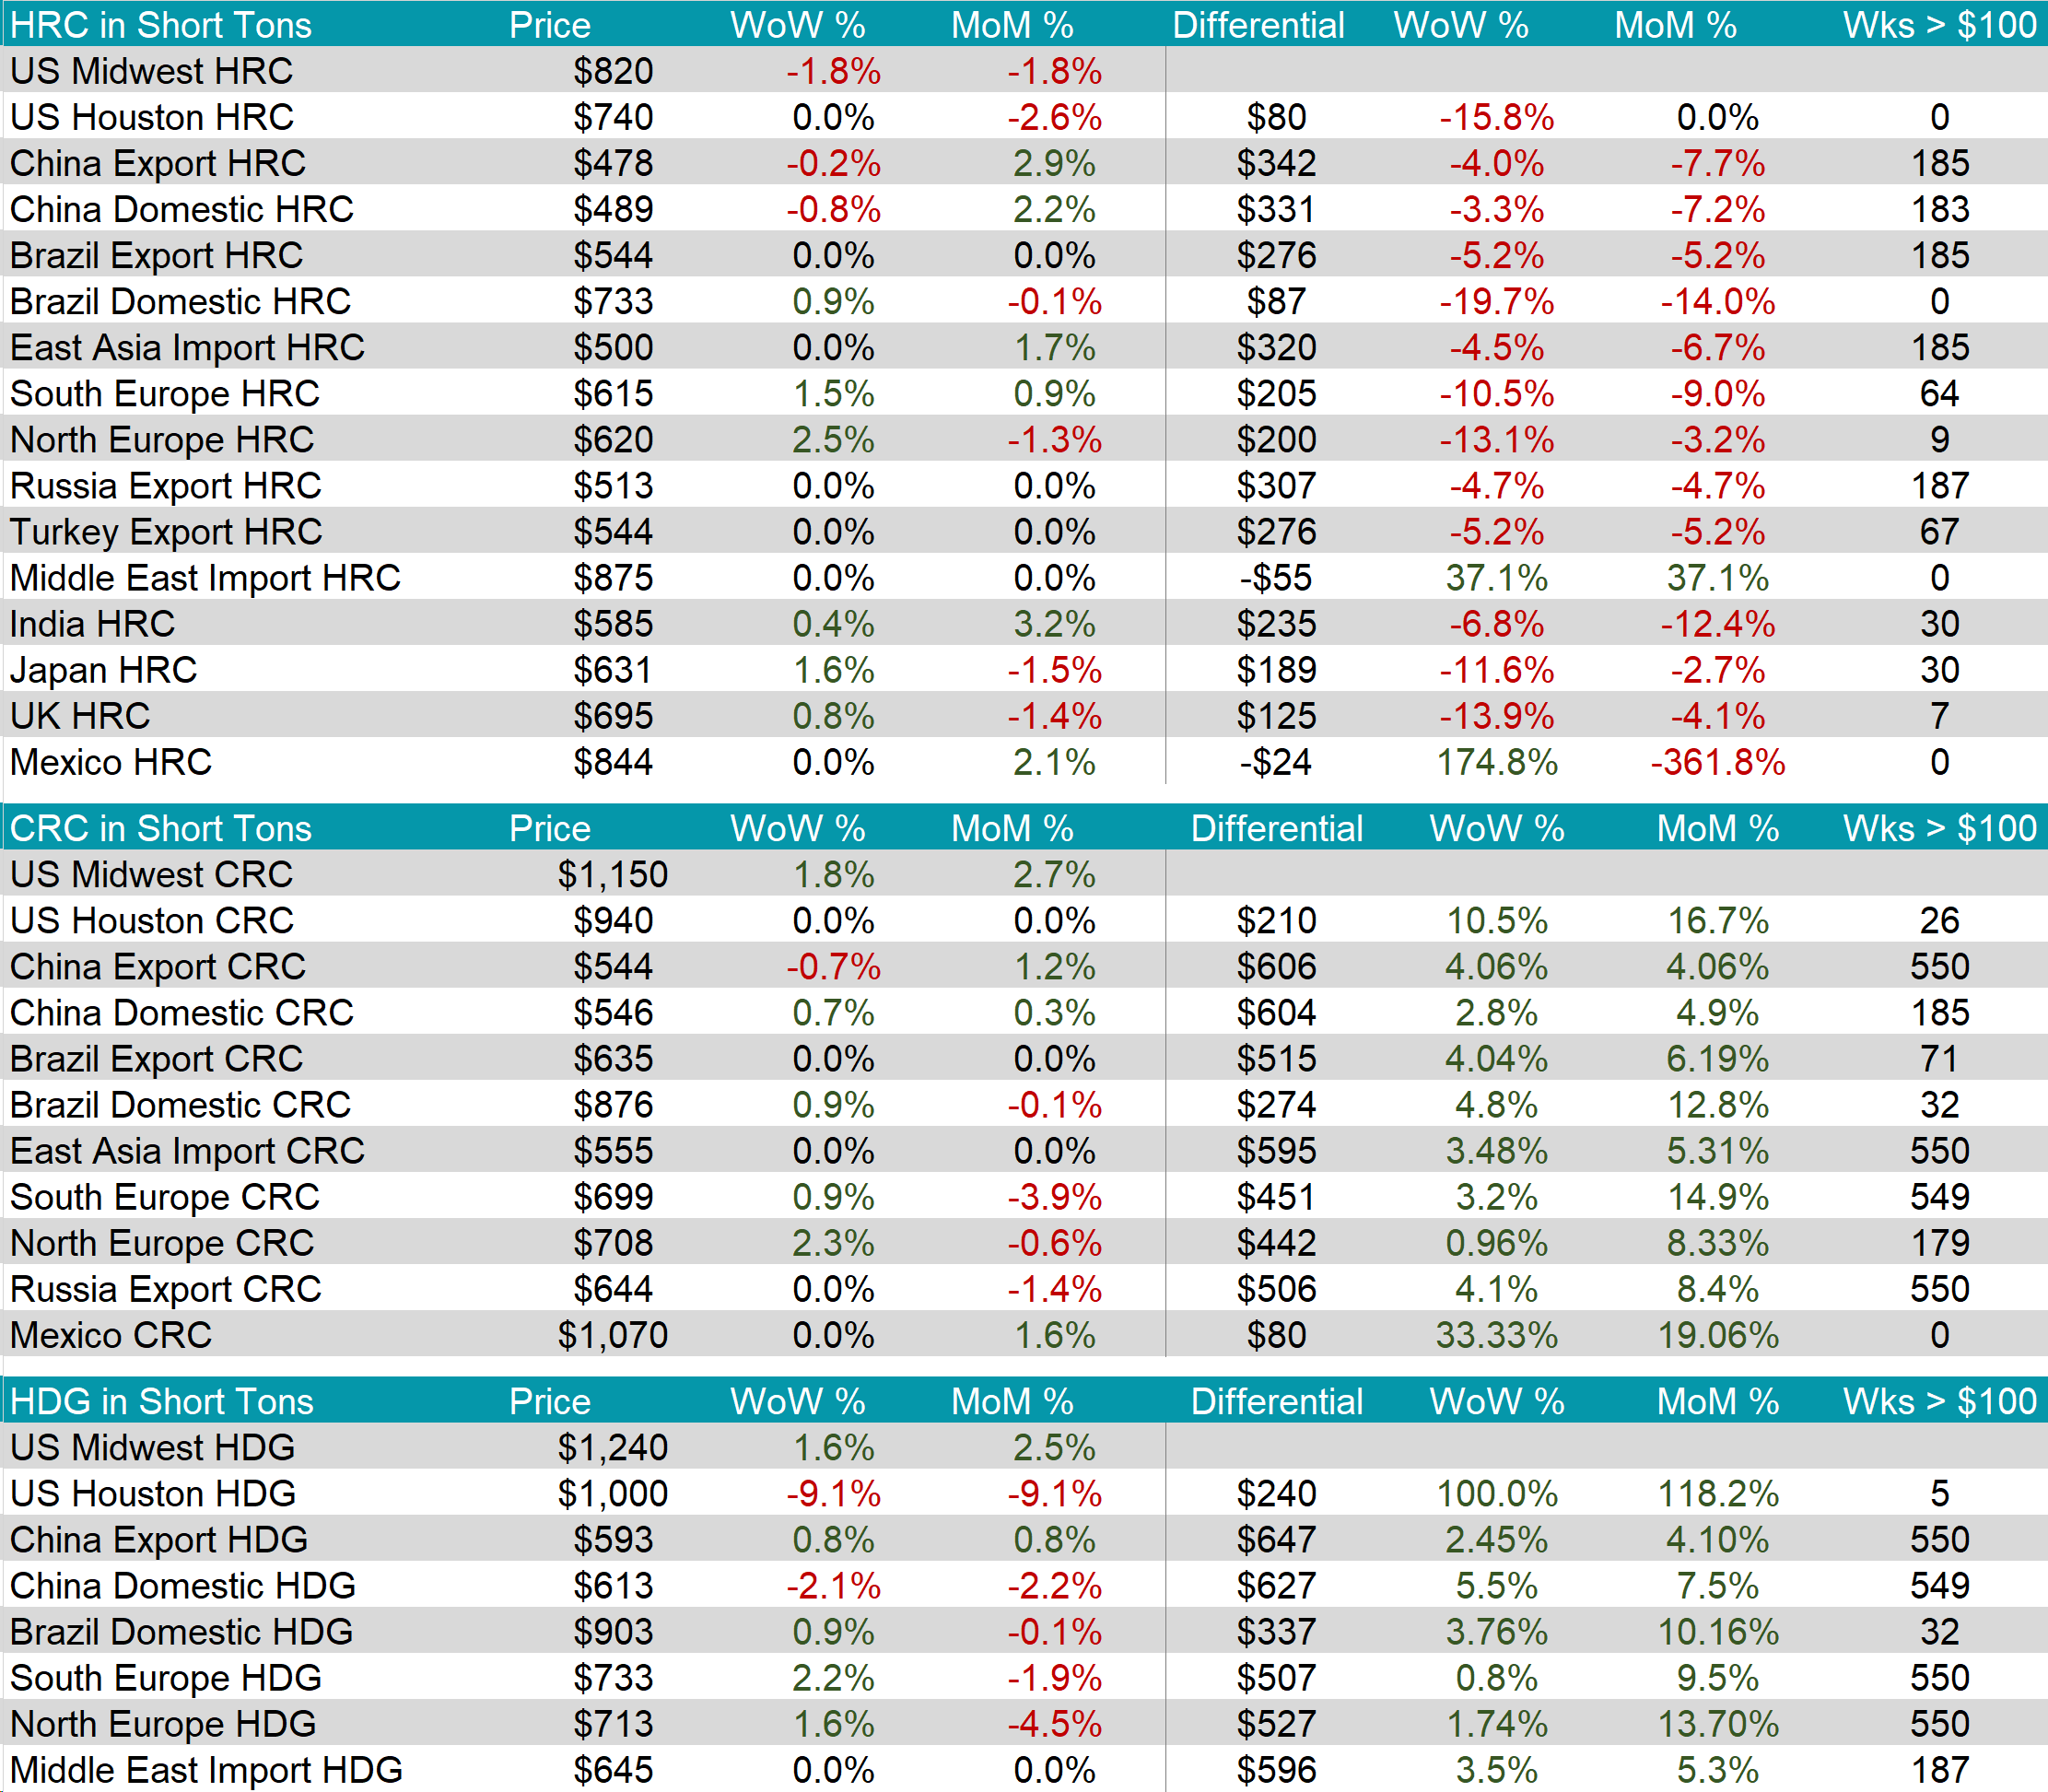
Tandem products both went up by $20, bringing the HDG – HRC differential to $330, a notable jump up of $35 or 11.9%.
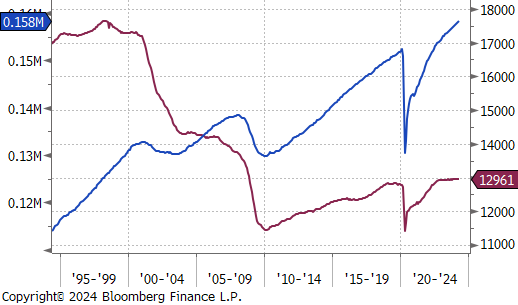
Mill production retreated further, with capacity utilization ticking down by -0.7% to 76.6%, bringing raw steel production down to 1.701m net tons, its lowest level since January.
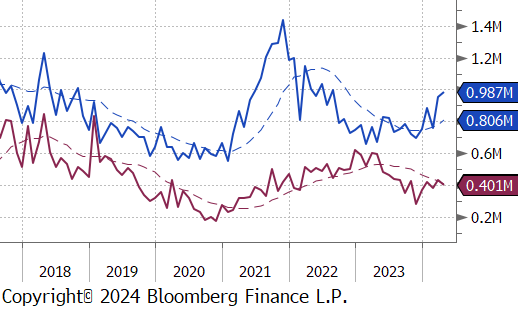
April Projection – Sheet 987k (up 31k MoM); Tube 401k (down 35k MoM)
March Projection – Sheet 956k (up 197k MoM); Tube 436k (up 52k MoM)
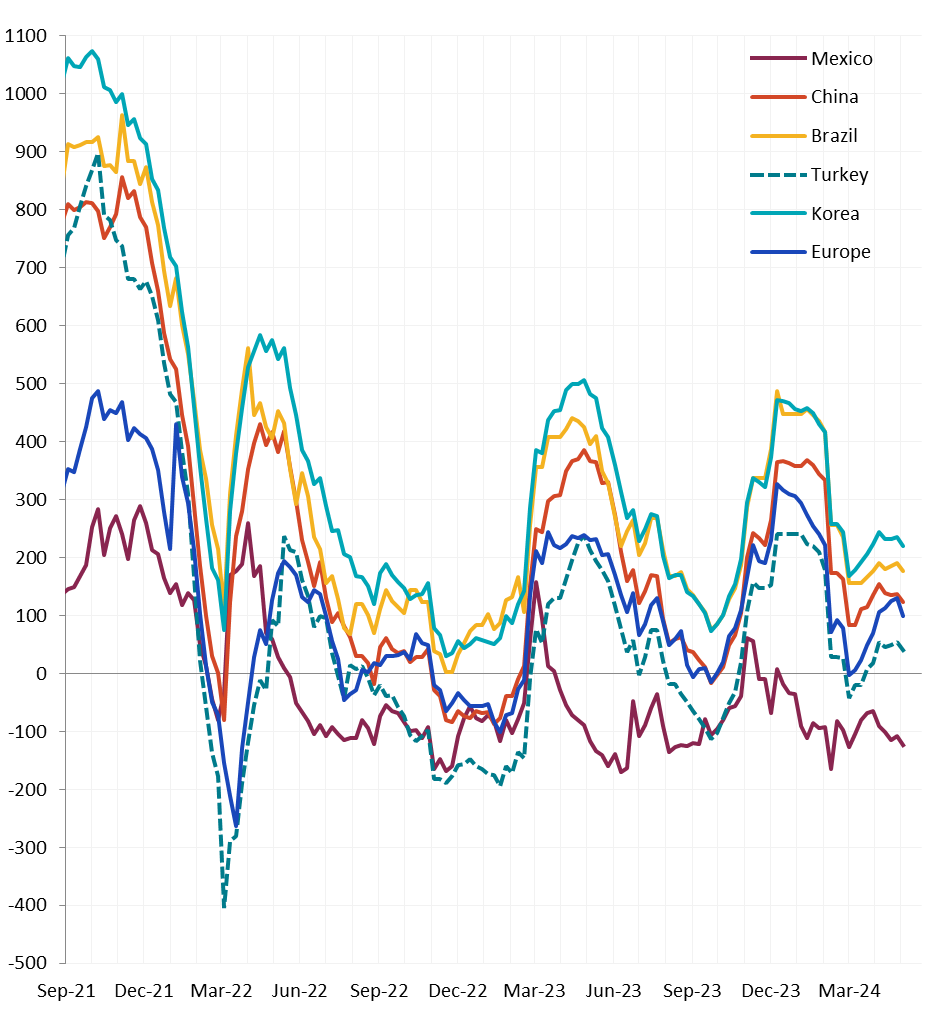
All watched global differentials shrank this week, except for Mexico. Europe HRC experienced the biggest price increase, which was by 2.5%. Meanwhile, China Export and Domestic HRC declined by -0.2% and -0.8%, respectively.
Scrap
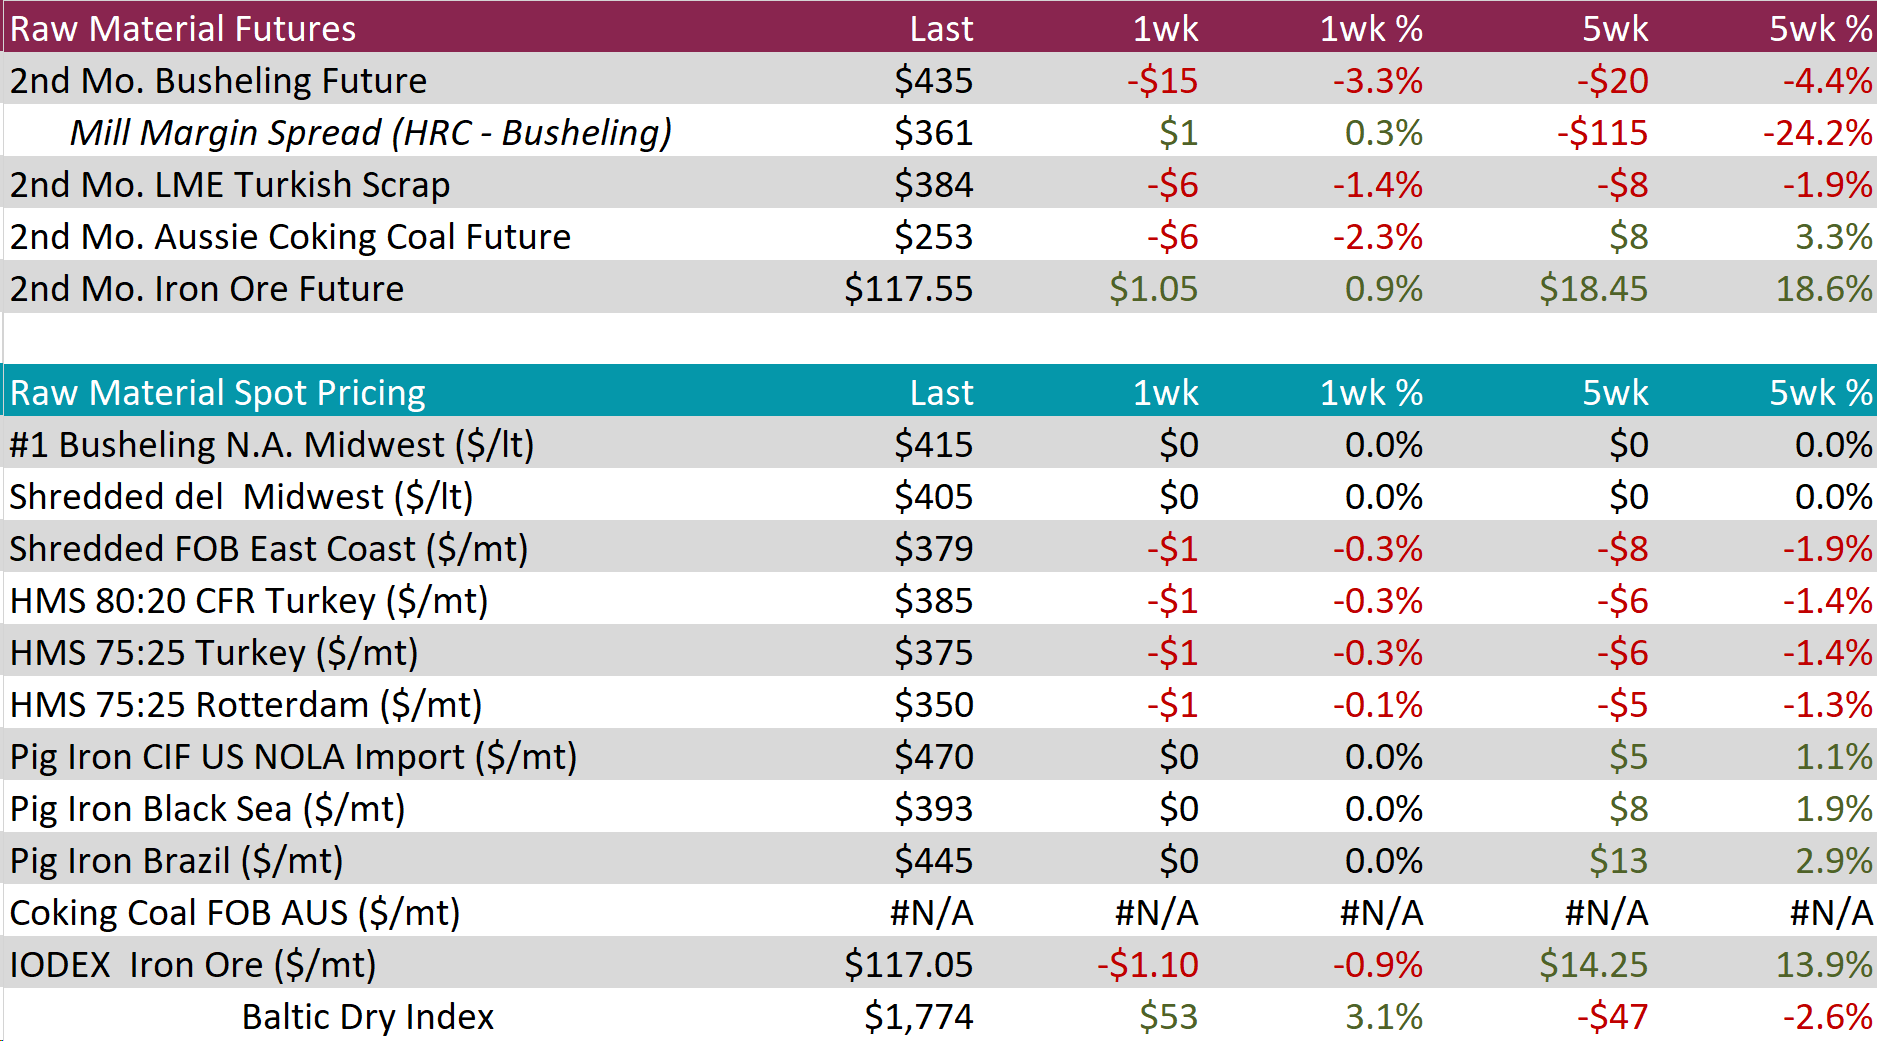
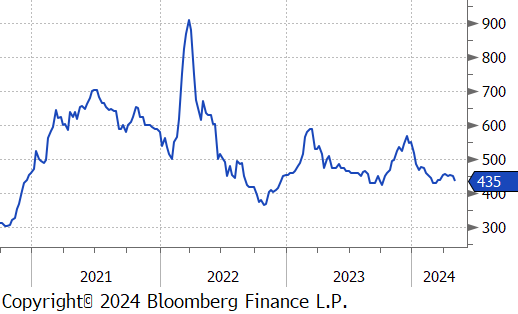
The 2nd month busheling future fell by $15 or -3.3% to $435, continuing last weeks price decline and hitting its lowest price in eight-weeks.
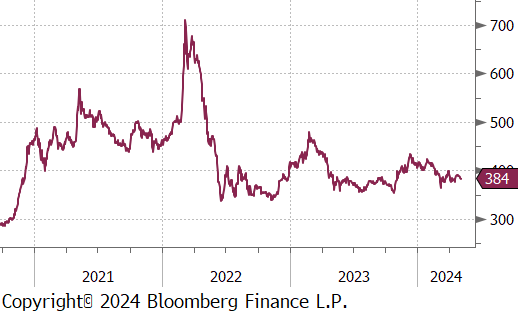
The 2nd month LME Turkish scrap future dropped by $6 or -1.4% to $384, retreating from the gains made over the past three weeks.
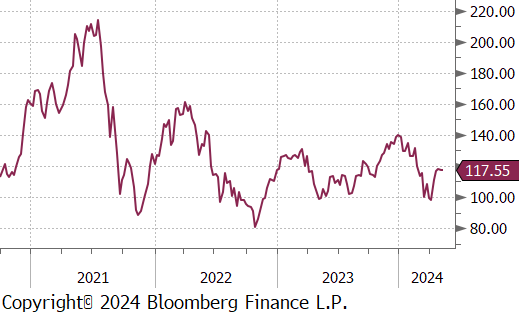
The iron ore 2nd month future edged up by $1.05 or 0.9% to $117.55, marking the fourth consecutive week of price increases.
Dry Bulk / Freight
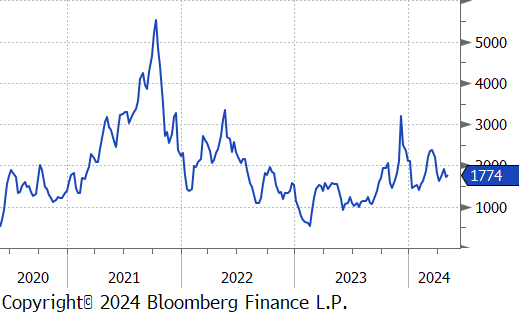
The Baltic Dry Index experienced an uptick, climbing up by $53 or 3.1% to $1,774, marking a slight rebound after notably dropping from recent price high last week.
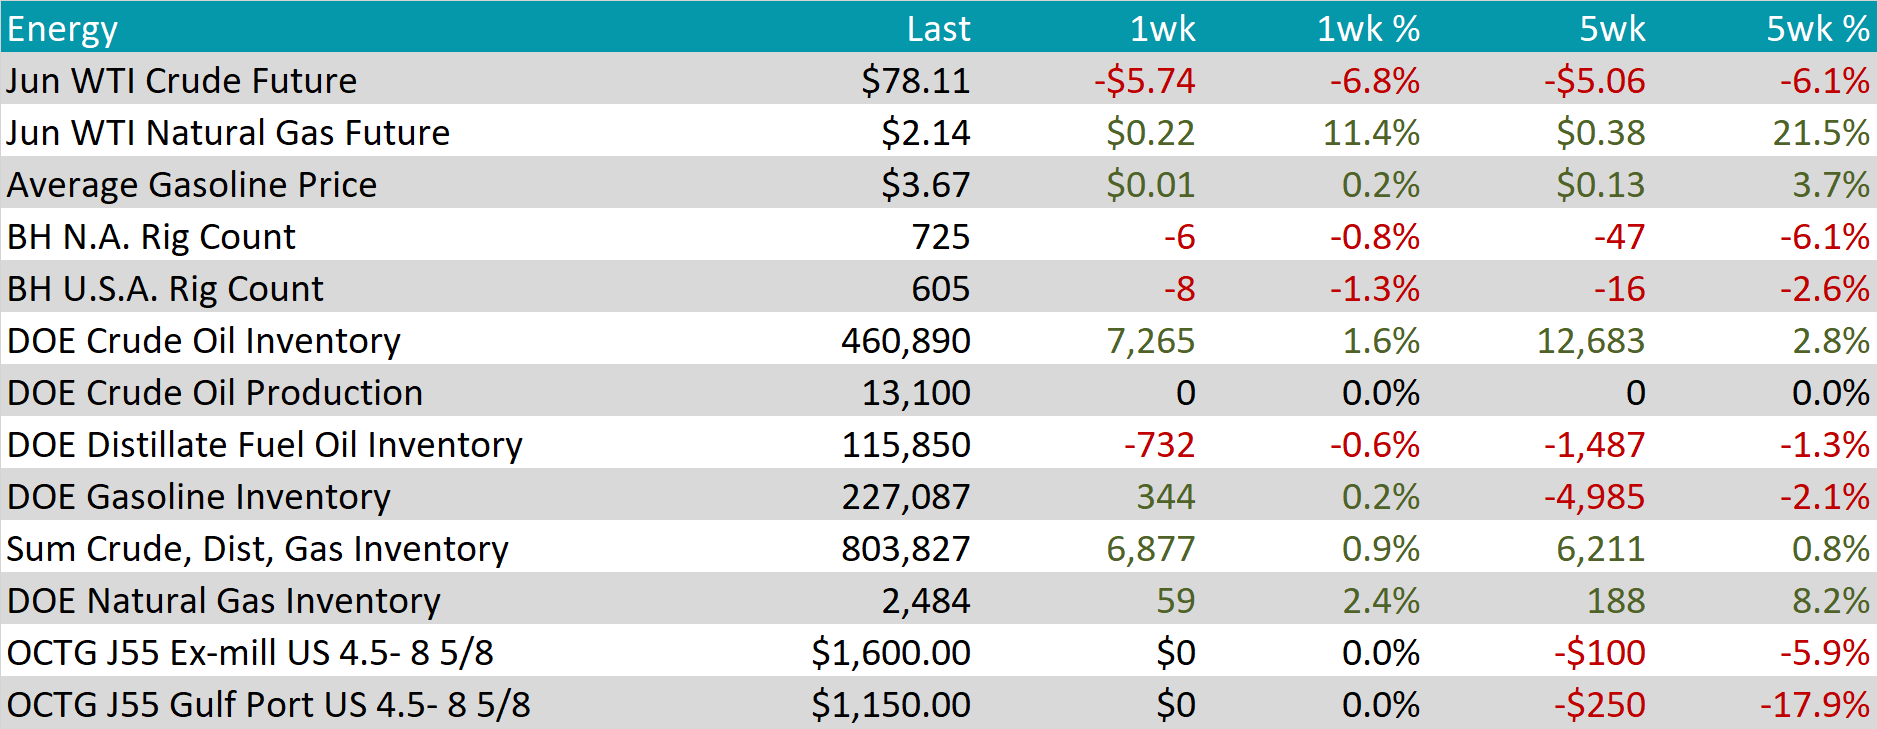
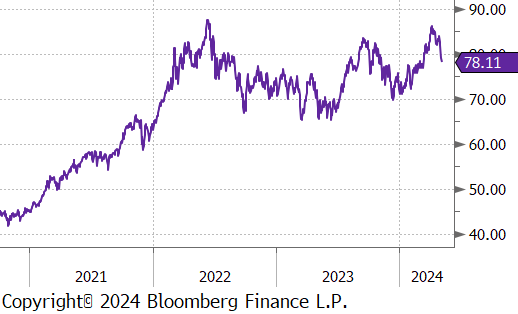
WTI crude oil future lost $5.74 or -6.8% to $78.11/bbl, really marking a reversal of its recent upward trend.
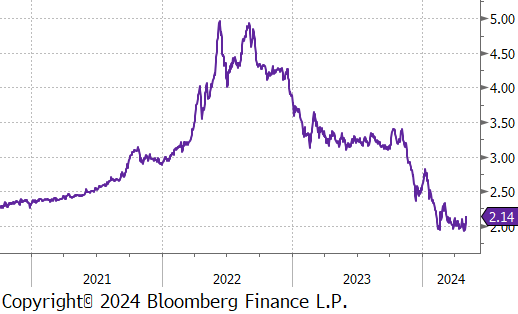
WTI natural gas future gained $0.22 or 11.4% to $2.14/bbl.
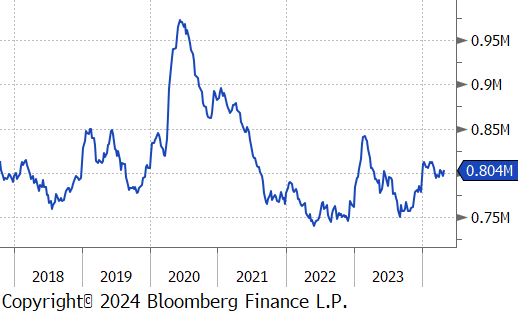
The aggregate inventory level experienced a slight uptick of 0.9%.
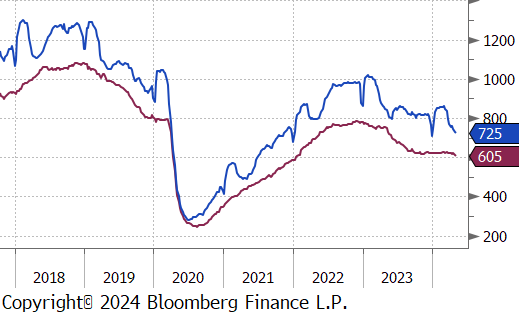
The Baker Hughes North American rig count reduced by 6 rigs, bringing the total count to 725 rigs. At the same time, the US rig count also declined, reducing by 8 rigs, bringing the total count to 605 rigs.
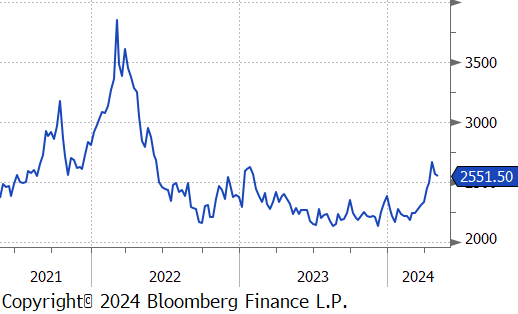
Aluminum fell by $18 or -0.7% to $2,552, continuing the drop from its recent price high, as Western sanctions on Russian metal continue to impact market availability. This restriction has exacerbated supply concerns, with fears that Western buyers might avoid purchasing Russian aluminum outside of LME contracts, anticipating future sanctions. In addition, the Aluminum Corp of China highlighted ongoing uncertainties regarding the country’s bauxite supply, primarily due to its reliance on Guinea, which has experienced disruptions following an explosion at a critical fuel storage facility. Furthermore, aluminum production in Yunnan, China’s fourth-largest aluminum-producing region, continues to face curbs during the annual dry season.
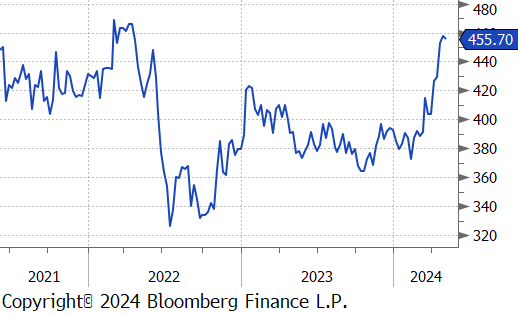
Copper edged down, declining by $1.70 or -0.4% to $456. The pause in the rally reflects market evaluations of supply threats and robust long-term demand prospects. Disruptions include the suspension of operations at Cobre Panama, the world’s largest open-pit copper mine, and power shortages impacting key mines in Zambia. Additionally, reduced profit margins for Chinese smelters could result in a coordinated 10% reduction in this year’s output. High costs associated with developing new mines have prompted industry players, like BHP’s recent bid to acquire Anglo American, to engage in mergers and acquisitions rather than start new projects. On the demand side, copper’s essential role in electrification continues to support a bullish long-term outlook.
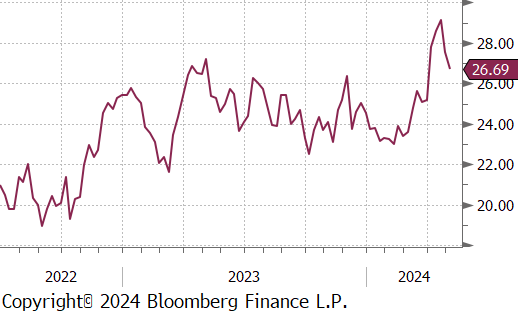
Silver fell to $26.69, mirroring a downturn in precious metals, driven by recent U.S. economic data that supports the Federal Reserve maintaining higher interest rates for an extended period. The employment cost index, a crucial indicator of wage trends, rose 1.2% in Q1, up from 0.9% in the previous quarter and surpassing expectations of a 1% increase. Together with the PCE data, this suggests persistent inflationary pressures and narrows the possibility for rate cuts by the Fed this year. Market expectations for the first rate cut have shifted to November from September. While high interest rates reduce the attractiveness of non-yielding assets like silver, the metal is still on track for a monthly gain of over 6%, bolstered by its dual appeal as a safe-haven asset and its industrial uses.
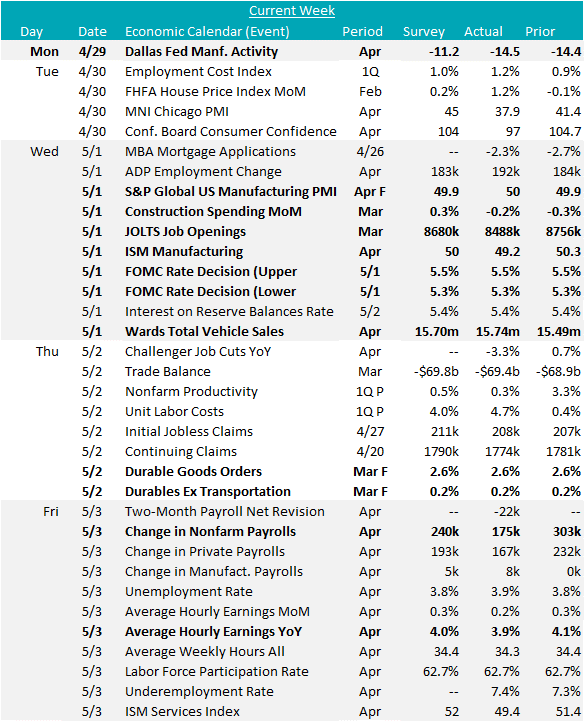
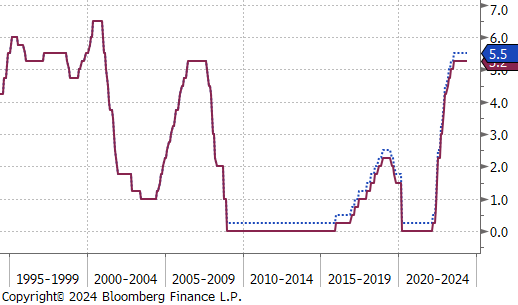
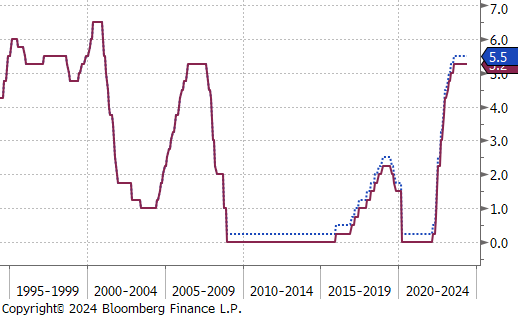
Ever since the current hiking cycle ended, the market has looked over “FED talk” and economic data with a fine-tooth comb, desperate to figure out when policy will start to ease. However, after 4 months of warmer than comfortable inflation readings and a Q1 GDP print that came in well below market expectations, this week’s meeting was going to be pivotal. The result was that the FOMC kept rates unchanged at 5.25-5.5% and Jay Powell’s press conference took more of a hawkish turn (both as expected, however, the latter did not fully satisfy market expectations). One of the more notable sticking points for why Powell drew his “hawkish line” below the threshold of the next rate move being a hike was because he noted that the committee viewed risks to their price/labor dual mandate more in balance than before. Plainly, this would suggest, they believe rates are sufficiently restrictive to bring inflation down while allowing the economy to continue growing and that an additional hike from here would do outsized damage to the labor market.
Now that we have the April jobs report and additional service sector data from the ISM, this underlying view received some support. Non-farm payrolls grew at a healthy, albeit lower meaningfully lower than anticipated pace, adding 175k jobs versus the expected 240k. Gains were broad based and Manufacturing payrolls added 8k versus the expected 5k, with March was revised down to -4k lost, versus the preliminary a “flat” reading.