Flack Capital Markets | Ferrous Financial Insider
May 10, 2024 – Issue #431
May 10, 2024 – Issue #431
Overview:
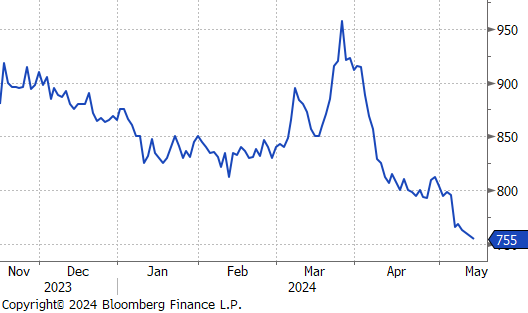
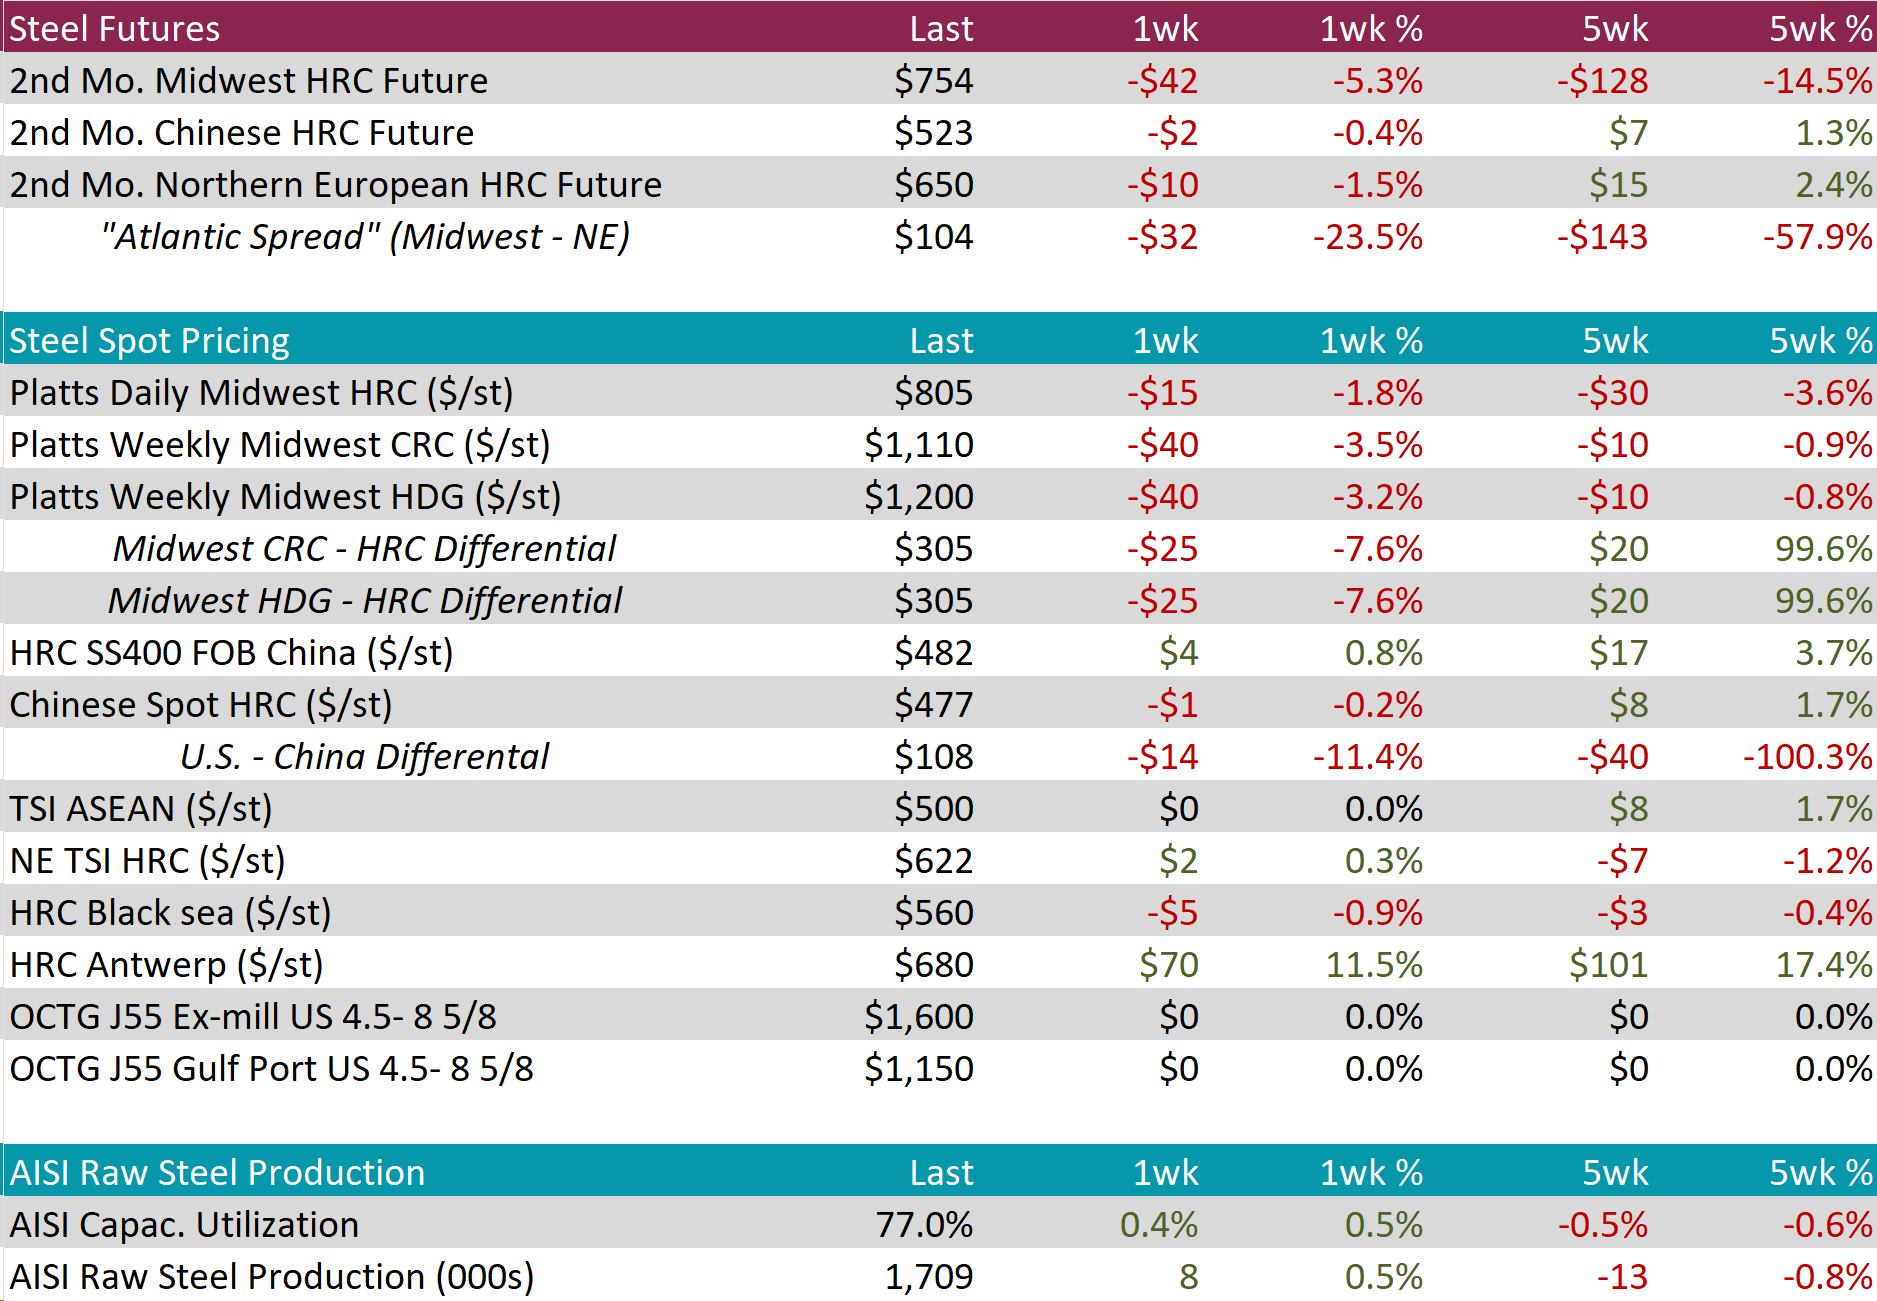
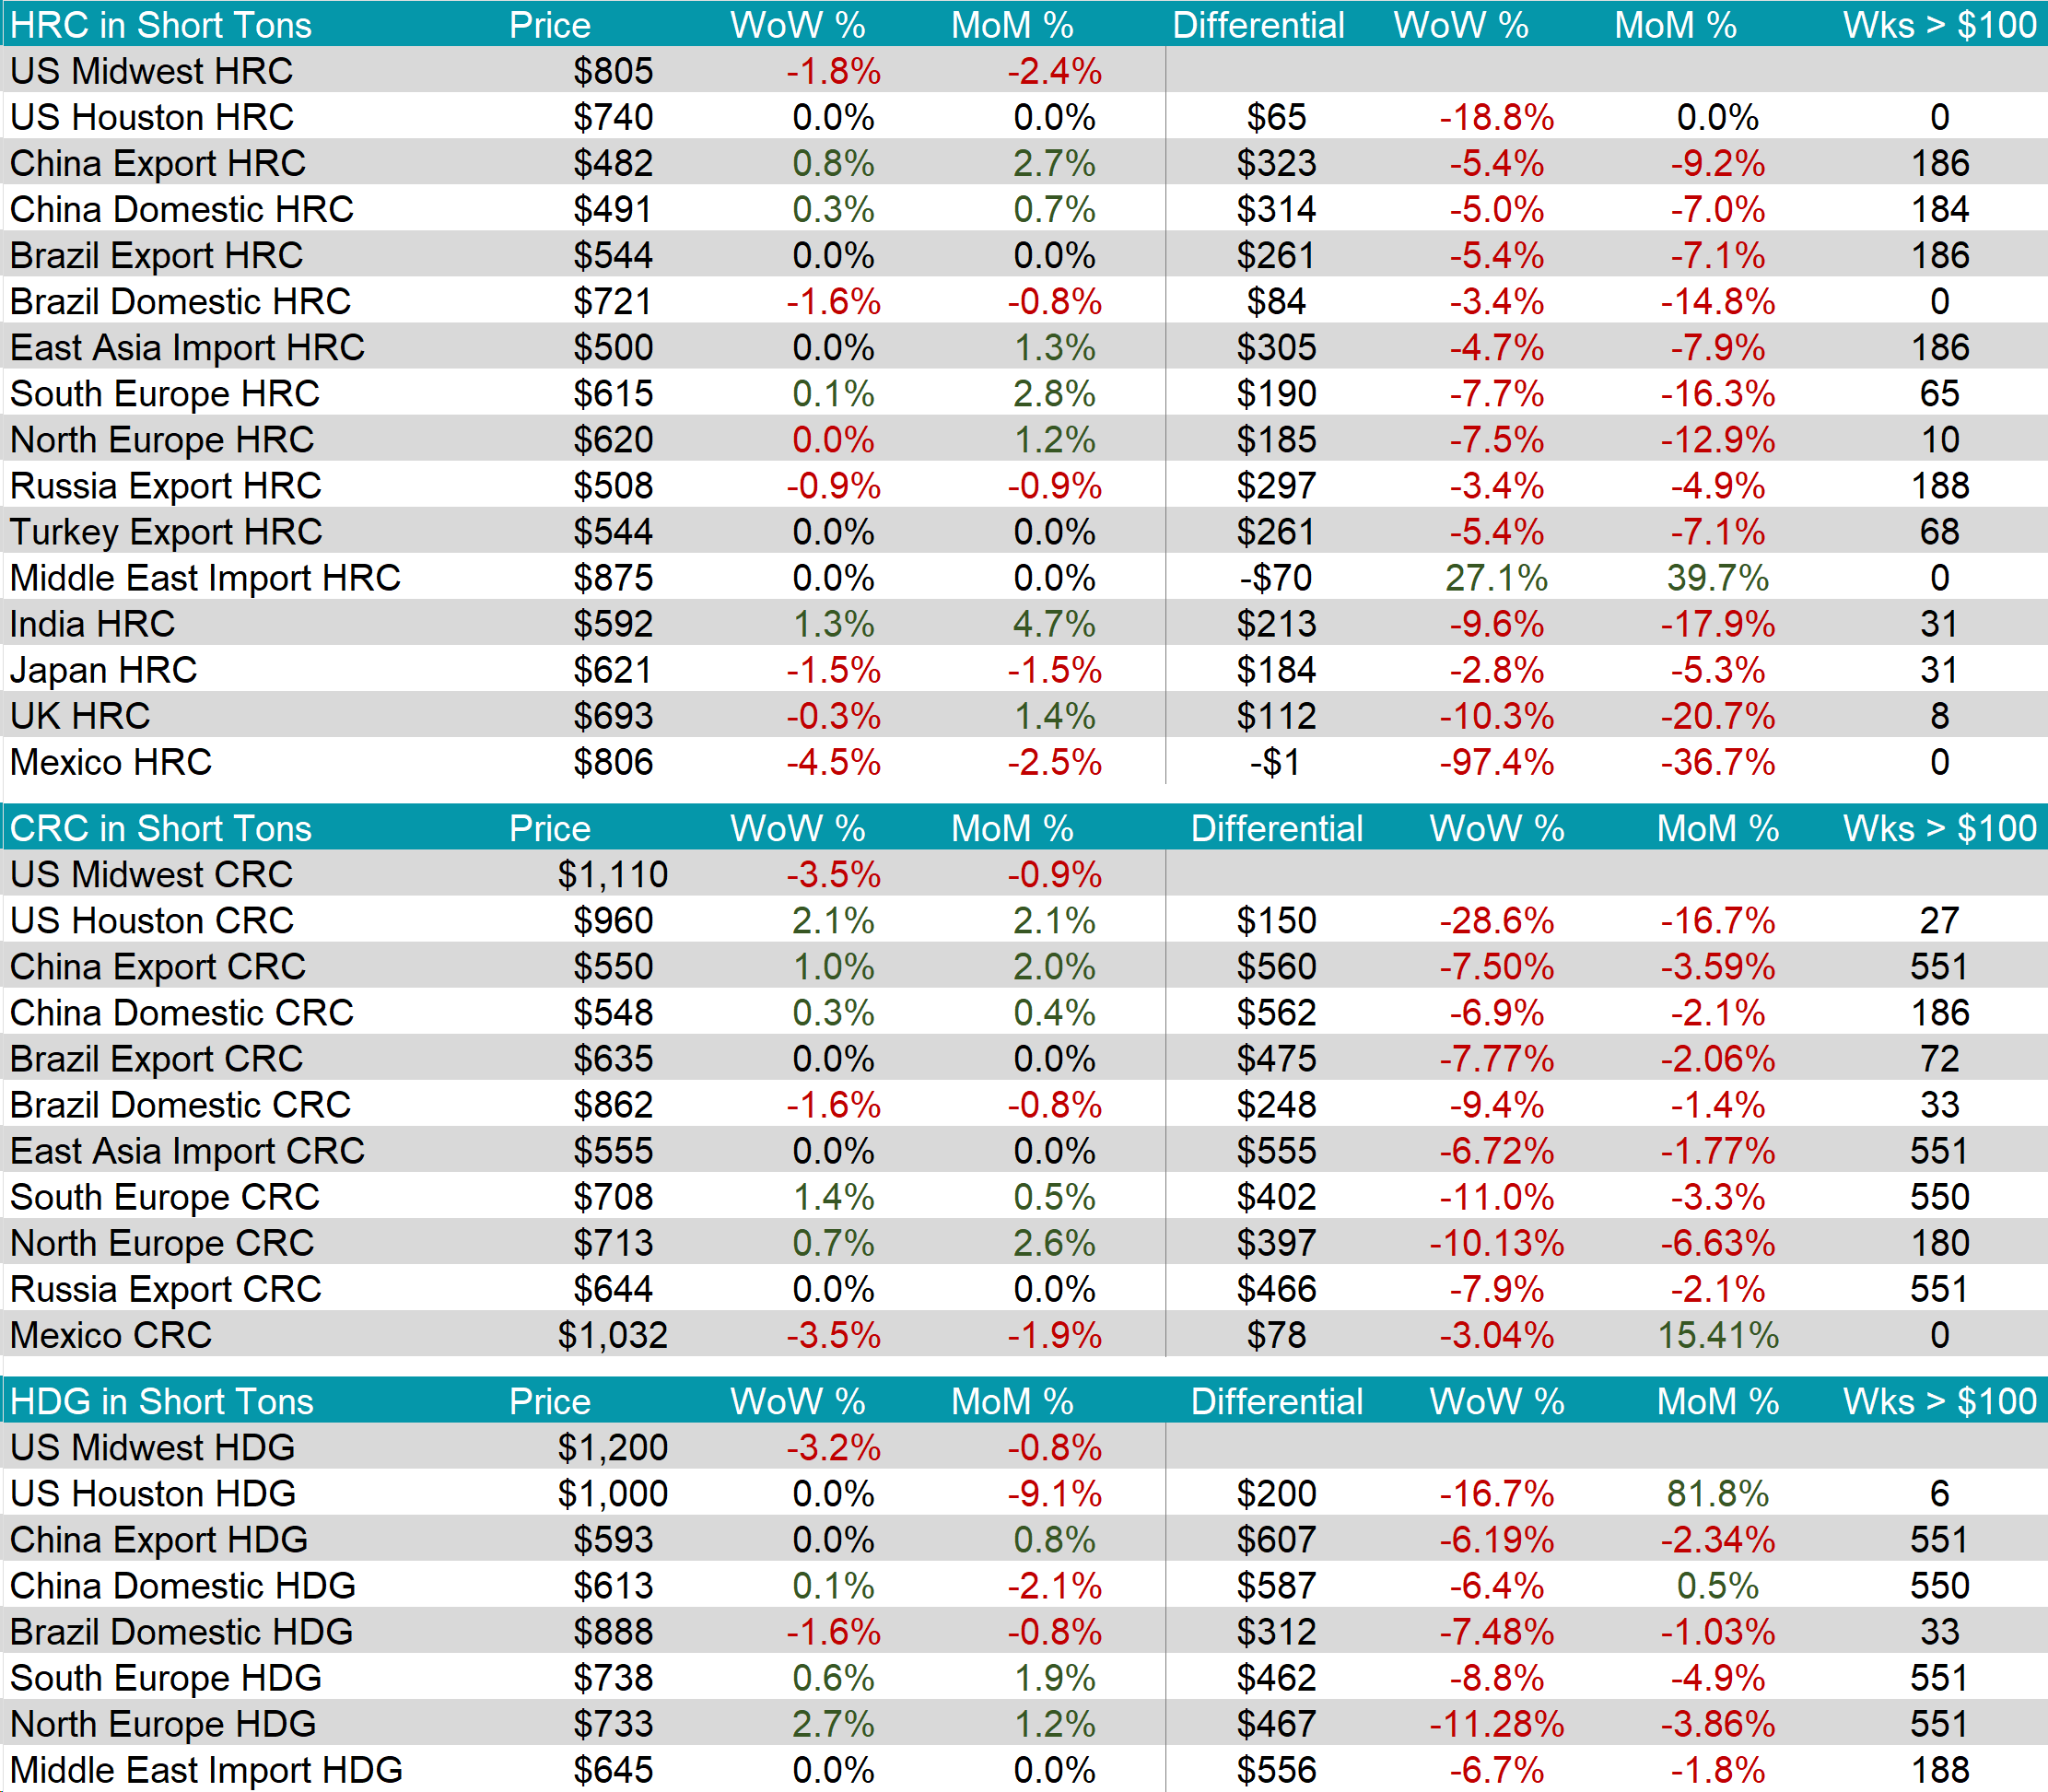
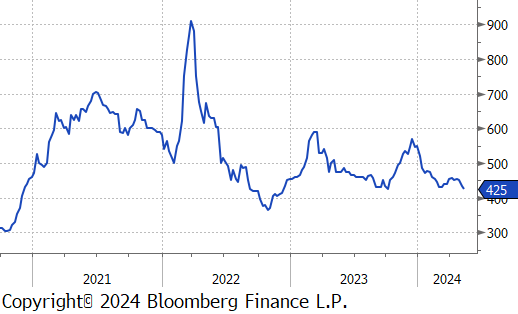
The HRC spot price declined further, falling by $15 or -1.8% to $805, hitting the lowest price in eight-weeks, and bringing the five-week price change down by $30 or -3.6%. At the same time, the 2nd month future dropped by $42 or -5.3% to $754, reaching its lowest price since September 2023.
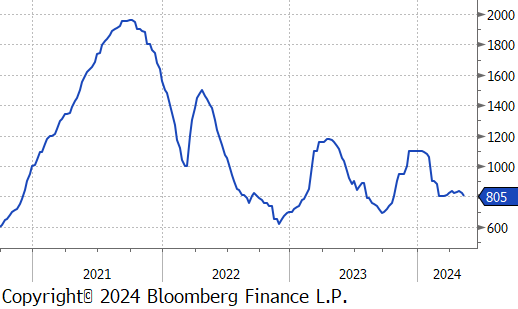
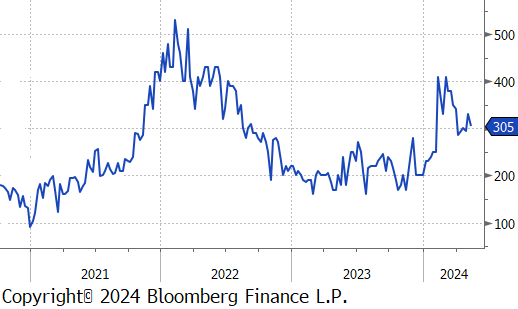
Tandem products both decreased by $40, resulting in the HDG – HRC differential to fall by $25 or -7.6% to $305.
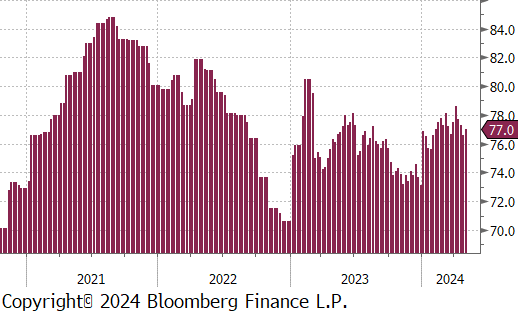
Mill production rebounded a bit after its recent low hit last week, with capacity utilization ticking up by 0.4% to 77.0%, bringing raw steel production up to 1.709m net tons.
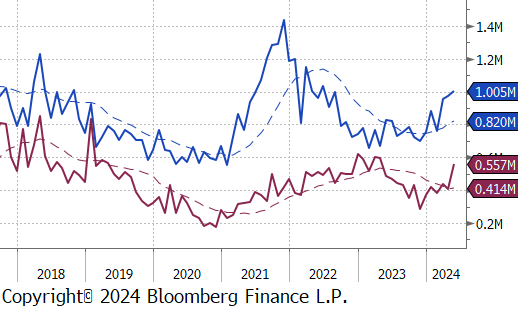
May Projection – Sheet 1005k (up 34k MoM); Tube 557k (up 150k MoM)
April Projection – Sheet 971k (up 15k MoM); Tube 407k (down 29k MoM)
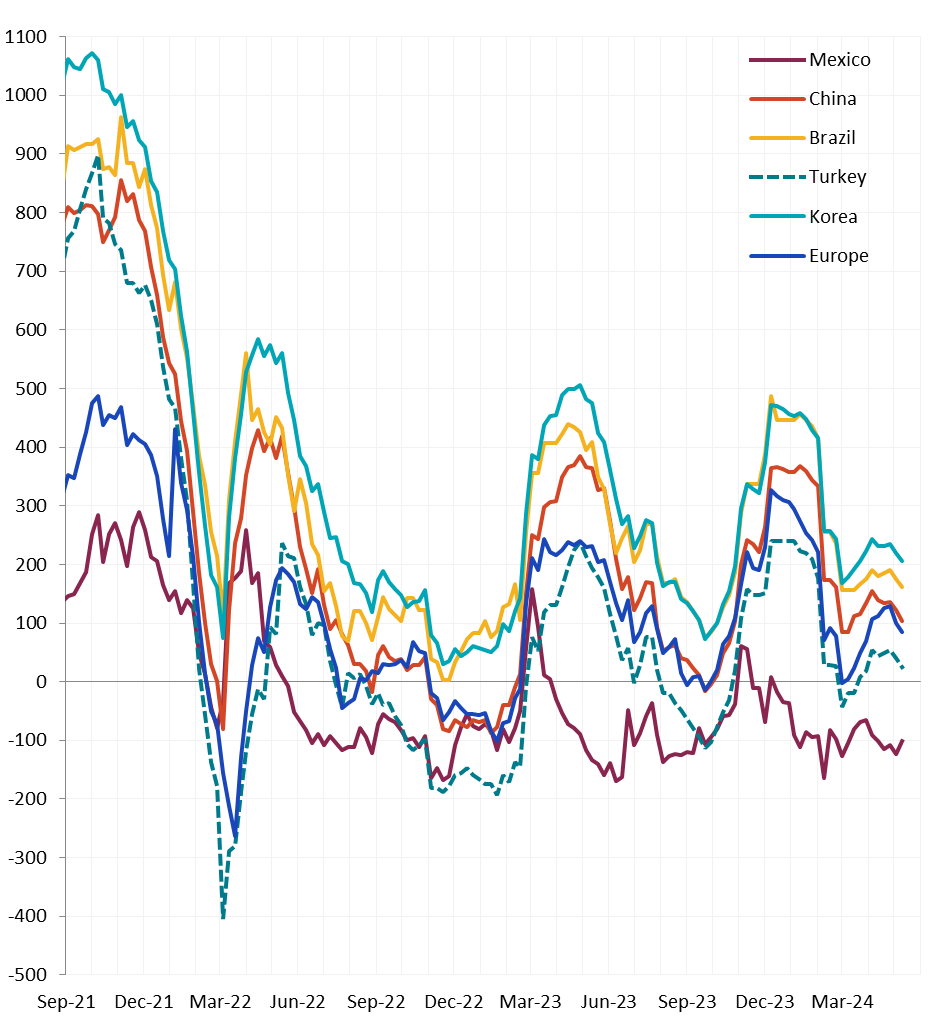
All watched global differentials contracted this week, with China Export HRC increasing by 0.8%, Mexico HRC declining by -4.5%, and Brazil Domestic HRC down by -1.6%.
Scrap
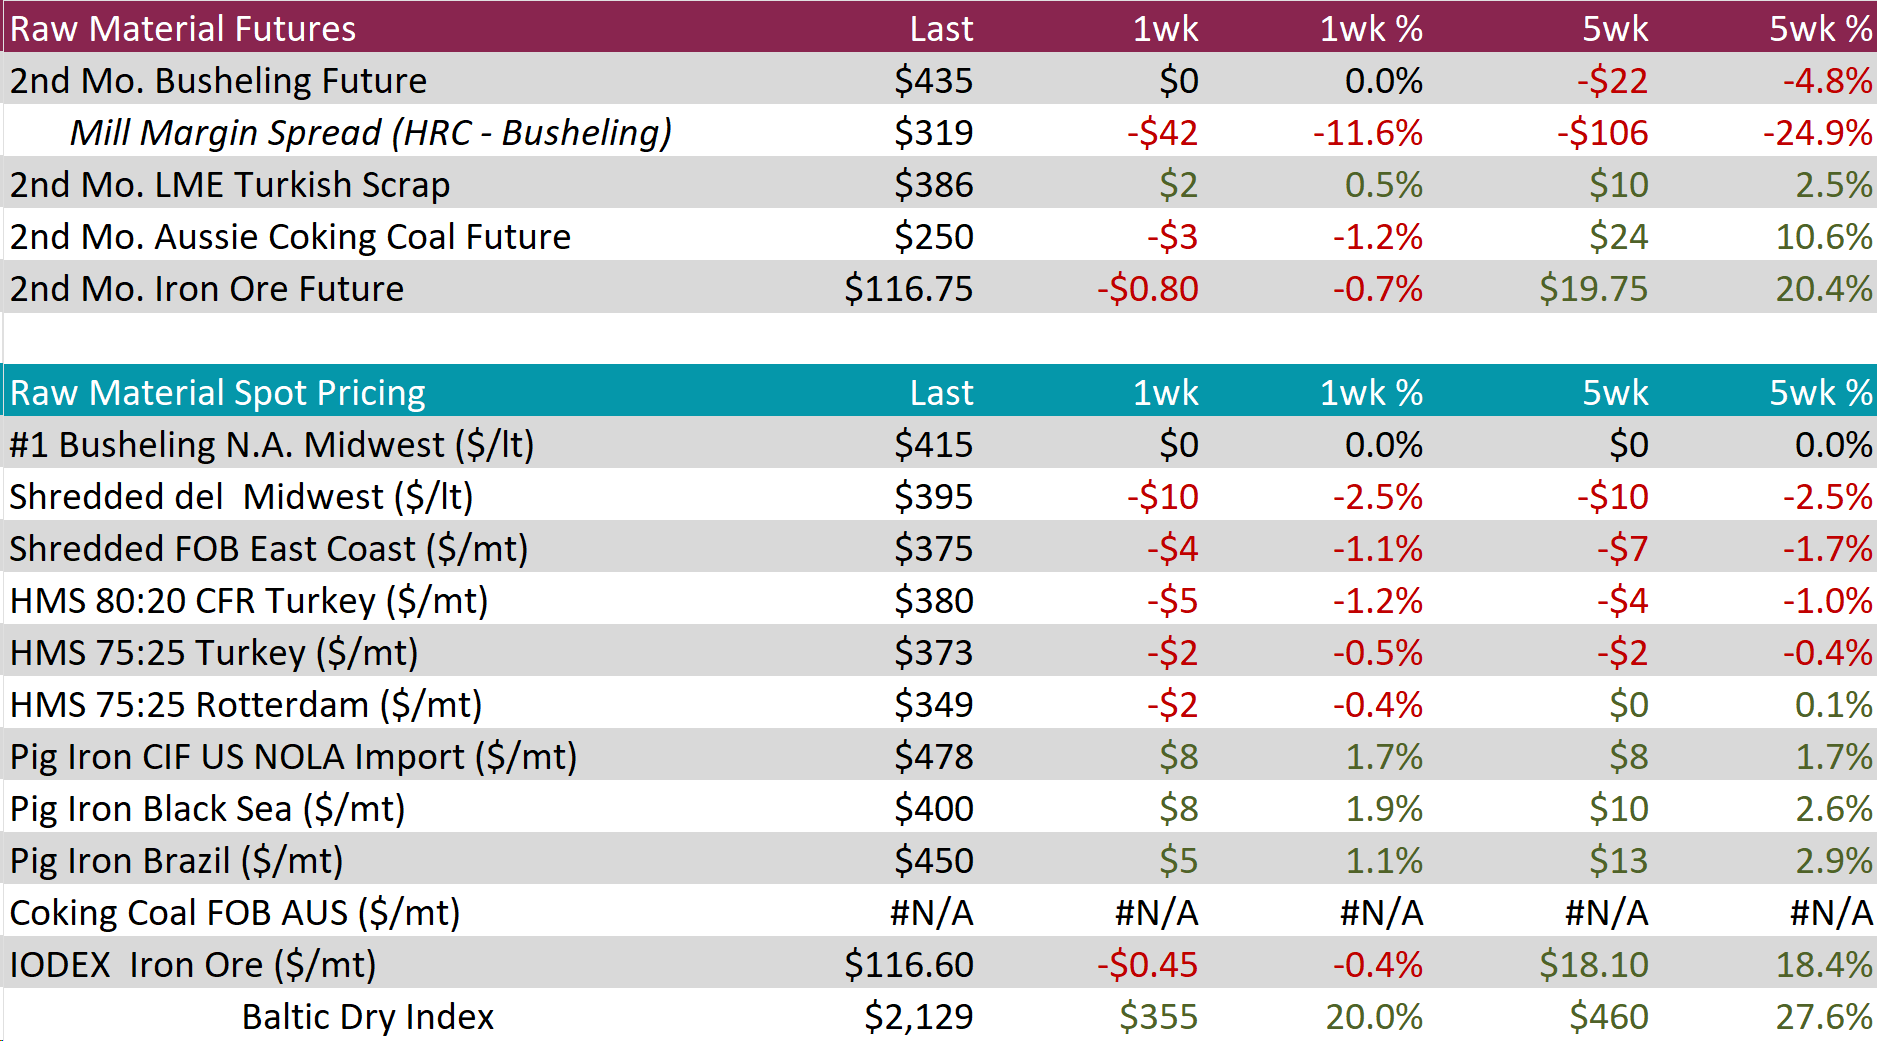
The 2nd month busheling future remained unchanged at $435, the five-week price change in now down by $22 or -4.8%.
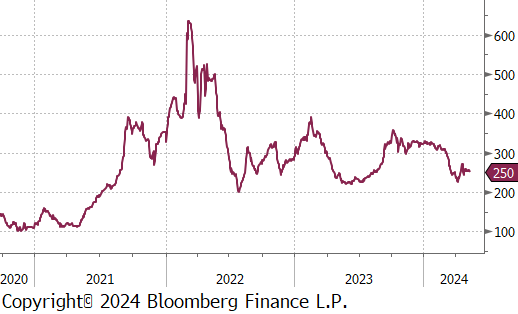
The Aussie coking coal 2nd month future fell by $3 or -1.2% to $250, however the five-week price change is still up by $24 or 10.6% to $250.
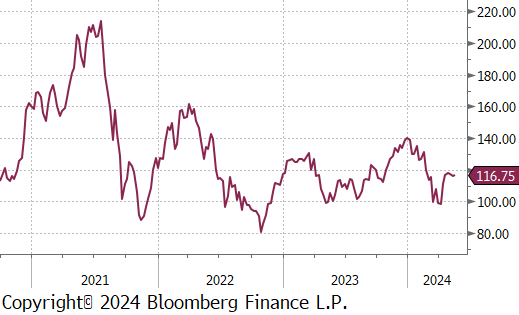
The 2nd month iron ore future edged down by $0.80 or -0.7% to $116.75, however, similarly, the five-week price change continues to be up, by $19.75 or 20.4%.
Dry Bulk / Freight
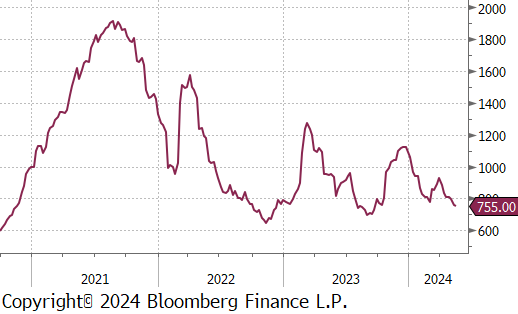
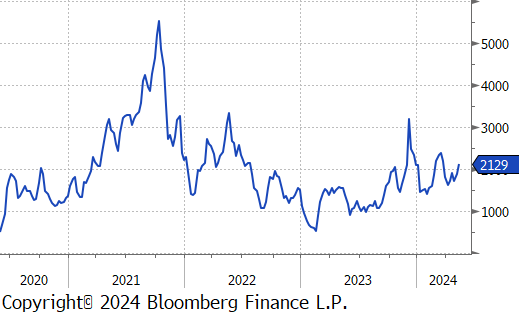
The Baltic Dry Index rose by $355 or 20.0% to $2,129, reaching its highest level in seven-weeks.
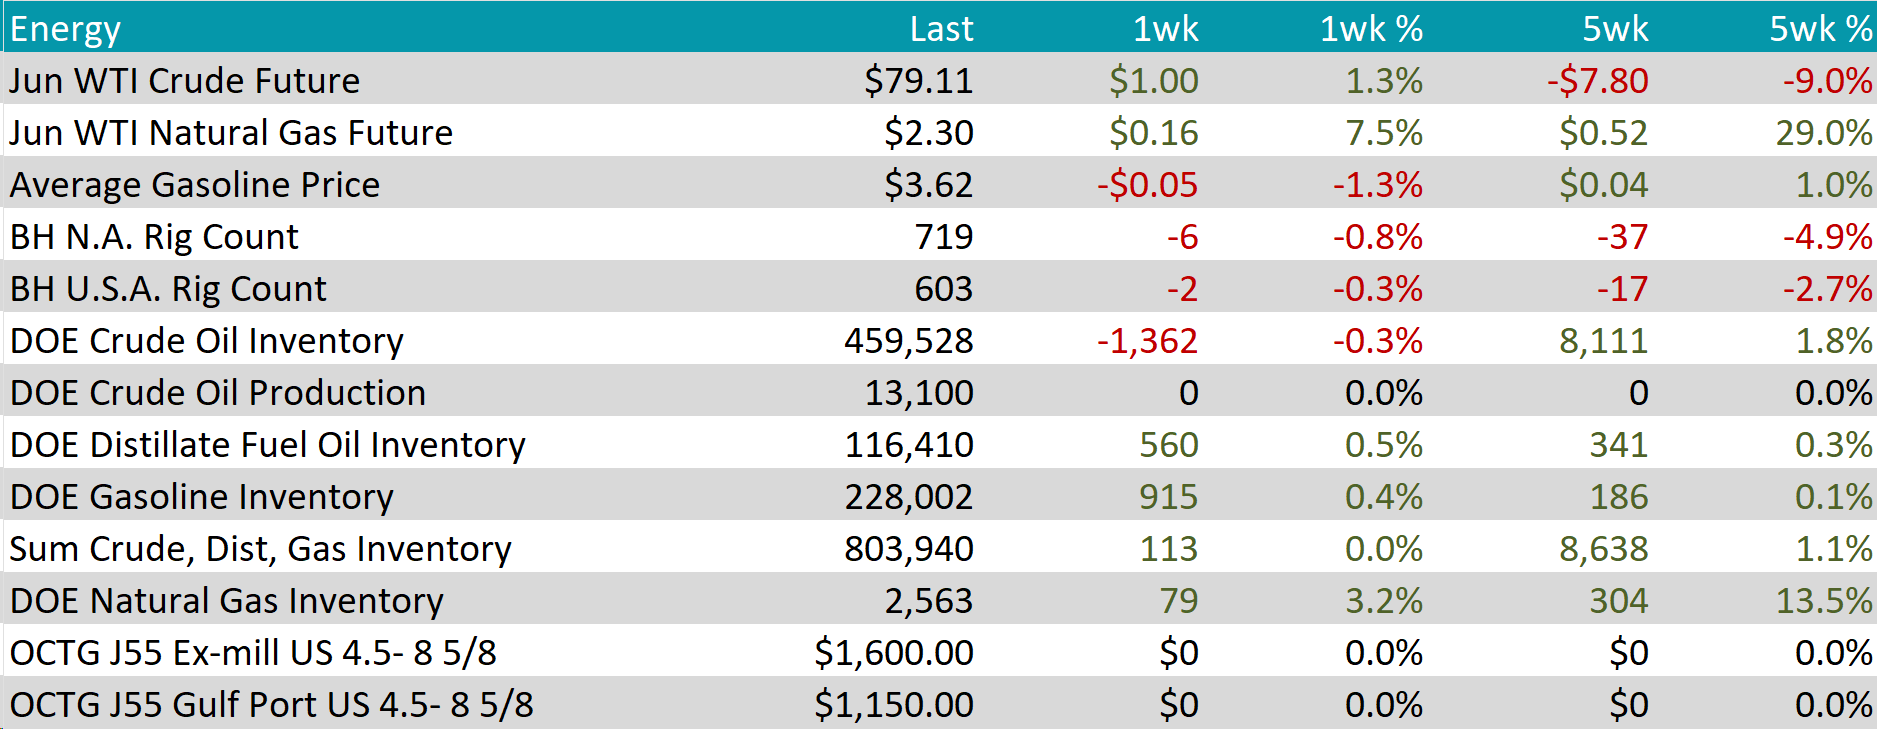
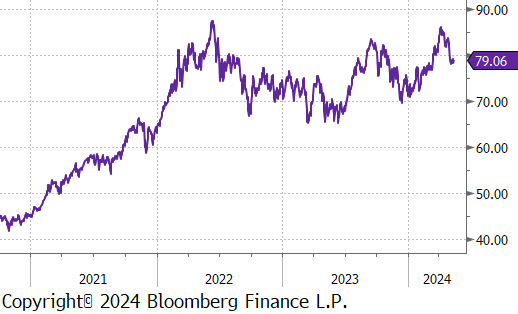
WTI crude oil future gained $1.00 or 1.3% to $79.11/bbl.
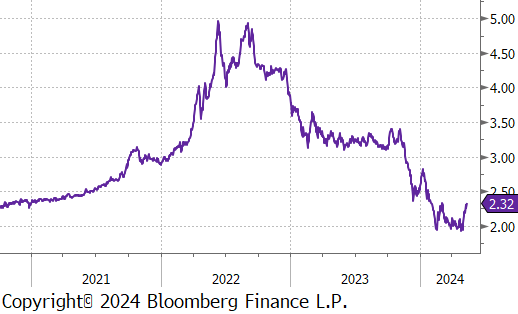
WTI natural gas future gained $0.16 or 7.5% to $2.30/bbl.
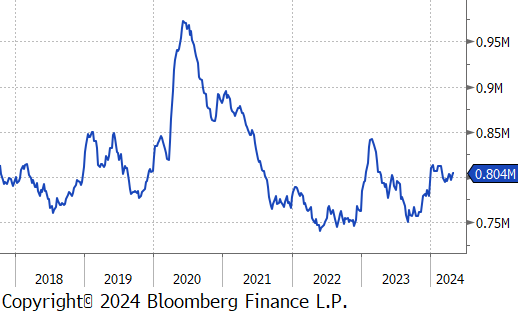
The aggregate inventory level experienced a slight increase of 0.0%.
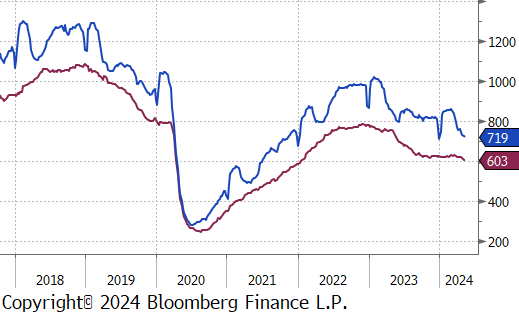
The Baker Hughes North American rig count reduced by 6 rigs, bringing the total count to 719 rigs. The US rig count also declined, reducing by 2 rigs, bringing the total count to 603 rigs, continuing to hover just above the 600 level.
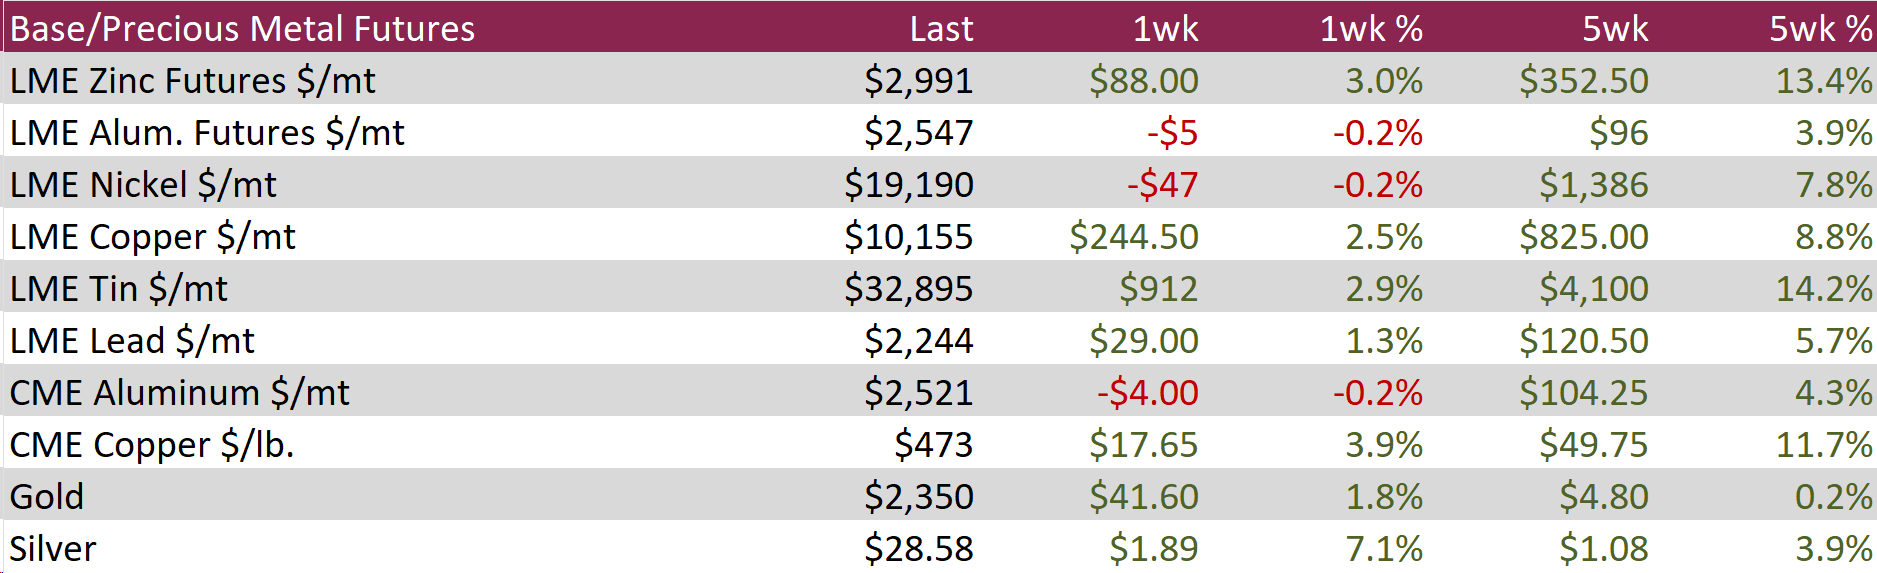
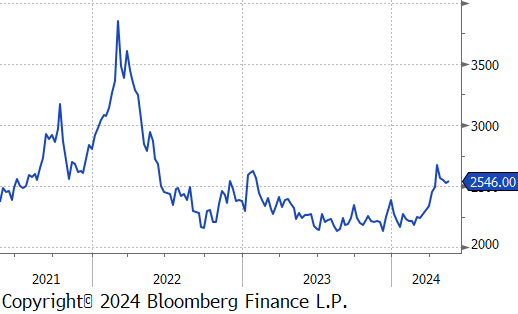
Aluminum futures fell by $5 or -0.2% to $2,547, down from a near two-year high, as concerns over supply shortages eased. This change followed a significant increase in London Metal Exchange (LME) stocks, which saw nearly 140,000 tonnes of sanctioned Russian aluminum re-warranted, allowing traders to engage in profitable rent deals in approved warehouses. Despite this boost in available stocks, the market’s fundamentals remained largely unchanged because the re-warranting of metals by commodity giants was anticipated. However, new sanctions continue to restrict the sale of aluminum to US and UK markets, maintaining some supply limitations. Additionally, the Aluminum Corp of China highlighted ongoing uncertainties in bauxite supply, largely due to China’s reliance on Guinea, which has faced disruptions after an explosion at a critical fuel depot. In Yunnan, China’s fourth-largest aluminum-producing region, production curbs persisted due to the annual dry season, further impacting supply dynamics.
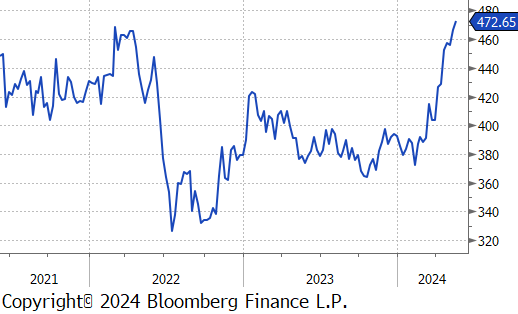
Copper jumped by $17.65 or 3.9% to $473, marking a two-year high, driven by strong long-term demand forecasts and tight supply concerns about potential shortages. Copper’s crucial role in global electrification efforts—from electric vehicle charging stations to grid-scale energy storage—supports these optimistic projections. Additionally, its increasing use in artificial intelligence and automation infrastructure is leading to higher demand. Recent data indicates that despite rising prices, China continued to import significant amounts of ore, underscoring sustained demand from manufacturers. However, material scarcity is squeezing margins for Chinese smelters, who contribute more than half of the global supply, prompting a potential 10% reduction in output this year. Faced with the high costs associated with developing new mines, major mining companies are turning to mergers and acquisitions for growth, exemplified by BHP’s recent bid to acquire Anglo American.
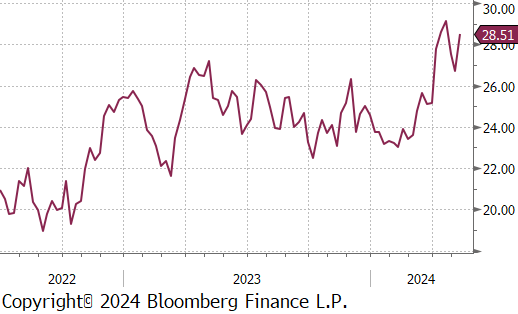
Silver rebounded by $1.89 or 7.1% to $28.58 as investors await key CPI and PPI data this week to gain clearer insights into the Federal Reserve’s potential interest rate adjustments. Earlier, weaker-than-expected U.S. non-farm payrolls and jobs data suggested a cooling labor market, which increased speculation about possible interest rate cuts within the year. Despite these indicators, Fed officials have expressed caution, hesitating to initiate early easing due to ongoing concerns about inflationary pressures. Additionally, escalating tensions in the Middle East, particularly with Israel’s military actions in eastern Jabalia, Gaza, have bolstered silver’s appeal as a safe-haven asset.
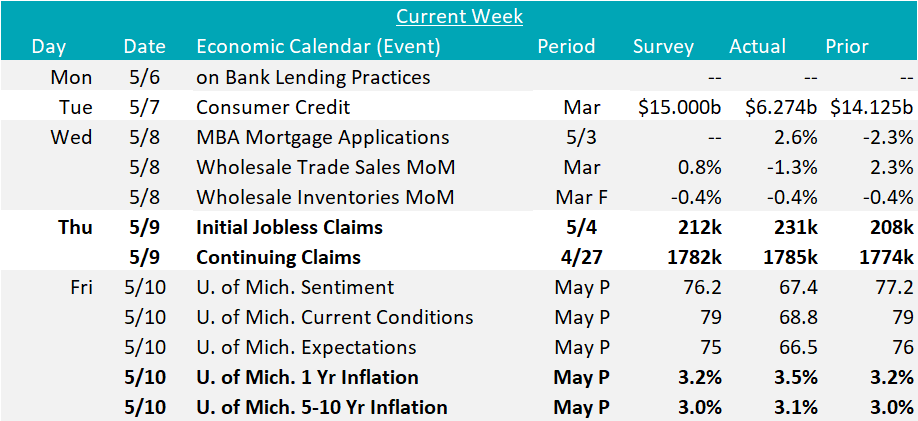
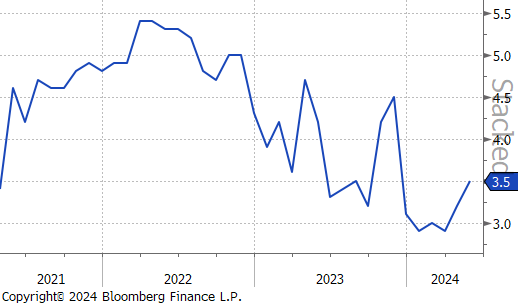
The University of Michigan Consumer Sentiment Survey is now down for 3 straight months after the May preliminary reading printed at 67.4, well below expectations of a print at 76.2. Looking more closely at the data, the 1yr Inflation Expectations reading of 3.5% versus an expected 3.2% might be the most concerning signal. Taking a step back, it’s important to recognize that consumer expectations surveys are historically not accurate predictors of inflations. That said, the significance of this decoupling in expectations should not be taken lightly and if consumers lose faith that price pressure is moving back to the FED’s target, the FOMC will need to move quickly towards more restrictive policy.
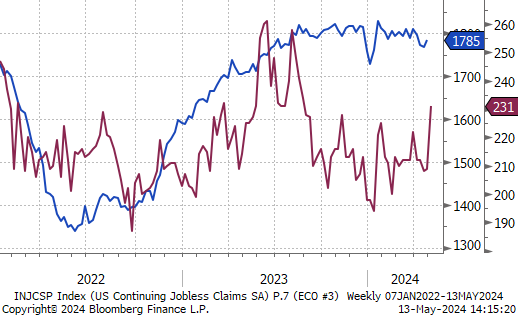
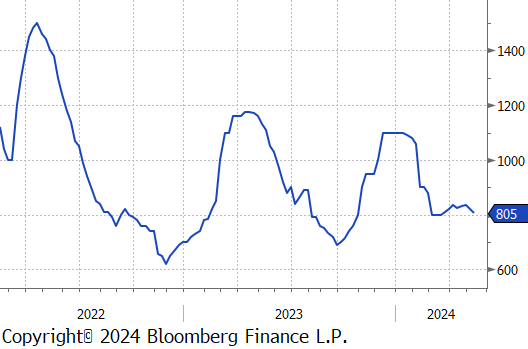
Additionally, Initial jobless claims data printed up to 231k for the week, above expectations of 212k and at their highest level since the August, last year. Continuing claims were up slightly to 1,785k versus expectations of 1,782k. Neither of these figures should sound an alarm – the threshold we are monitoring which would signify a structural problem in the labor market is if the 4-week moving average of initial claims surpasses 260k (currently at 215k).