Flack Capital Markets | Ferrous Financial Insider
May 12, 2023 – Issue #379
May 12, 2023 – Issue #379
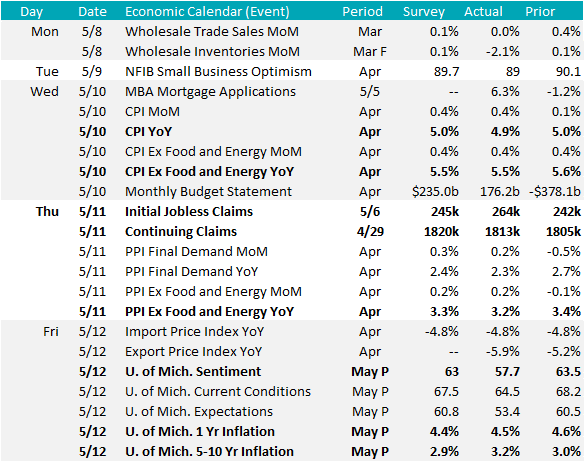
Last week, we saw promising headline numbers, but mixed underlying readings on inflation data. Unfortunately, this did not provide a clear indication for where prices are headed, making the priority of the Federal Reserve that much more complicated.
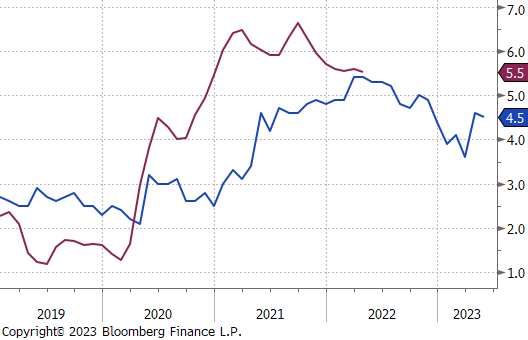
The most watch economic data point from the week was headline CPI (Consumer Price Index) inflation readings which was softer than estimates (4.9% vs 5%). Because of this, treasury yields initially fell under the assumption that rising prices were receding. However, after looking more closely, the underlying Core CPI (ex. food & energy) showed further stickiness printing at 5.5% vs. 5.5% expectations. This data continues to show that Fed’s biggest concern of entrenched inflation remains.
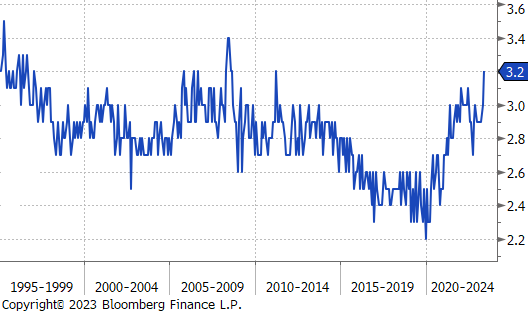
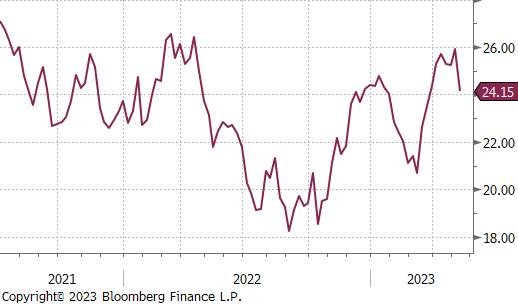
The real problem with foreseeing entrenched inflation comes from the fact that it is difficult to measure, but some of the best insight comes from the University of Michigan Consumer Sentiment Survey. Here individuals are asked their near-term and long-term inflation expectations and these figures are starting to show troubling signs. First, over the last two months, 1-yr expectations jumped higher and have remained there. The first chart on the right shows 1-yr expectations (pushed forward 12 months) versus Core CPI. As you can see, April and May data sharply reversed expectations that the current problem was receding. This was further confirmed by this month’s 5-10-year expectations, which reached a 12-year high at 3.2%.
The point of all of this is, while inflation and interest rates at current levels have caused major problems and are vastly different than what the market has been used to over the last 15 years, it is becoming less likely that the market will go back to the way things were soon, or even after the current crisis is resolved. Larger forces like deglobalization, reshoring manufacturing, and rerouting supply chains are inherently inflationary. If you do not have a longer-term plan for how your business is going to succeed while these tectonic plates redefine the future landscape, we can help.
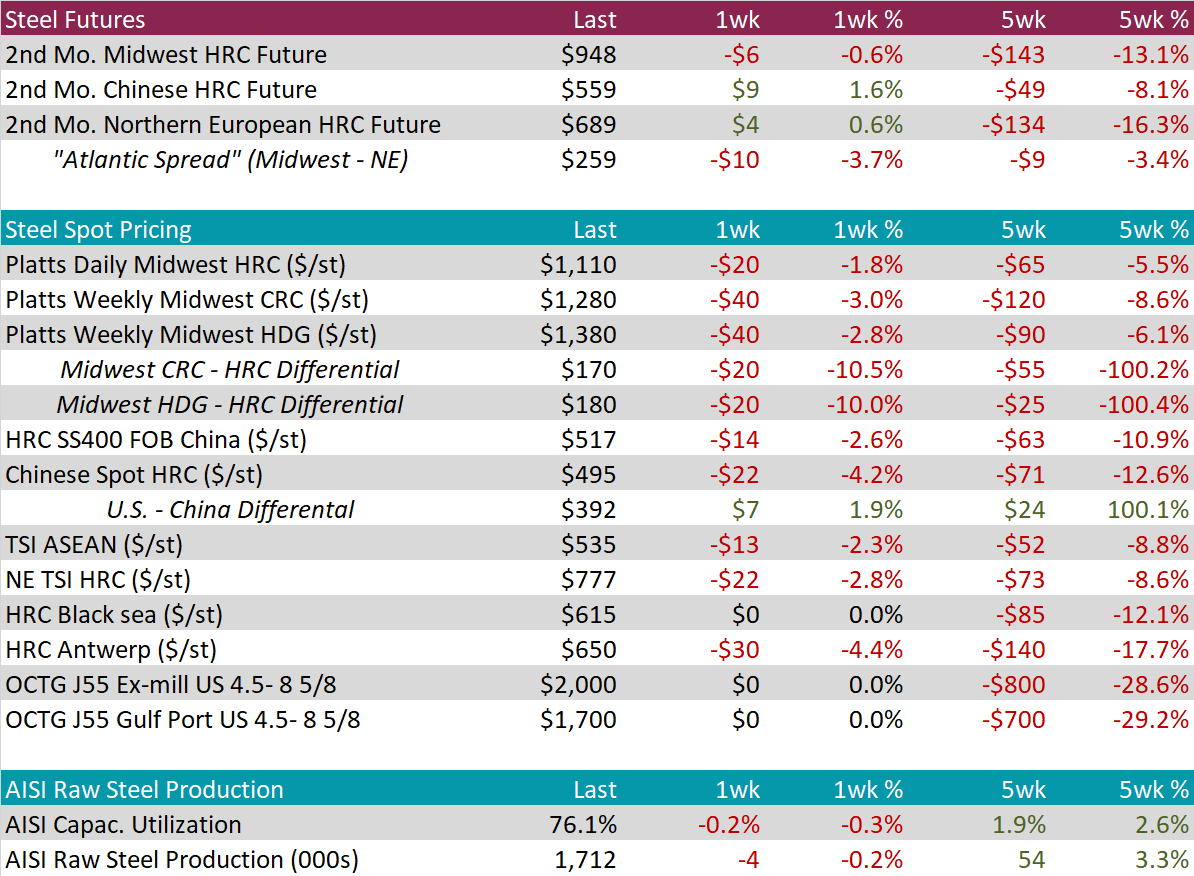
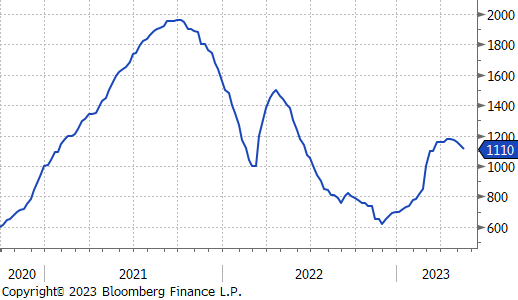
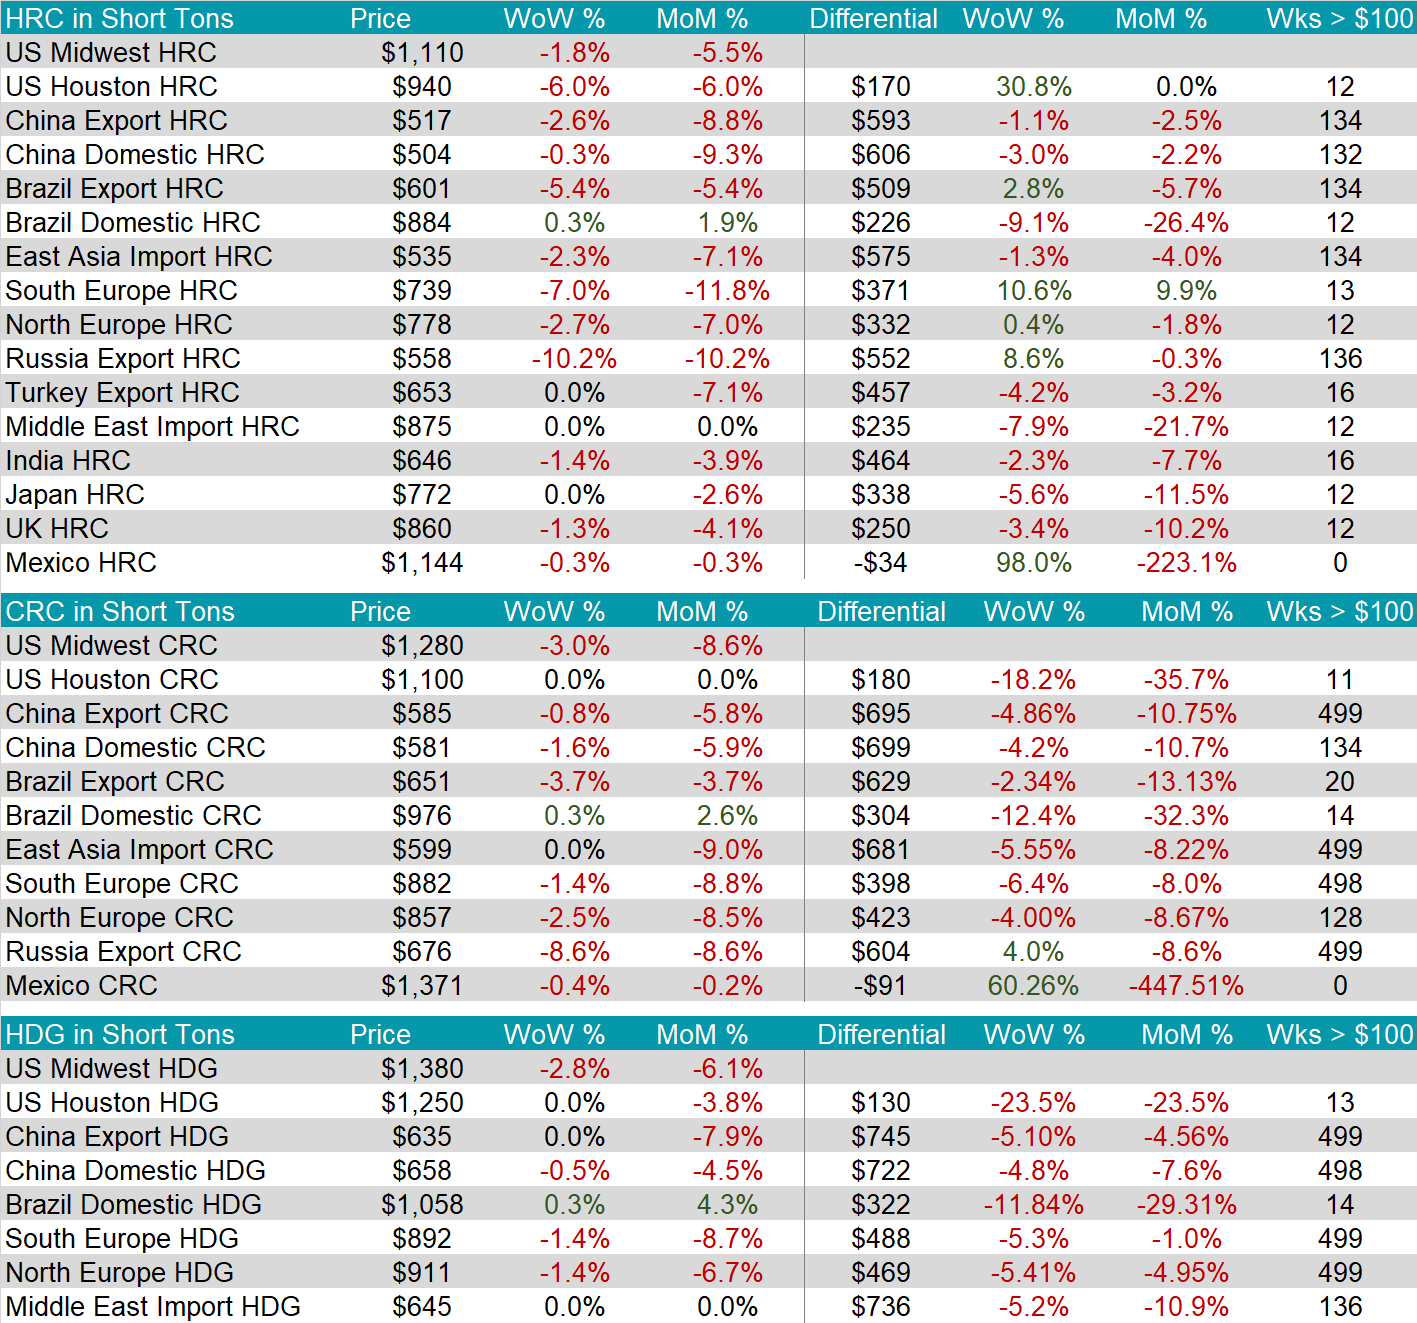
HRC spot prices continued to decline, down another $20 this week, while the 2nd month (June) future was down $6, or 0.6%. Tandem products continue to perform worse, with both CRC and HDG down $40 this week. Taking a longer-term view, this is even more pronounced, with CRC and HDG, each down $120 and $90, respectively over the last 5 weeks. This is compared to HRC which is 5.5% lower over the same period.
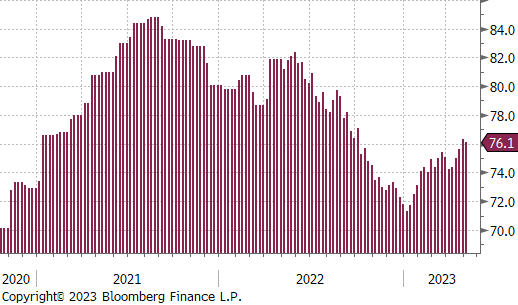
Domestic production remains elevated compared to the last 6 months; however, capacity utilization was down 0.2% to 76.1%, this week.
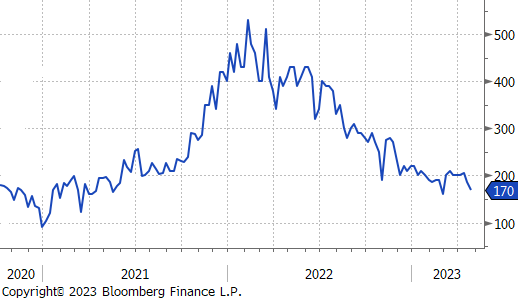
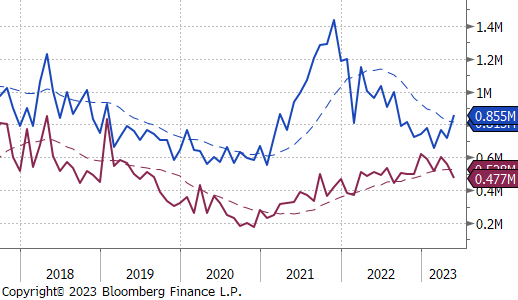
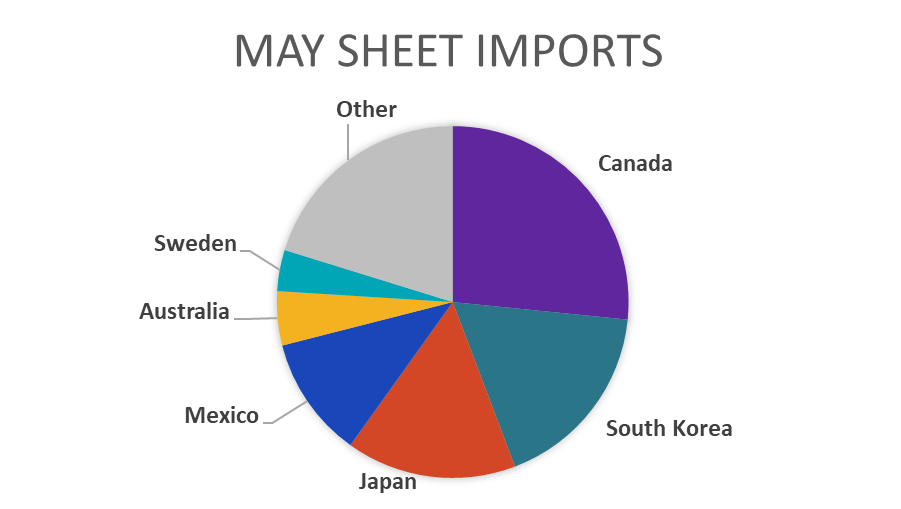
May Projection – Sheet 855k (up 140k MoM); Tube 477k (down 83k MoM)
April Projection – Sheet 714k (down 50k MoM); Tube 560k (down 41k MoM)
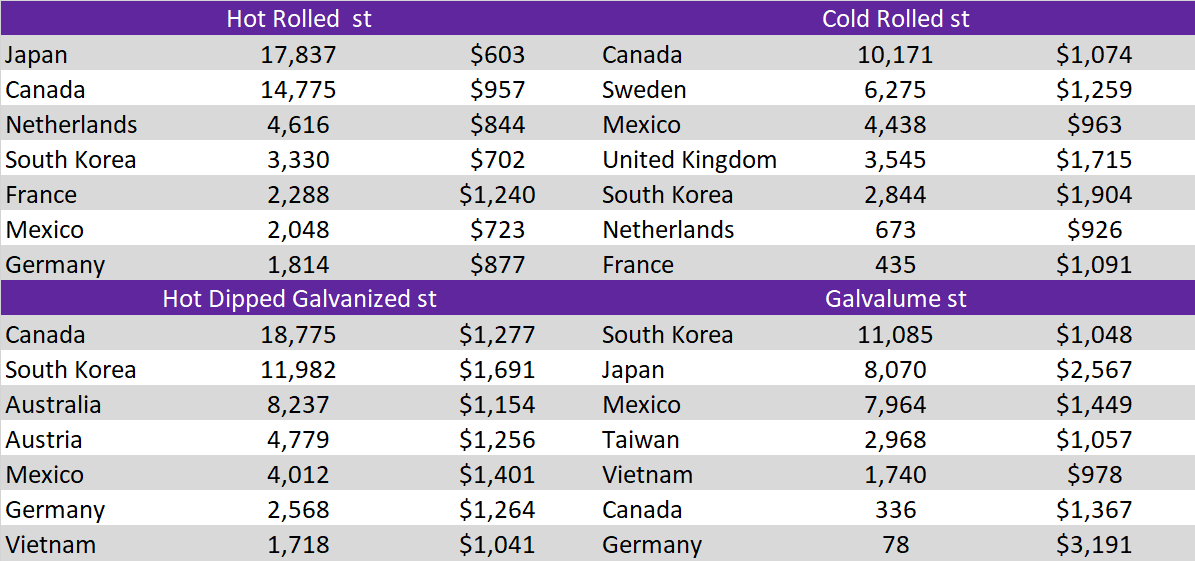
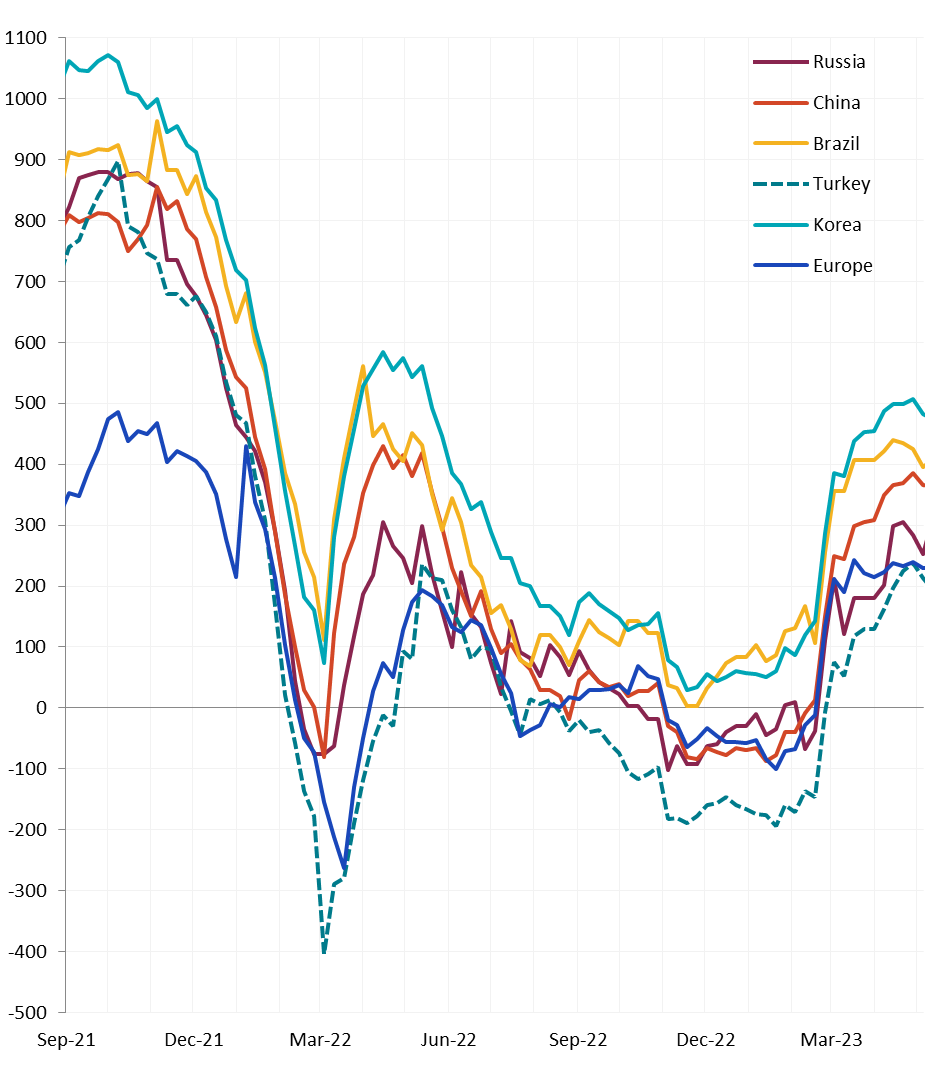
All the watched global differentials were lower last week, excluding Brazil & Europe, who saw their prices fall more significantly than U.S. domestic prices.
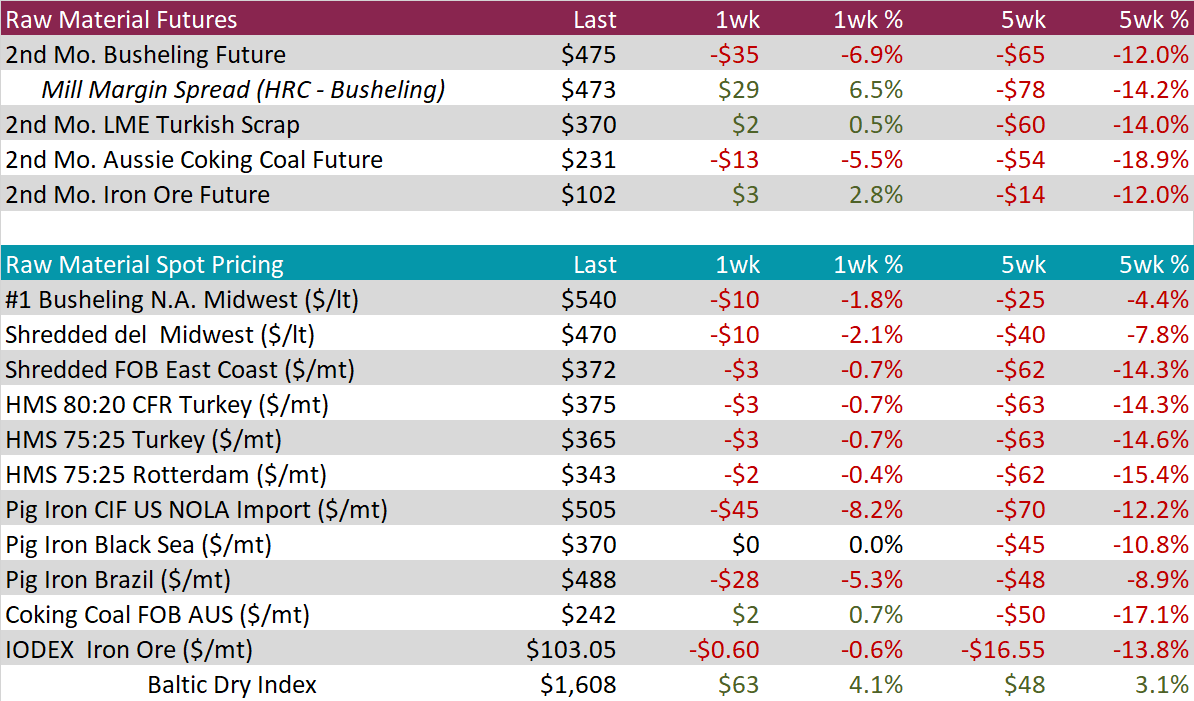
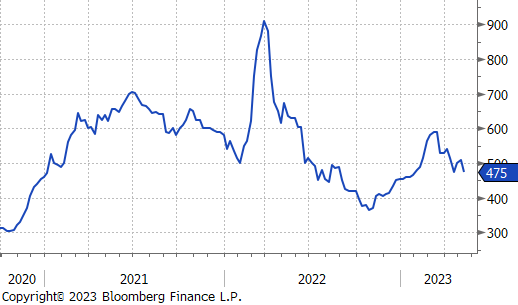
The big news from this week was U.S. domestic scrap settles. Midwest Busheling spot price was assessed down $10, after initial assumptions suggested that prime scrap would be down $40-60. However, this upside surprise did not move the futures market meaningfully higher, in fact, the 2nd month (July) future was down $35, or 6.9%.
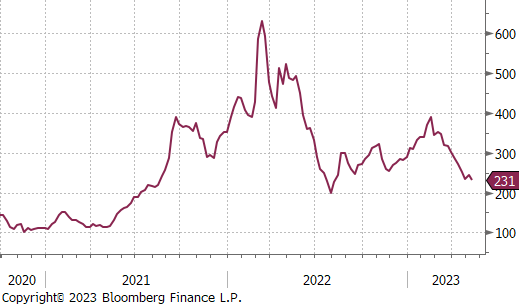
The 2nd month (June) coking coal future continued its downtrend, losing another 5.5% this week, it is now down 18.9% over the last 5 weeks.
Dry Bulk / Freight
The Baltic dry index was up $63 to $1,608 this week and remains in the same, tight, trading range.
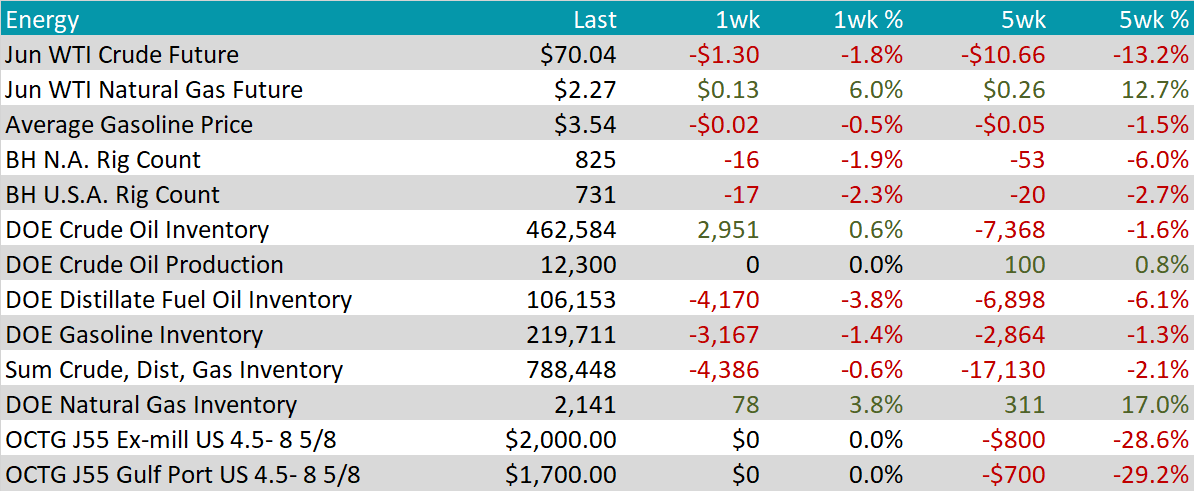
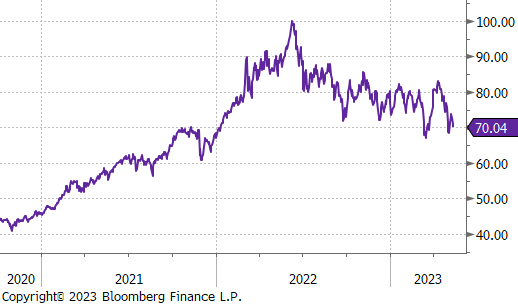
WTI crude oil future lost $1.30 or 1.8% to $70.04/bbl.
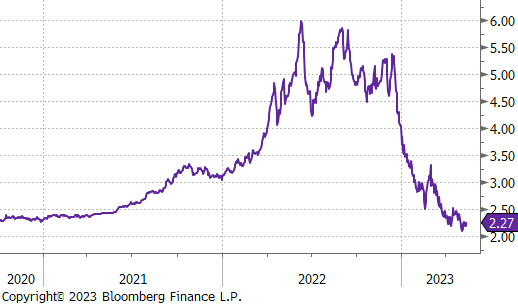
WTI natural gas future gained $0.13 or 6% to $2.27/bbl.
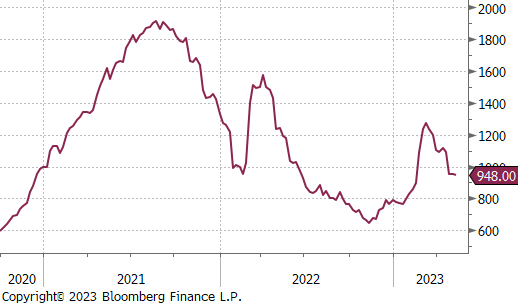
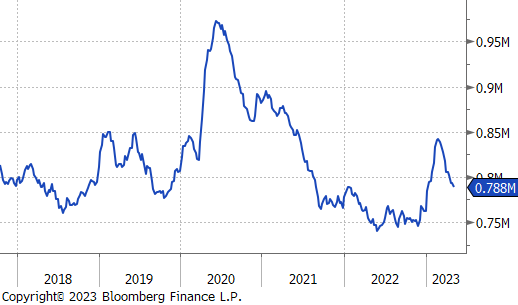
The aggregate inventory level was down another 0.6% this week, as the U.S. continues to rapid work through stock.
The Baker Hughes North American rig count was down 16 rigs. This was driven by a sharp reduction of U.S. rigs, down 17 this week. This is the first significant move lower in the U.S. count, mid-1Q of this year.
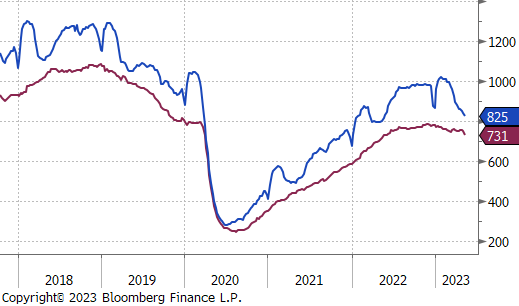
COMEX Copper experienced a substantial drop of 4% during the week, representing the most significant one-week net decline since mid-February and the largest one-week percentage decline since November 2022. Copper has witnessed declines in three out of the past four weeks, as the anticipated surge in demand for the red metal following China’s reopening has failed to materialize. Moreover, global macroeconomic uncertainties have dampened the growth prospects, further contributing to the downward trend.
LME Aluminum futures fell for the third consecutive week in tandem with Copper and other metals. Weak China data and fears that Russian aluminum makes up majority of LME stocks is weighing down the price of the metal used in everything from beer cans to automobiles.
Silver futures experienced a significant decline of 6.8% during the week, surpassing the drops seen in gold and other industrial metals. This represents the most substantial weekly percentage change since mid-March when silver futures soared by over 9%, and it marks the largest weekly percentage decline since October 2022. The decrease may be attributed in part to profit-taking by money managers, who had maintained their most bullish position in 16 weeks according to CFTC data reported until Tuesday, May 9th.

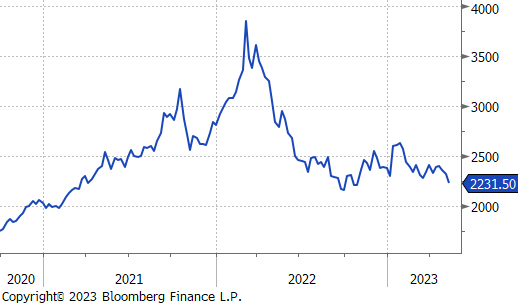
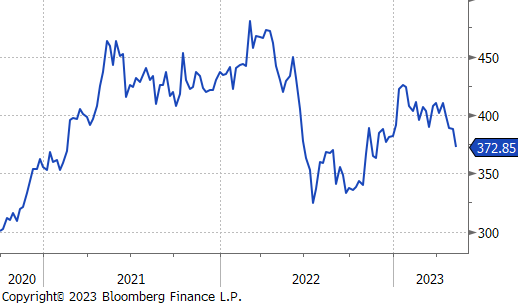
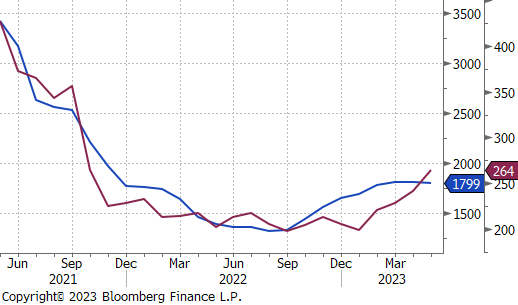
Outside of inflation data, labor statistics were the most closely watch releases from the week. Here we saw initial jobless claims jump to their highest level since October 2021, while continuing claims tapered off. The current divergence between the two trends further highlights the push-pull dynamic that is causing the labor market to outperform expectations because individuals filing jobless claims are quickly finding new positions. This continues to show the strongest signal that the economy is resilient. The current pace of initial and continuing claims is well below where it needs to be to dampen inflationary pressure.
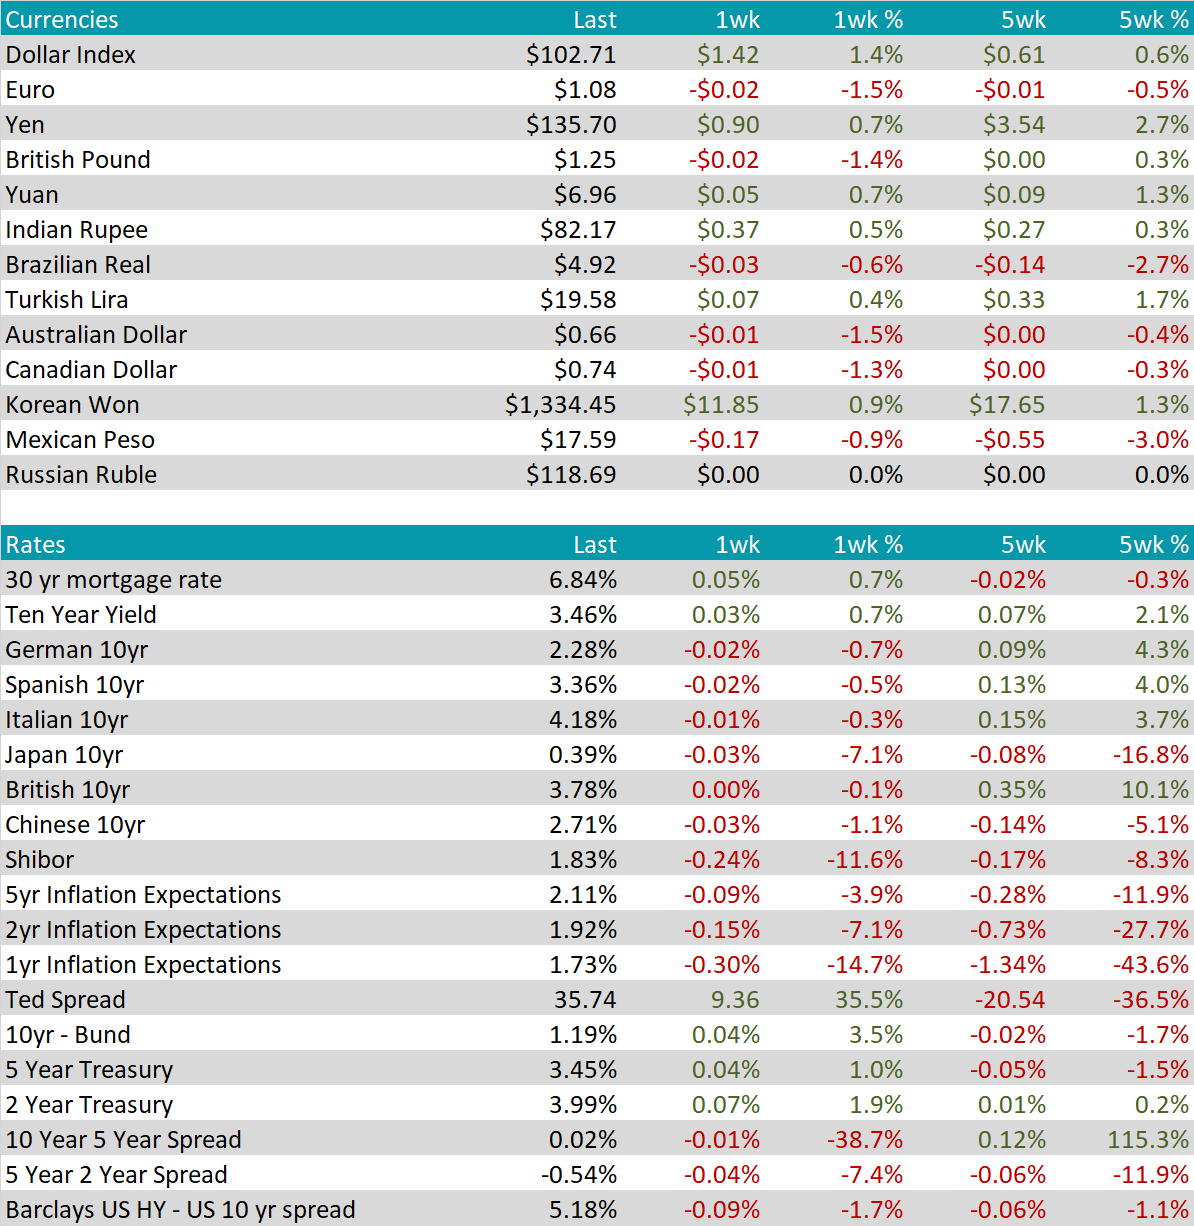
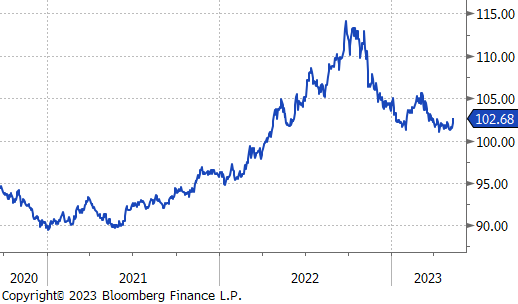
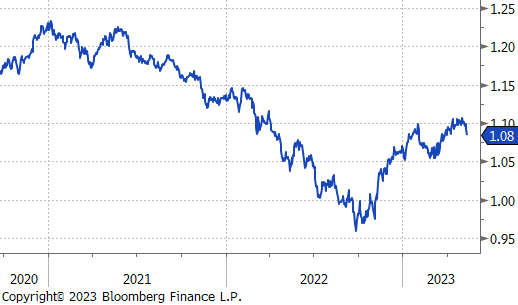
This U.S. Dollar gained $1.42 to $102.71 this week, after a prolonged downtrend beginning March. The Euro displayed weakness against the USD, reaching a three-week low below 1.09. Initially, the Euro had rallied in response to lower-than-expected US inflation data. The primary driving force this week was the prevailing concerns regarding global growth. As a result, investors sought safety in the USD. Presently, the market anticipates the European Central Bank to proceed with rate hikes throughout the summer, while the US Federal Reserve is expected to pause its actions.
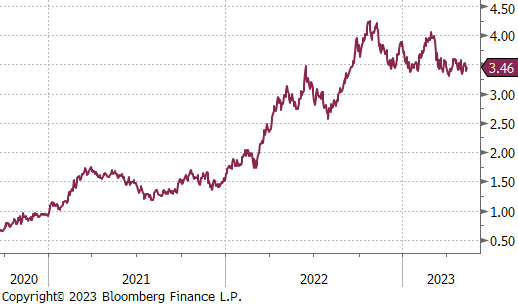
Prices for US treasury notes have experienced significant fluctuations, but yields have generally remained around the 3.4% mark for the 10-year Treasury yield. Given the ongoing prominence of the regional bank crisis, debt ceiling standoff, and upcoming FOMC decisions in the headlines, we expect continued volatility in treasury note yields.
