Flack Capital Markets | Ferrous Financial Insider
May 17, 2024 – Issue #432
May 17, 2024 – Issue #432
Overview:
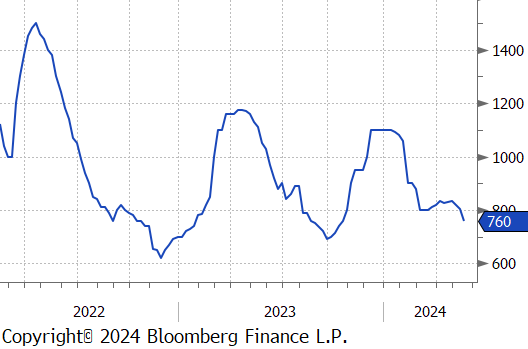
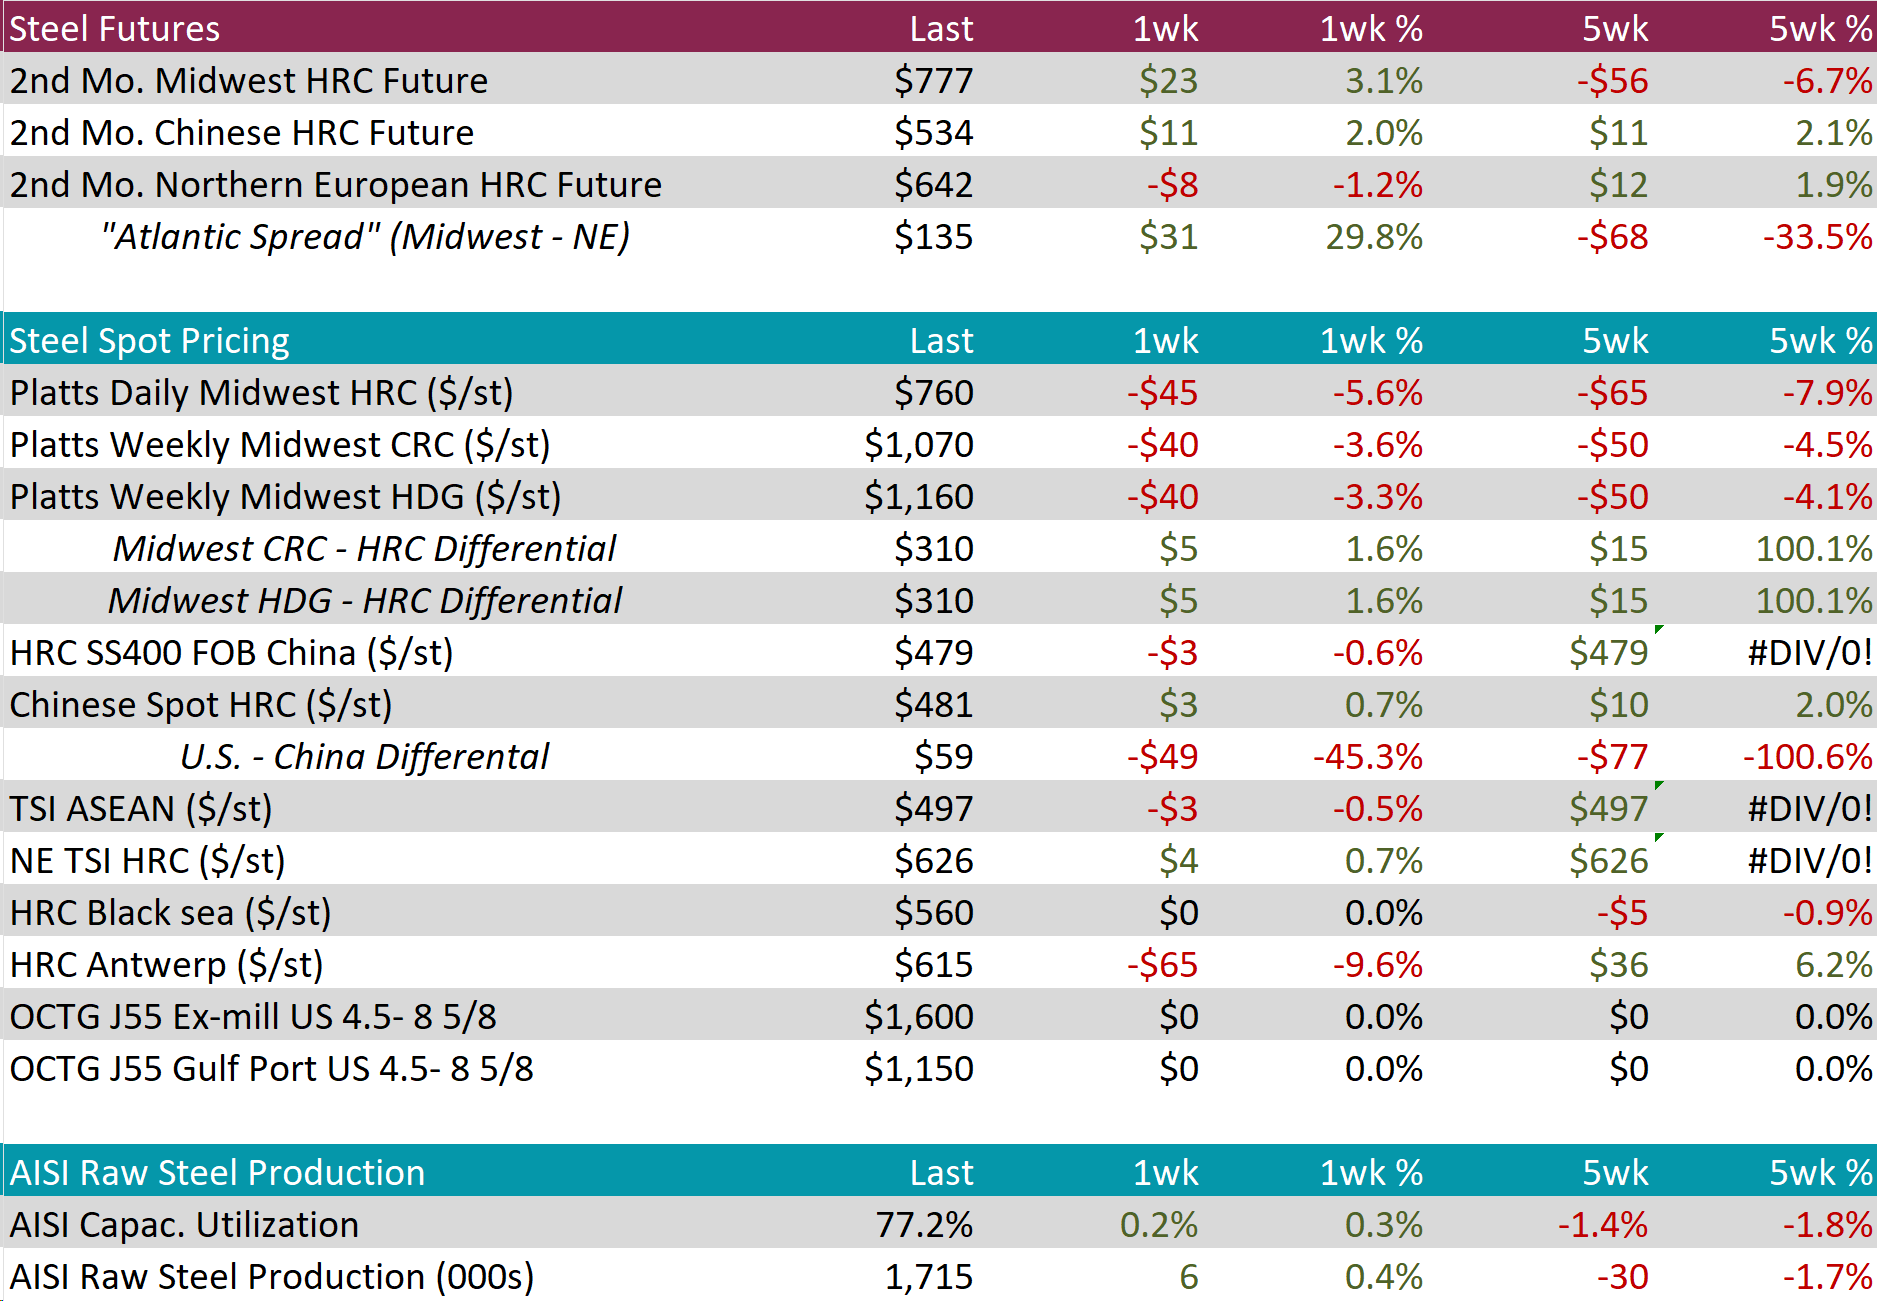
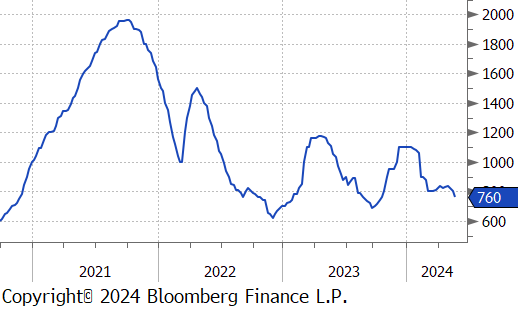
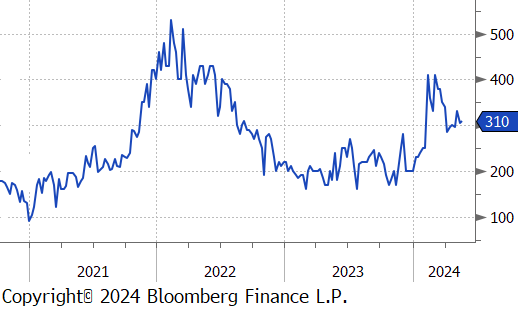
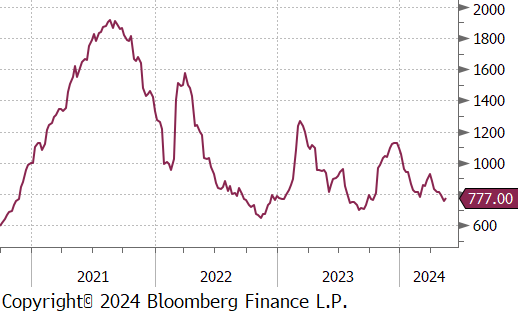
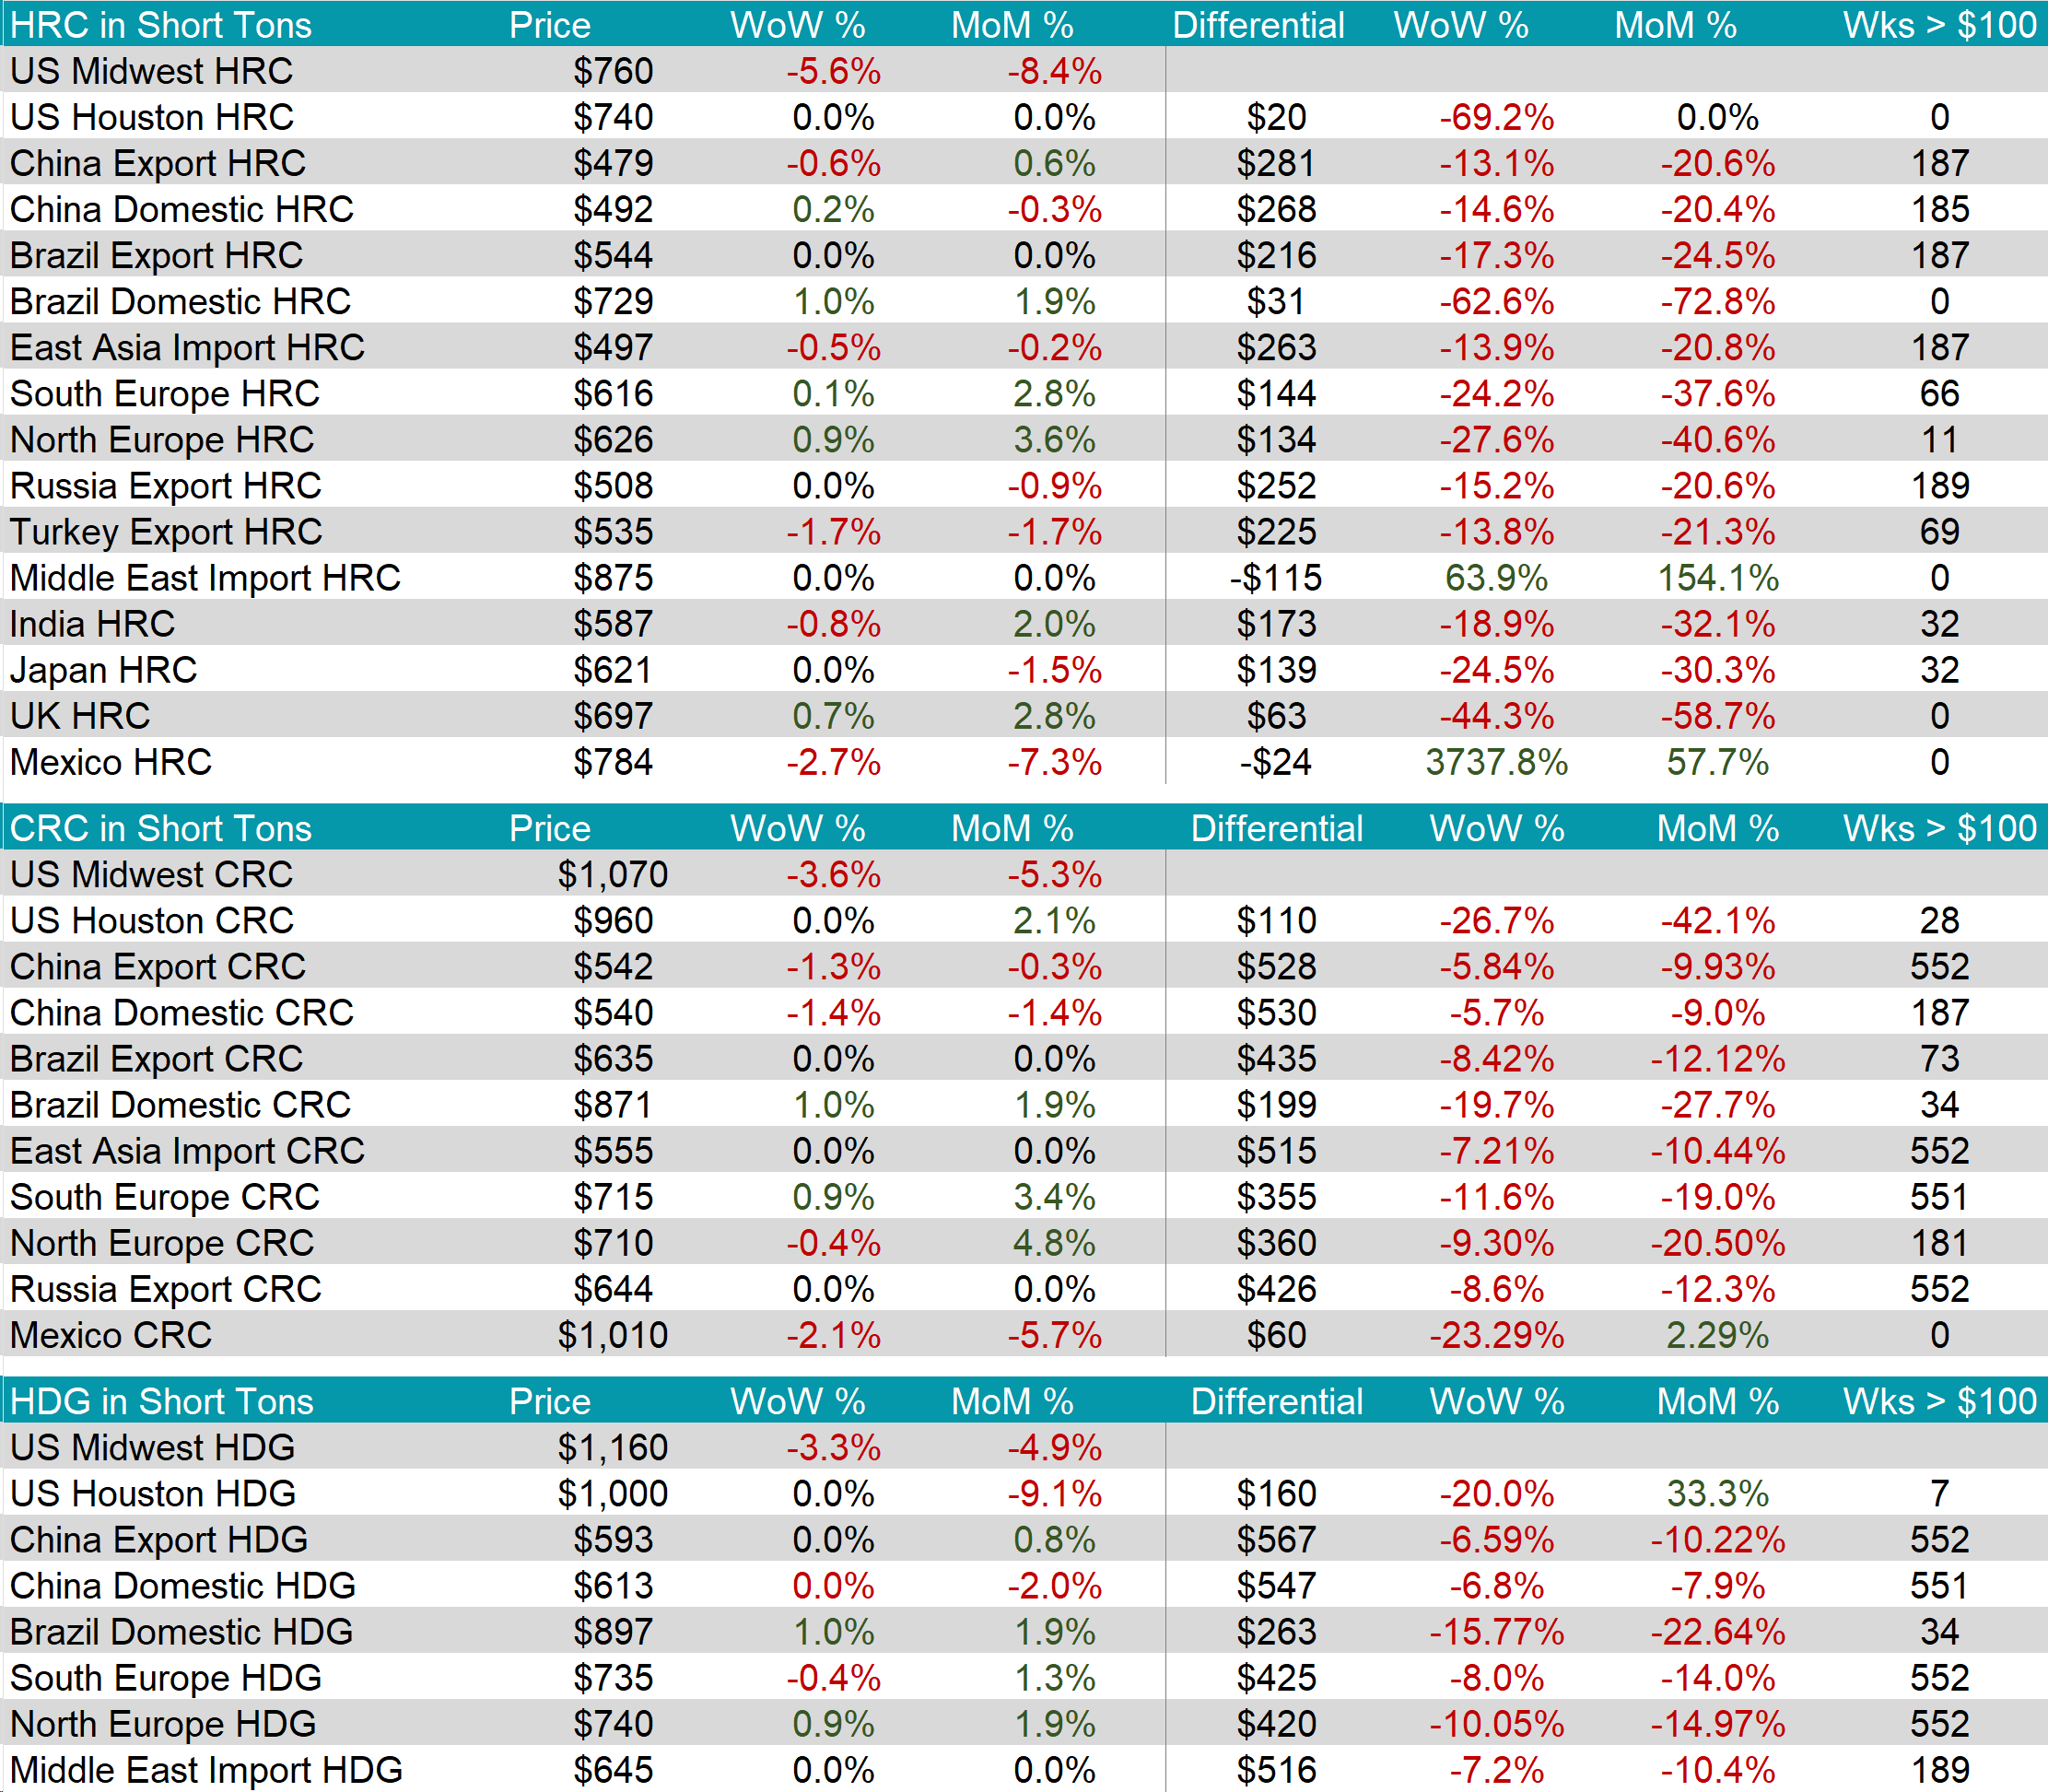
The HRC spot price dropped by $45 or -5.6% to $760. At the same time, the 2nd month future rose by $23 or 3.1% to $777, marking its first price increase in seven-weeks.
Tandem products both fell by $40, resulting in the HDG – HRC differential to rise by $5 or 1.6% to $310.
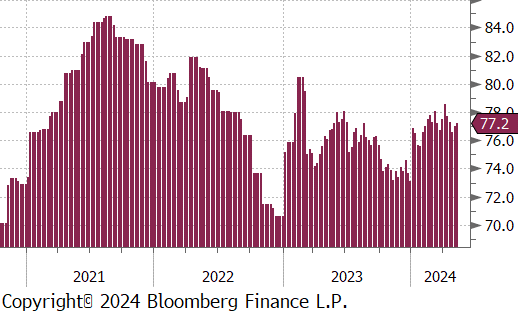
Mill production continued to inch back up, with capacity utilization ticking up by 0.2% to 77.2%, bringing raw steel production up to 1.715m net tons.
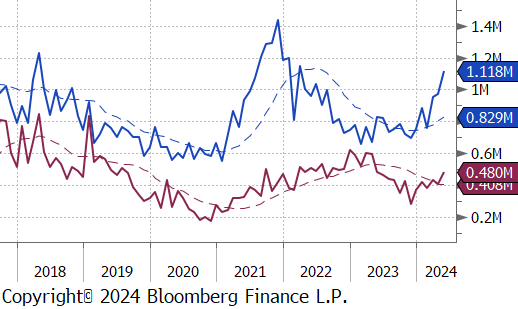
May Projection – Sheet 1118k (up 145k MoM); Tube 480k (up 74k MoM)
April Projection – Sheet 973k (up 17k MoM); Tube 406k (down 29k MoM)
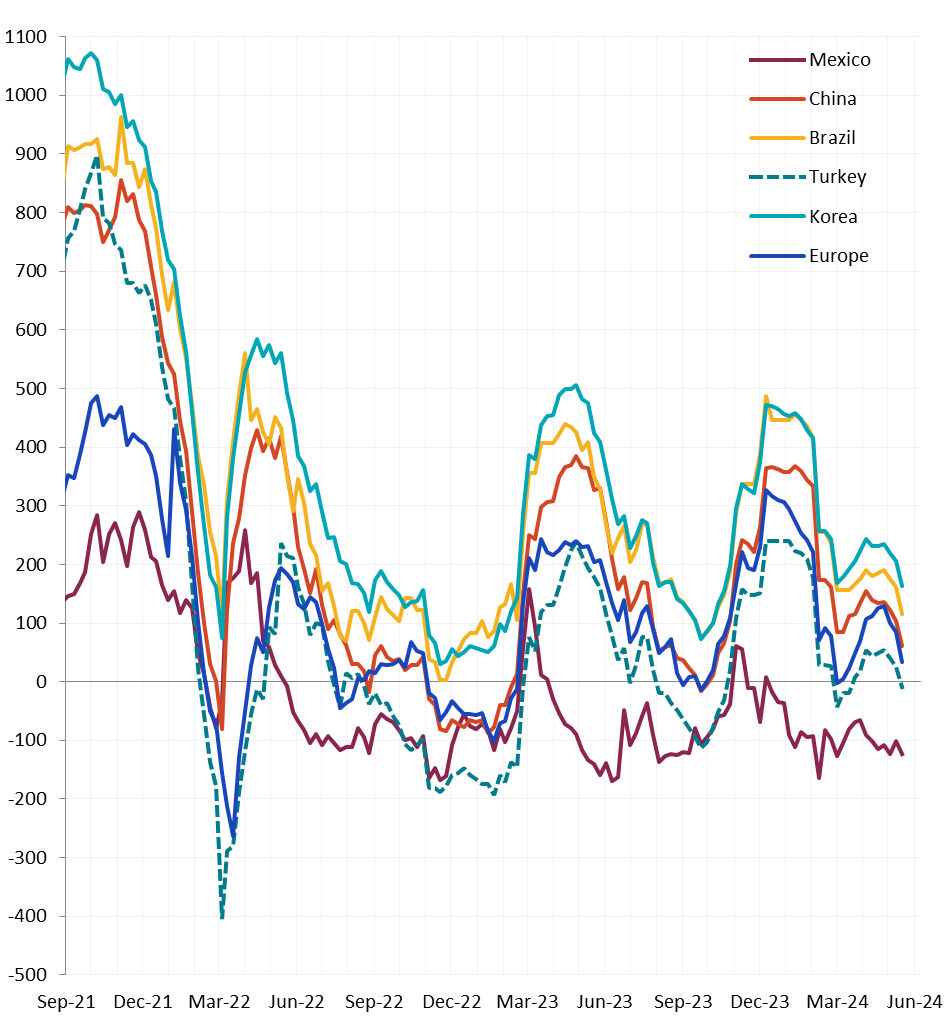
All watched global differentials contracted, except for Mexico, which HRC experienced a -2.7% decrease. Meanwhile, the Turkey Export HRC fell by -1.7% and Brazil Domestic HRC rose by 1.0%.
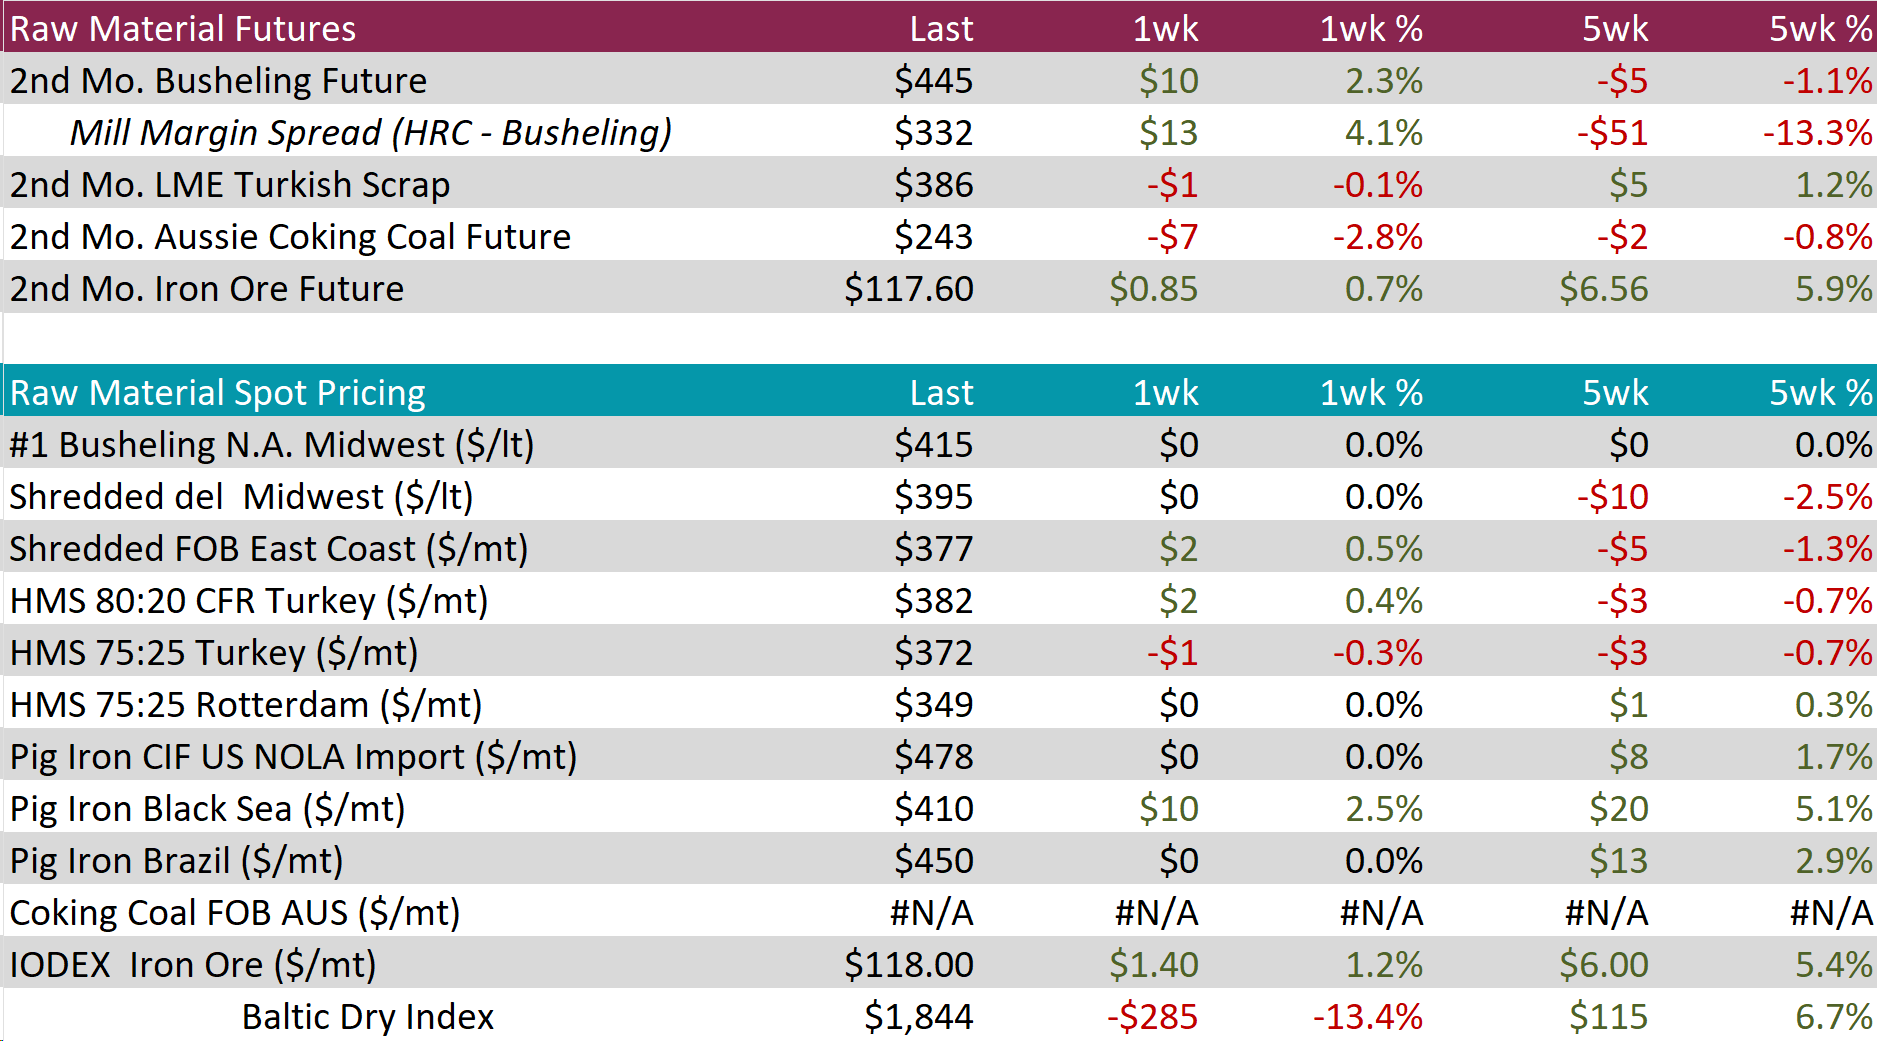
Scrap
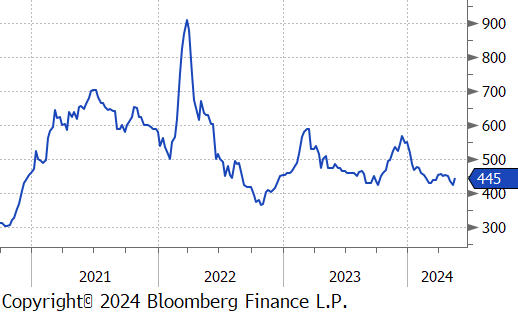
The busheling 2nd month future rose by $10 or 2.3% to $445, marking the first price increase in four-weeks.
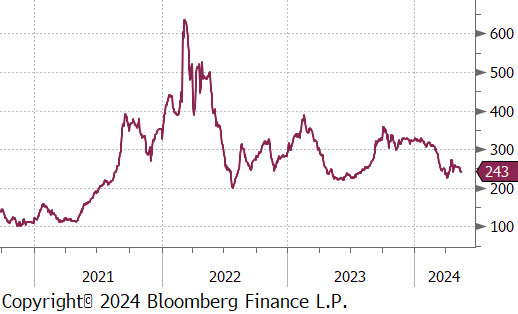
The 2nd month Aussie coking coal future fell by $7 or -2.8% to $243, hitting the lowest price in six-weeks.
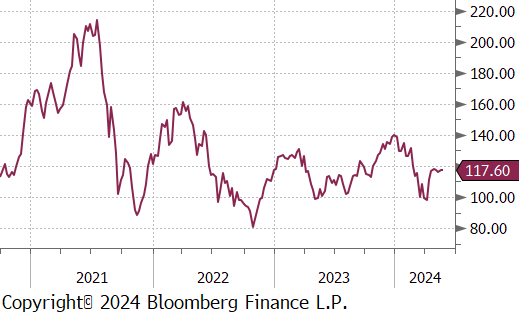
The 2nd month iron ore future edged up by $0.85 or 0.7% to 117.60, reaching the highest price in eight-weeks.
Dry Bulk / Freight
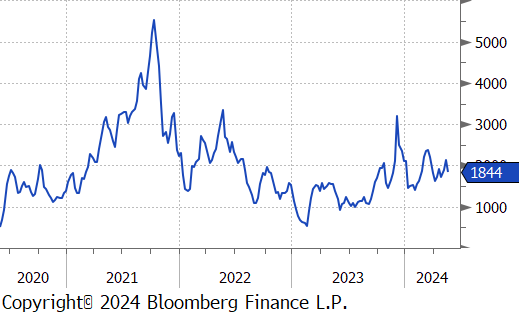
The Baltic Dry Index declined by $285 or -13.4% to $1,844, retreating from last weeks recent price high.
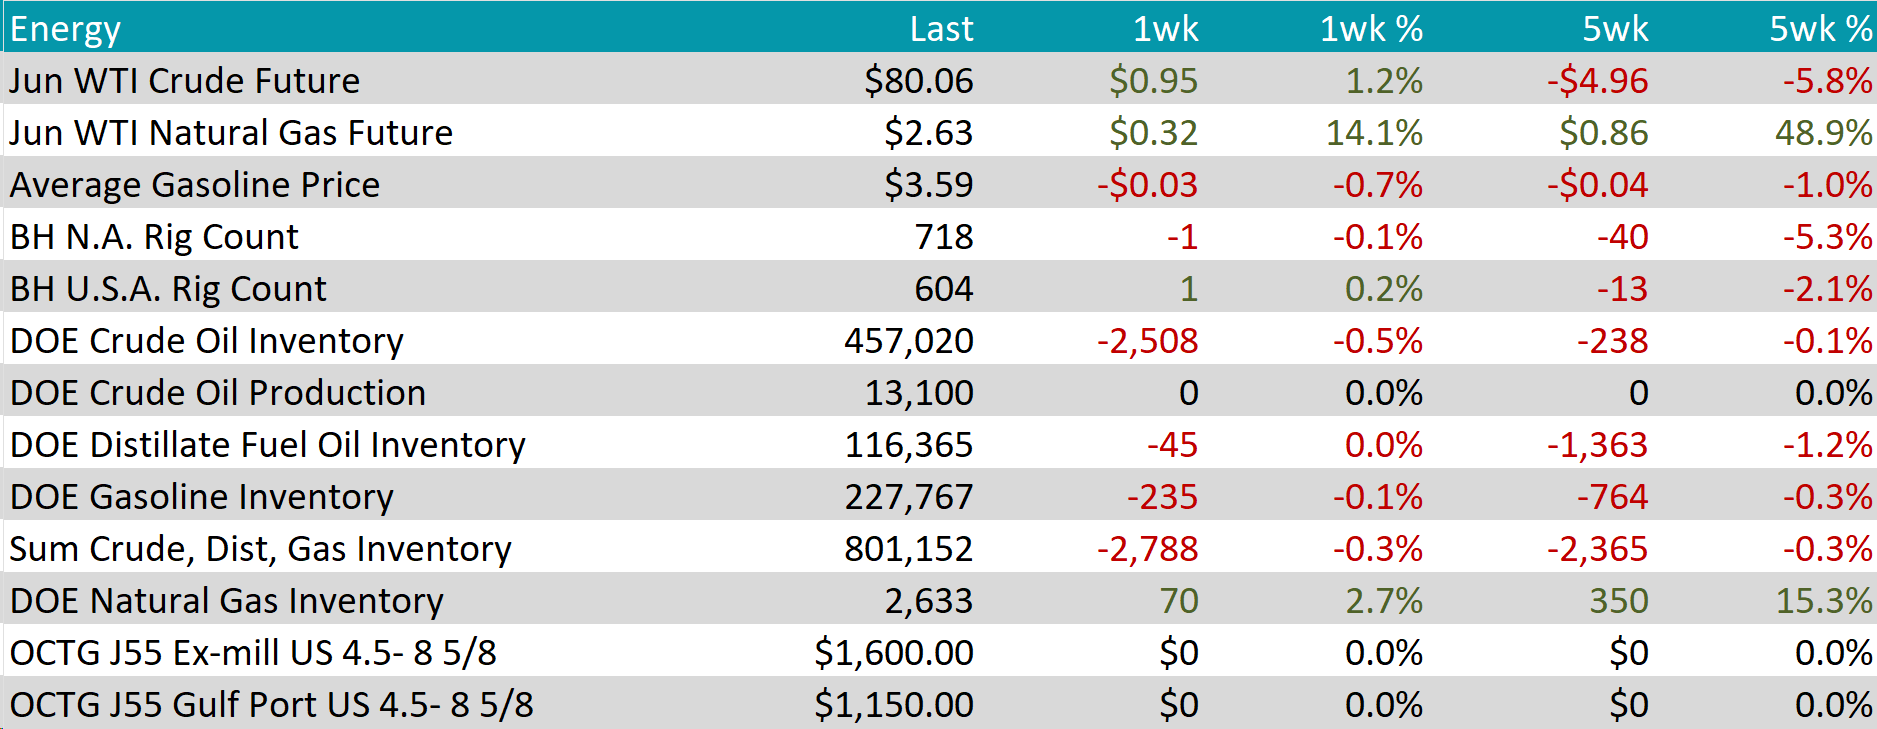
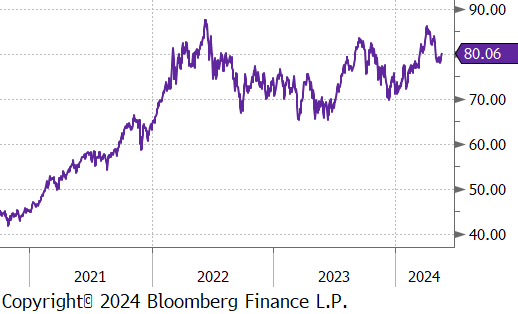
WTI crude oil future gained $0.95 or 1.2% to $80.06/bbl.
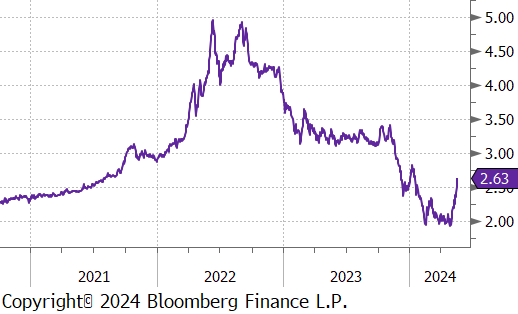
WTI natural gas future gained $0.32 or 14.1% to $2.63/bbl.
The aggregate inventory level experienced a slight decline of -0.3%.
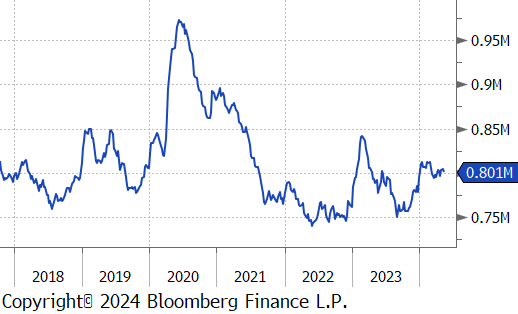
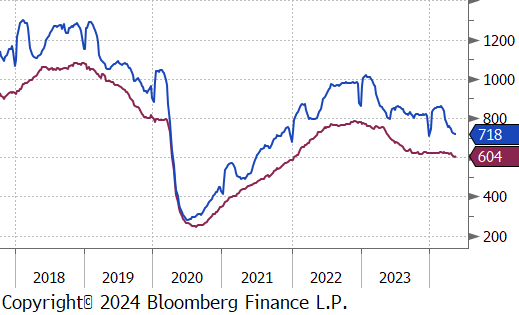
The Baker Hughes North American rig count had a slight reduction of 1 rig, bringing the total count to 718 rigs. At the same time, the US rig count grew by 1 rig, bringing the total count to 604 rigs.
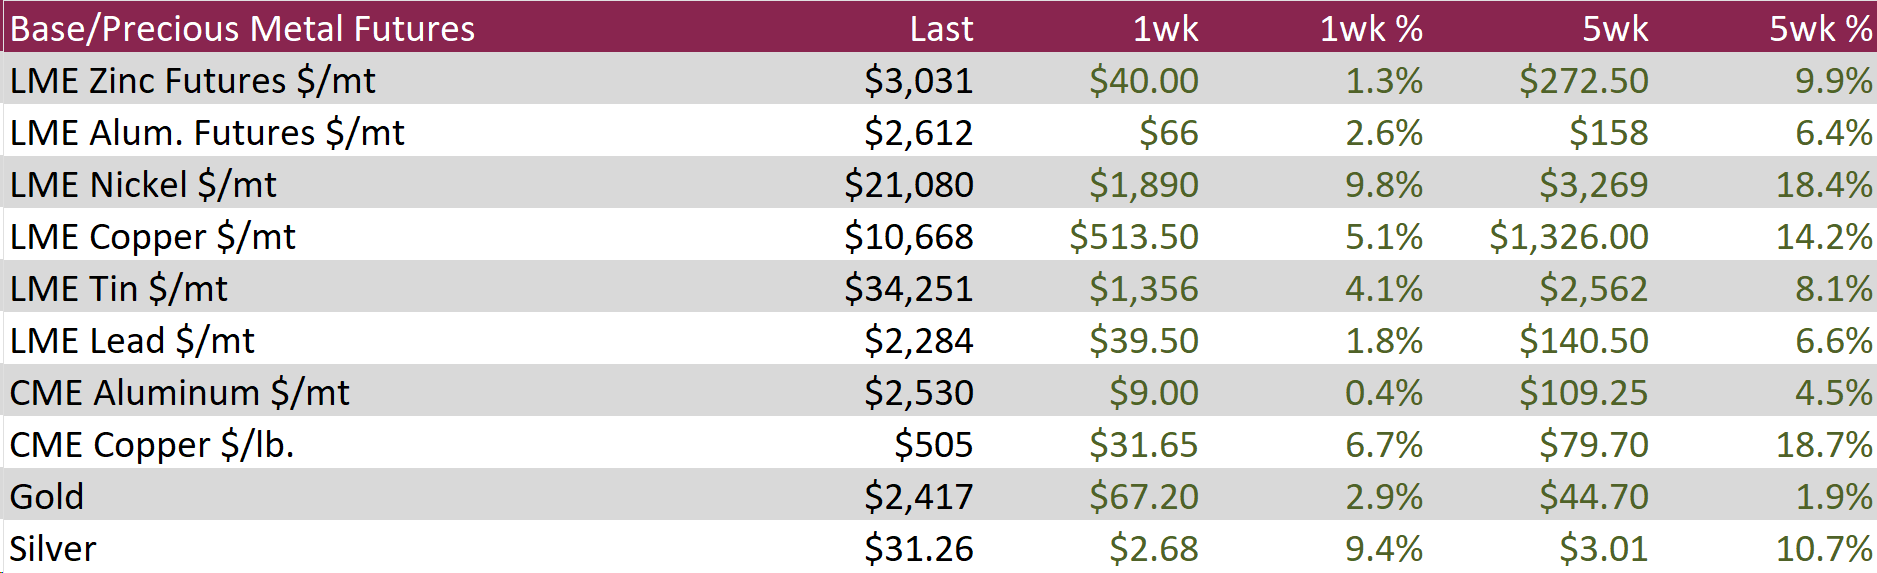
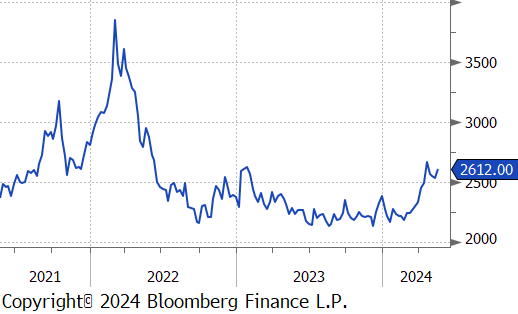
Aluminum climbed by $66 or 2.6% to $2,612, nearing the previous two-year high of $2,670. This rise was buoyed by substantial gains across other base metal markets and ongoing adjustments in the market due to sanctions affecting aluminum trade. Notably, on-warrant LME stocks at Port Klang significantly decreased following the May 15th delivery deadline, reversing the previous increase in available tonnage from May 9th. This sharp drop in the Malaysian warehouse stocks is attributed to trading giants exploiting new contract rules after the US and UK imposed sanctions on Russian aluminum, creating availability challenges for clients restricted to purchasing specific non-Russian aluminum contracts. Additionally, concerns about potential disruptions in hydroelectric power production in Yunnan, a major Chinese aluminum-producing region due to uncertain weather conditions, further contributed to the price support.
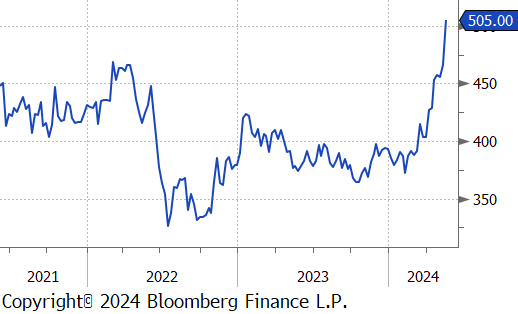
Copper continued to soar, reaching $509, amid strong demand expectations and concerns over tight supplies potentially leading to shortages. In response to a housing surplus and to prevent defaults among distressed developers, the Chinese government has decided to purchase unsold housing inventories. This measure complements an economic stimulus of 1 trillion CNY through long-term bond issuance this year, predominantly targeted at infrastructure projects. Such initiatives are expected to boost copper consumption, which is crucial for electrification projects including grid-scale energy storage and data center infrastructure. Meanwhile, limited copper availability is restricting output capabilities for Chinese smelters, who account for more than half of the global supply. With the high costs associated with launching new mining projects, major mining companies are opting for mergers and acquisitions over new ventures, highlighted by BHP’s renewed bid to acquire Anglo American.
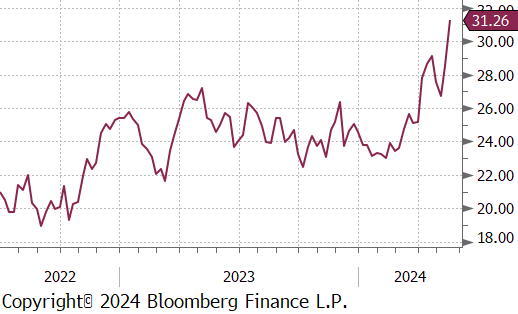
Silver increase by $2.68 or 9.4% to $31.26, marking their highest level since December 2012 and bringing year-to-date gains to nearly 33%. This surge is partly due to the bullish trend in the gold market, fueled by expectations that the Federal Reserve may begin cutting interest rates as soon as September. The precious metal’s status as a safe-haven asset has also been reinforced following the potential escalation of geopolitical tensions in the Middle East, sparked by the deaths of Iranian President Ebrahim Raisi and Foreign Minister Hossein Amirabdollahian in a helicopter crash. Additionally, silver’s demand is bolstered by its critical role in the production of solar panels, which are anticipated to reach record usage this year, likely leading the silver market into its fourth consecutive year of deficit.
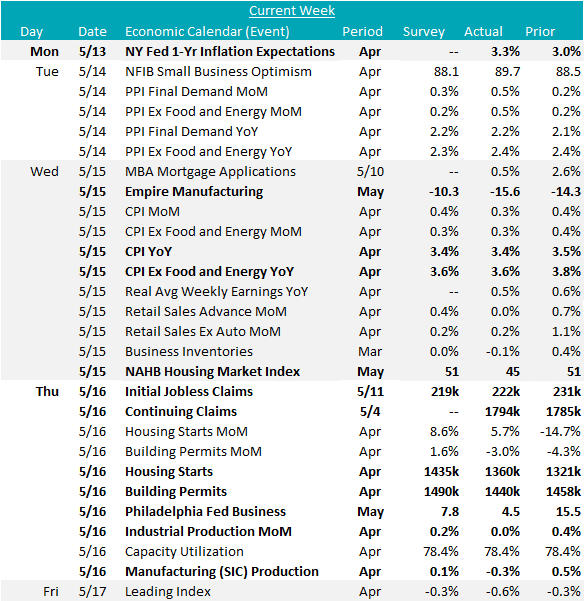
Early in the week, the NY FED 1yr inflation expectations consumer survey echoed the sentiment from the U of Michigan survey with a signal that there is less confidence in the disinflationary trend, with the reading increasing from 3% to 3.3% in April. Core PPI (ex. food & energy) also came in unchanged at 2.4%, above the expected 2.3% print. The Core CPI print calmed some of these nerves, coming line with the expected 3.6% print, marking the lowest core level since April 2021.
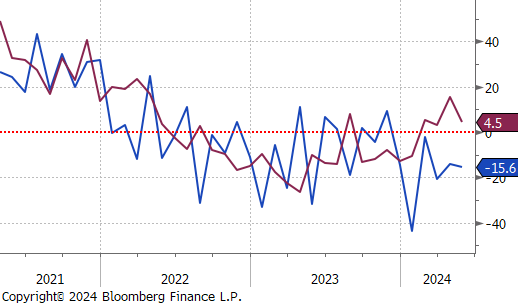
Manufacturing data largely disappointed this week, with the May Empire and Philadelphia Fed Manufacturing Surveys both below expectations, -(15.6 v -10.3), and (4.5 v 7.8), respectively. Even with the disappointment, it should be noted that Philly has been in expansion territory for 4 straight months. MoM industrial production also came in below expectations, printing 0%, v 0.2%. This was largely driven by manufacturing production – the largest component of the index – which was down -0.3% v 0.1% expected.
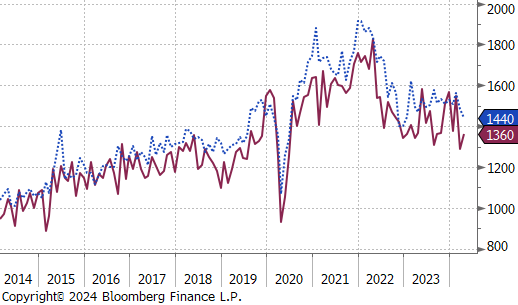
The housing sector also came in soft, with the May NAHB Housing Market Index down for the first time since November. Building permits decreased in April, -3% versus an expected 1.6% increase, while housing starts increased, but not as significantly as forecasters anticipated, up 5.7% versus 8.6%. The drag in housing is likely the result of a steady increase in mortgage rates from early-March, through the end of April.
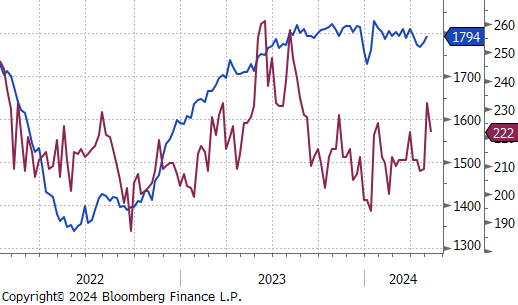
Finally, after last week’s surprising surge, initial jobless claims cooled, down to 222k, slightly above the expected 219k. This brings the 4-week moving average up to 218k, well below the threshold of 260k – the threshold we referenced last week as a level of distress.