Flack Capital Markets | Ferrous Financial Insider
May 19, 2023 – Issue #380
May 19, 2023 – Issue #380
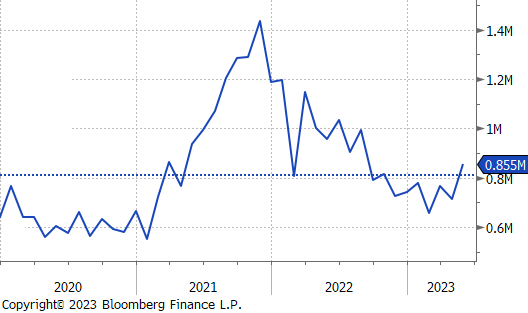
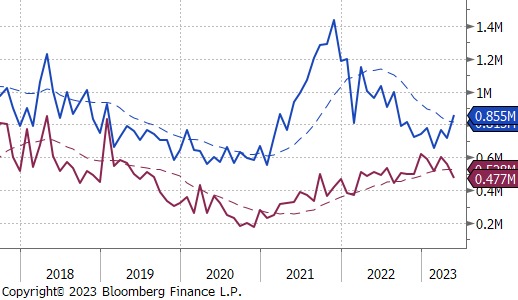
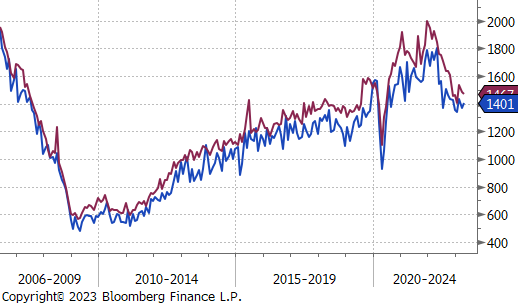
Ever since global differentials turned positive in early February, we have been closely monitoring what the reaction of imports would be. This is especially significant given the clear downtrend in HRC prices domestically and abroad. Now that we have a few weeks of May data, an uptick of orders were placed, as arrivals are coming in at an elevated level 855k tpm, the highest since August. For additional context, the blue dotted line represents the average monthly rate of imports between when 232 was enacted and before COVID-19 shutdowns. We view this level as “normal.”
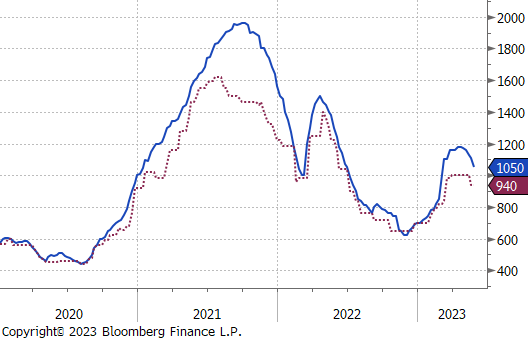
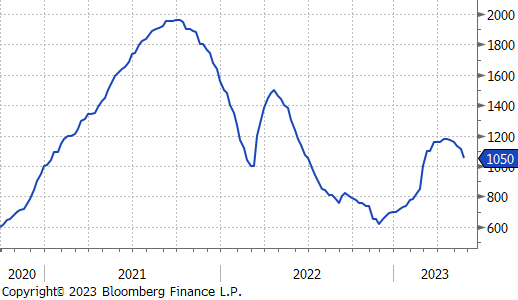
Taking a step back, the most significant risk of rising levels of imports occurs after the balance of inventory is pushed into a surplus but delayed shipments continue to arrive. Much like a recession, this becomes clear in hindsight. However, as we look forward to what the downside move in domestic HRC prices could look like, and where the potential floor will be, one of the key data points is the Houston price. There is a clear relationship between Houston and the Midwest prices, as imports fall, the two diverge, and as they rise, the spread collapses. Last week, the Houston price was down $60 to $940.
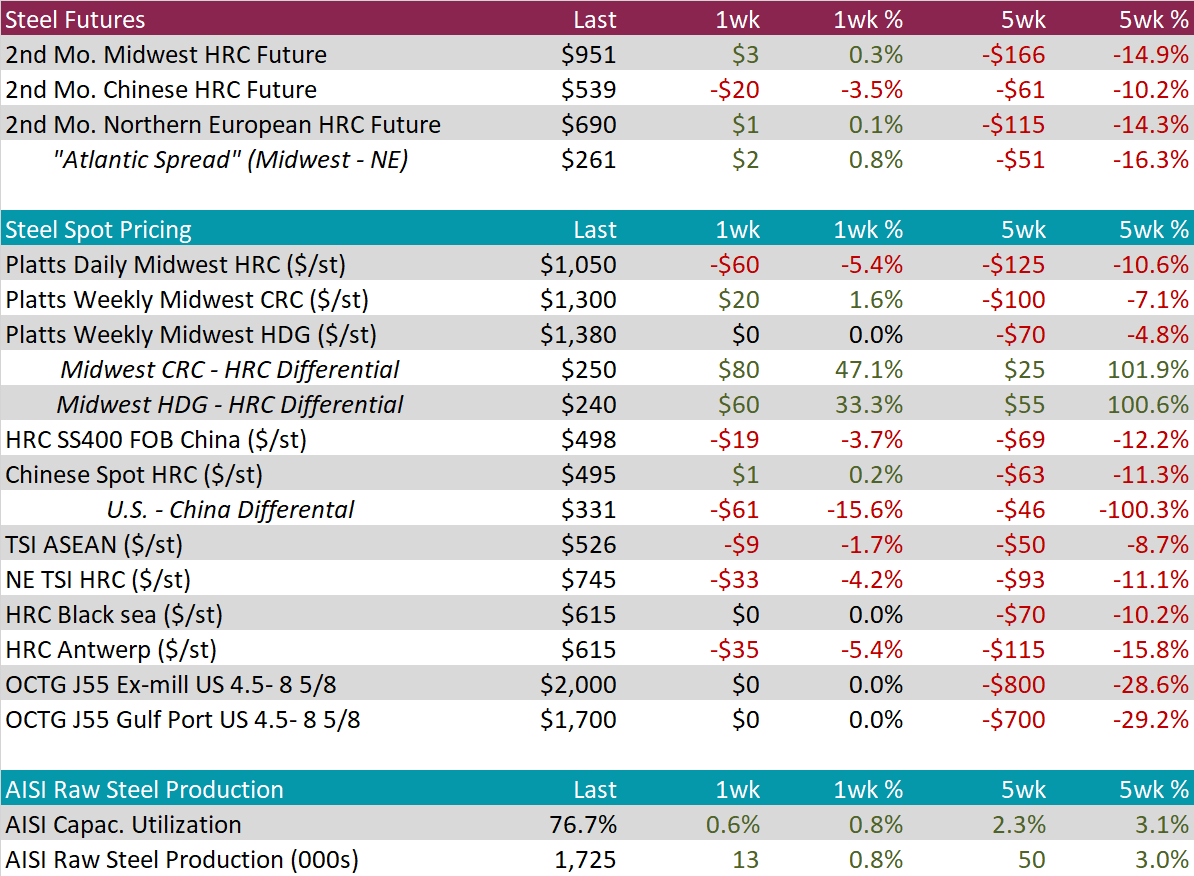
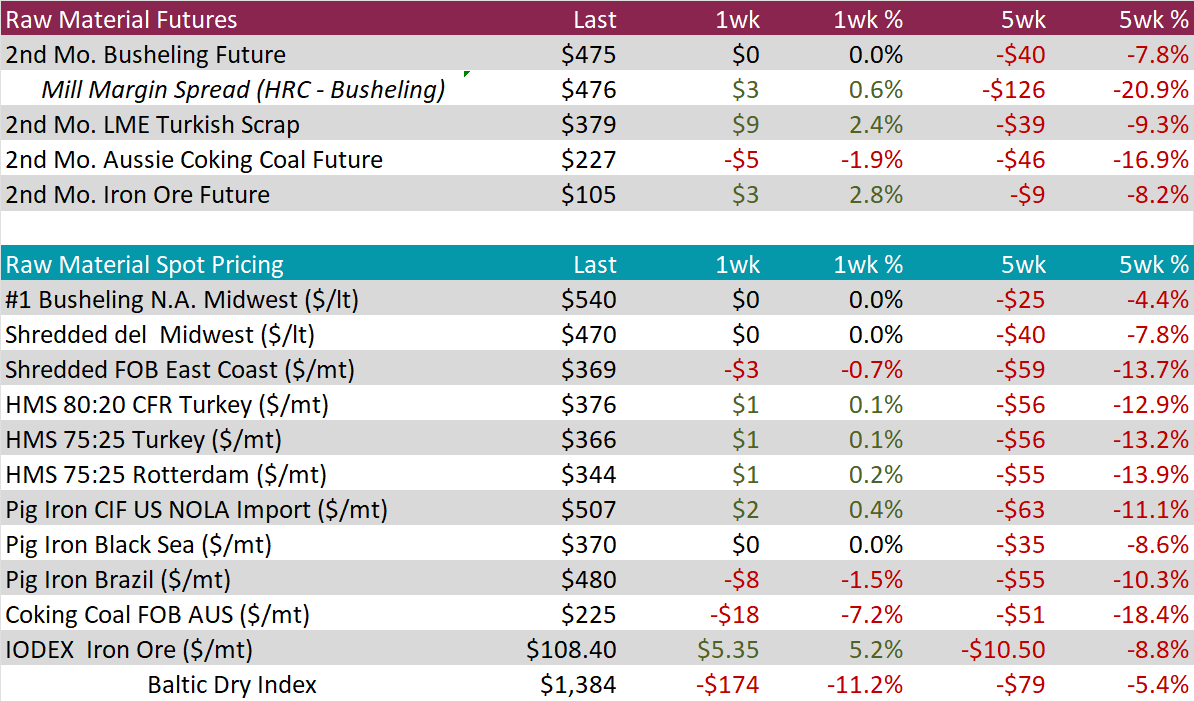
The HRC spot price was assessed sharply lower this week, down $60 or 5.4%. The increased pace of this week’s down move was nearly doubled the 5-week stretch prior, where the price was down $65 over the entire stretch. The futures market was relatively quiet again last week, with the 2nd month future (June) up $3. The gap between the spot price and second month future continues to be remarkably high, at $99.
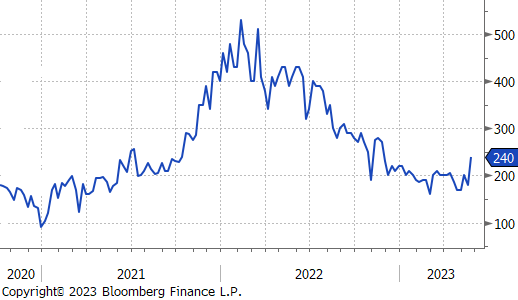
Tanden products held up well compared to HRC, with CRC up 1.6% and HDG unchanged. This caused led to a jump in the HDG-HRC spread, up to $240 – the highest level since mid-November.
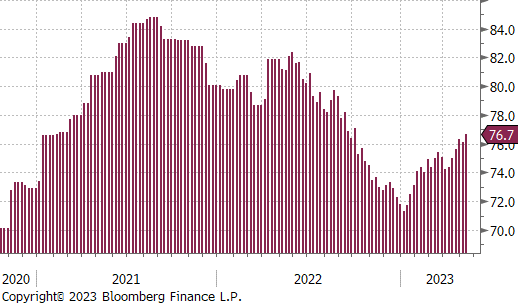
Domestic production continues to push higher, with capacity utilization up 0.6% to 76.7%, this week. This is the highest level of production since the first week of October, last year.
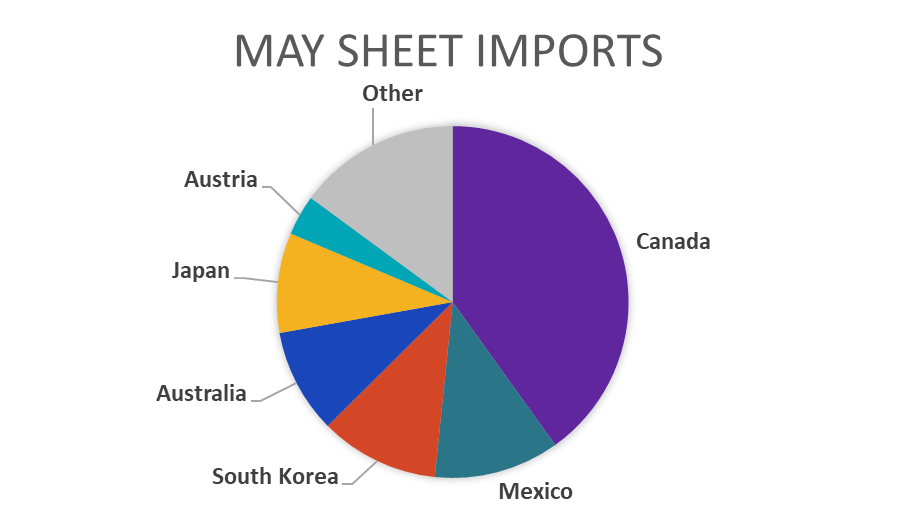
May Projection – Sheet 886k (up 177k MoM); Tube 536k (down 22k MoM)
April Projection – Sheet 709k (down 55k MoM); Tube 558k (down 43k MoM)
The current expectations for May arrivals would bring imports to the highest level since October of last year.
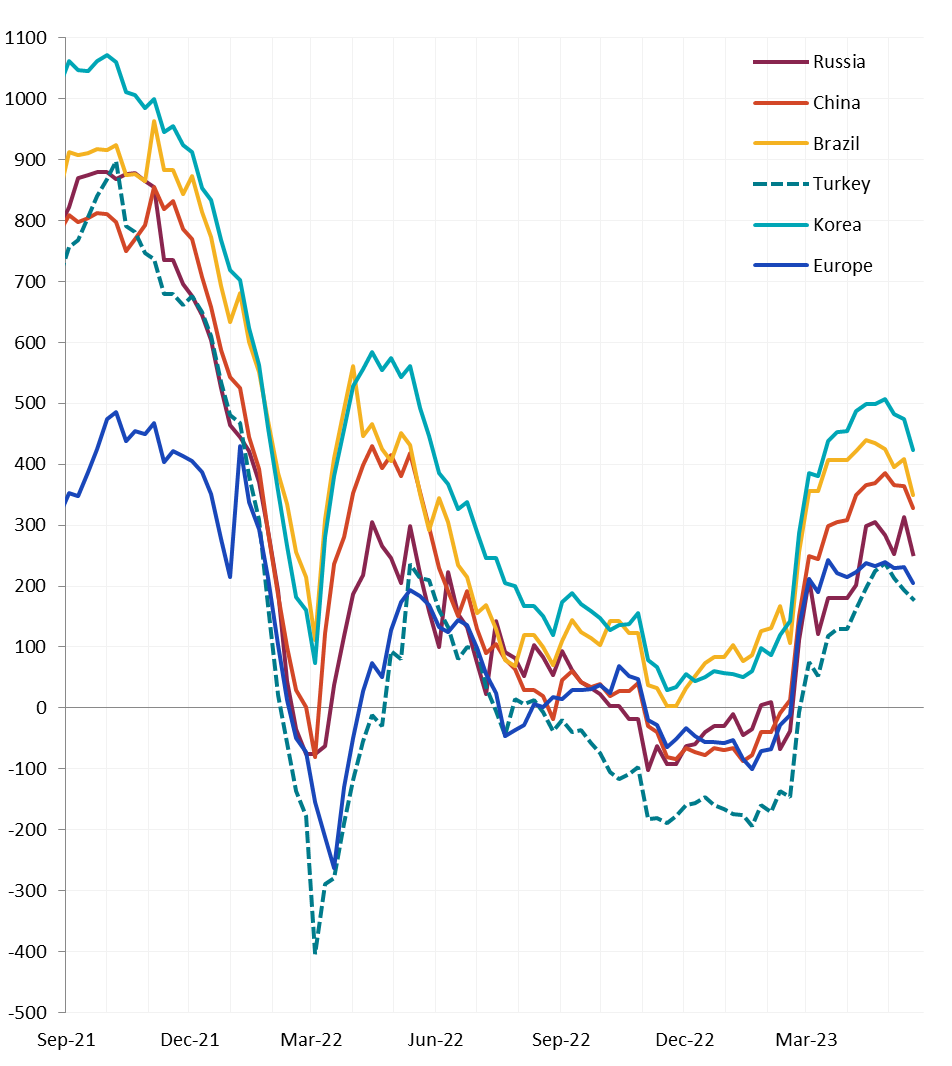
Global differentials fell further this week, as the U.S. domestic price continues to fall at a faster than the rest of the world.
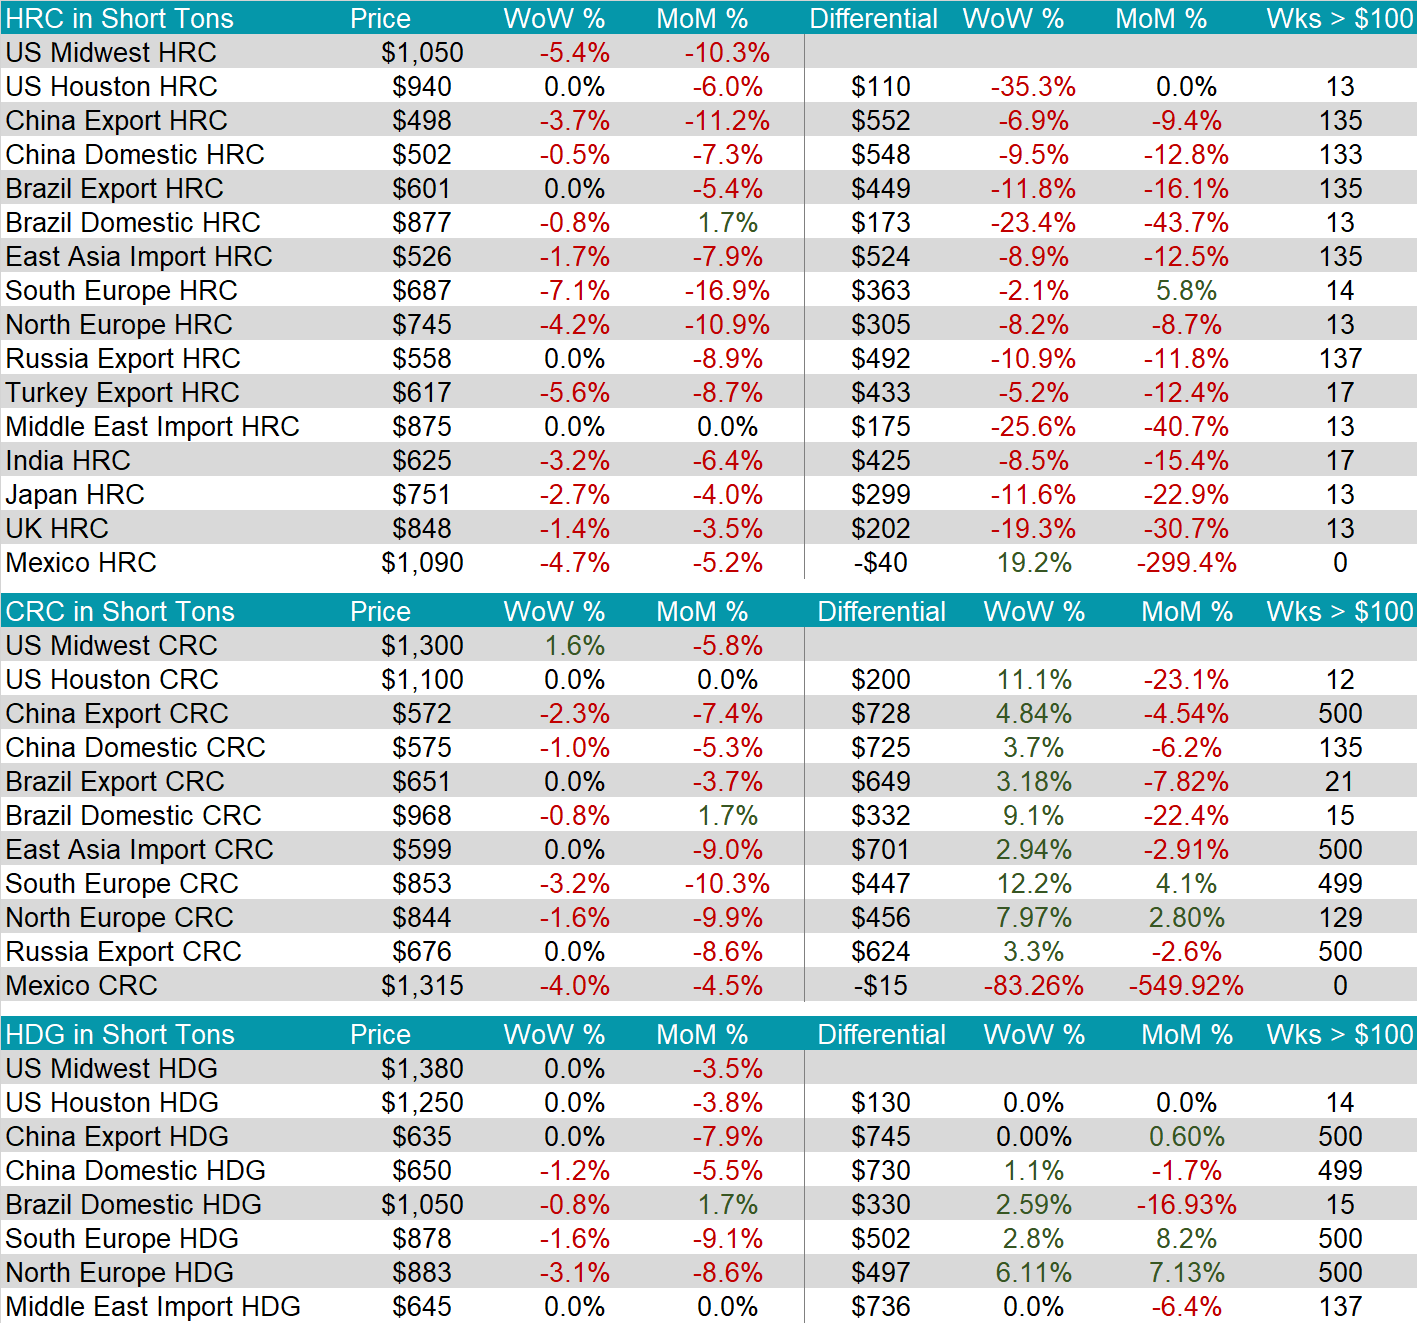
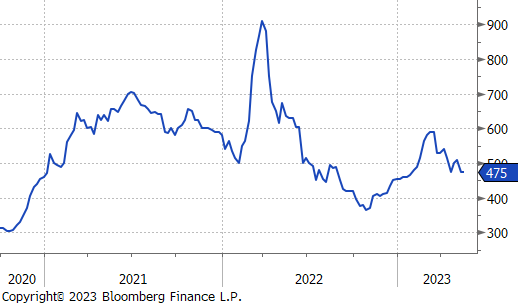
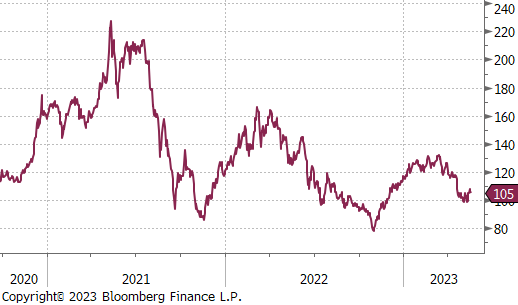
There was very little change on the side of raw materials. The 2nd month Busheling future was unchanged, while the iron ore future gained 2.8%.
Dry Bulk / Freight
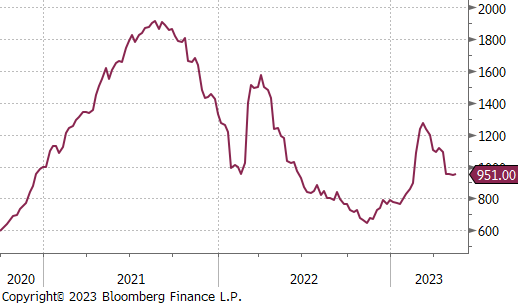
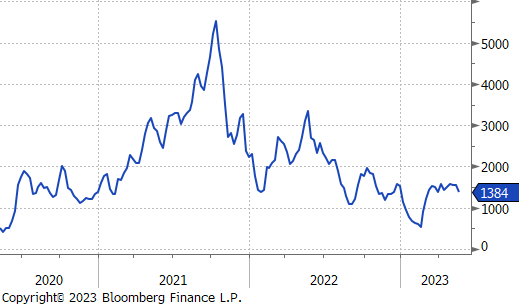
Baltic dry index was down 11.2% and is now at its lowest point in a month. At the same time, the index remains in the $1,350-1,600 range, suggesting that demand for raw materials has been neutral at these depressed price levels.
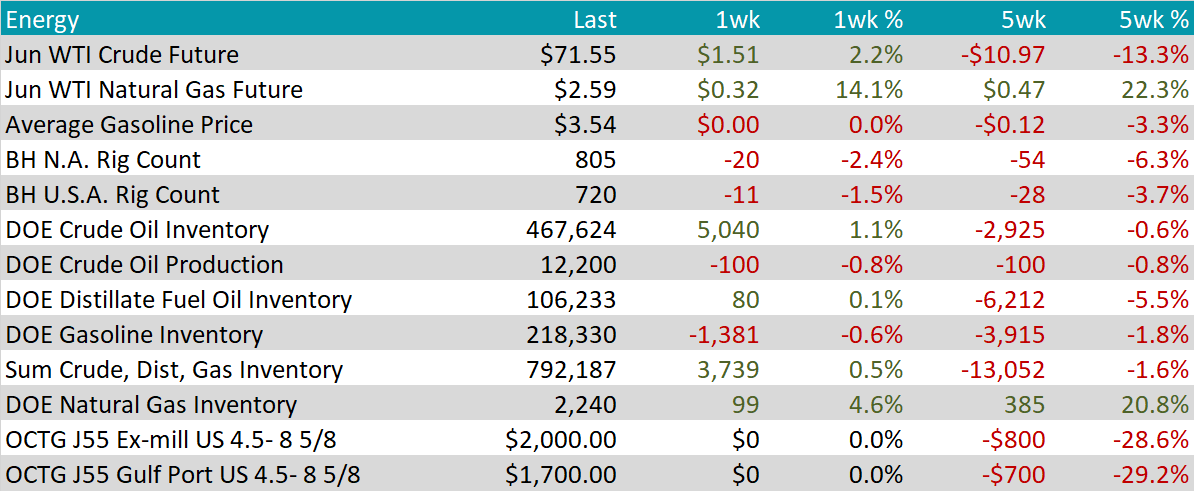
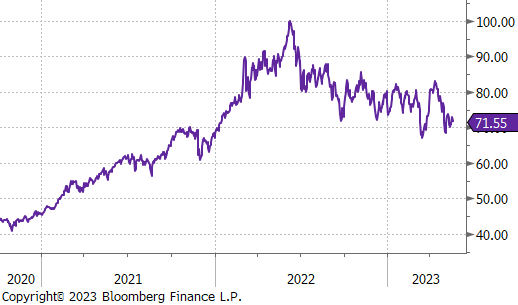
The June WTI crude oil future fell $1.51 or 2.2% to $71.55/bbl. It is now down 13.3% over the last 5-weeks after the surprise OPEC+ production cut announcement.
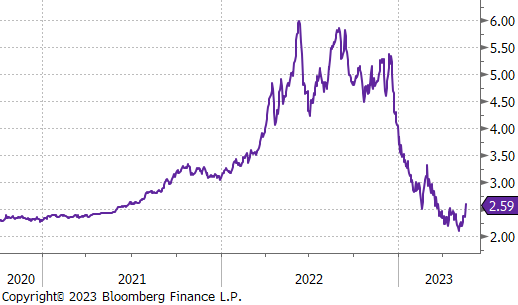
The June WTI natural gas future gained $0.32 or 14.1% to $3.54/bbl.
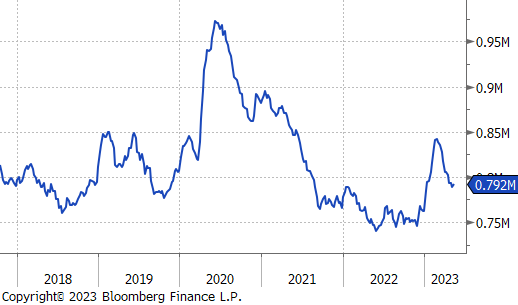
The aggregate inventory level was up 0.5% this week. This is first weekly increase since inventories peaked at the end of February.
The Baker Hughes North American rig count was down another 20 rigs, 11 of those came from the U.S. count.
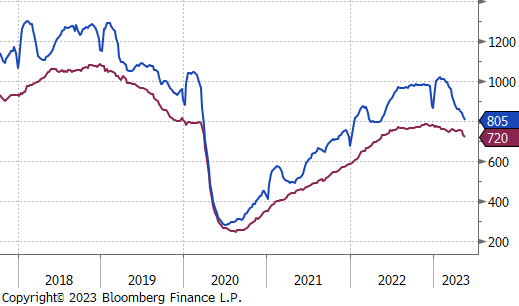
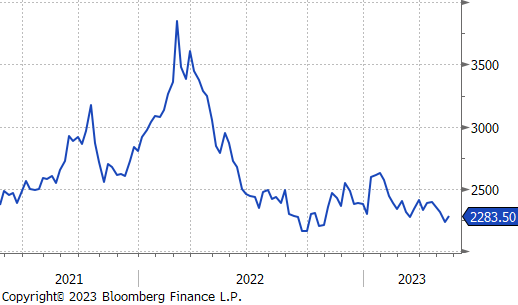
LME Aluminum was up 2.3% this week, after reaching its lowest level in early November. Concerns around demand coming out of China continue to be the strongest headwind for base metals.
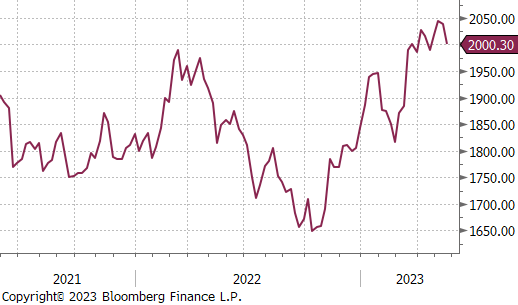
Gold continues to trade in a tight weekly range between $2,000-2,050 after the significant rally following the banking crisis. This week, prices we down 1%, as it sits on the bottom end of that range after economic data continues to point to a resilient economy.
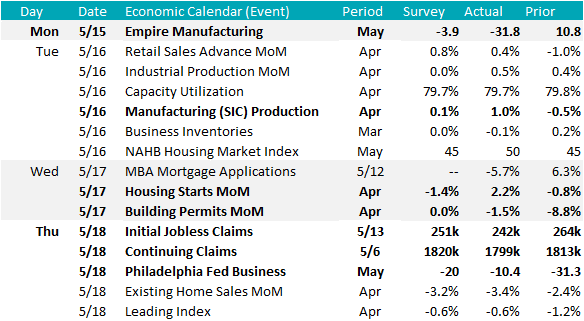
April Housing starts and building permits data showed mixed readings, with starts up 2.2% versus a -1.4% estimate, while permits were down 1.5 versus an estimate of unchanged. The data continues to suggest the pipeline for new construction is well intact, with permits and starts both stabilizing around mid-2019 level after a sharp deceleration in the second half of last year.
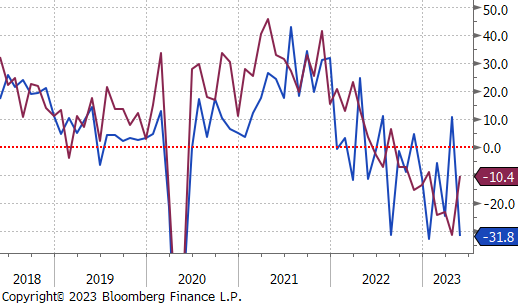
The May Empire (NY) and Philadelphia manufacturing surveys were also released last week. In a sharp reversal, the Empire survey printed deep in contraction territory -31.8 versus a -3.9 estimate, after a surprise positive print in April. The Philadelphia survey printed -10.4 versus a -20 estimate. It has now printed in contraction territory for the 9th month in a row, however, May results are at the highest level since January.
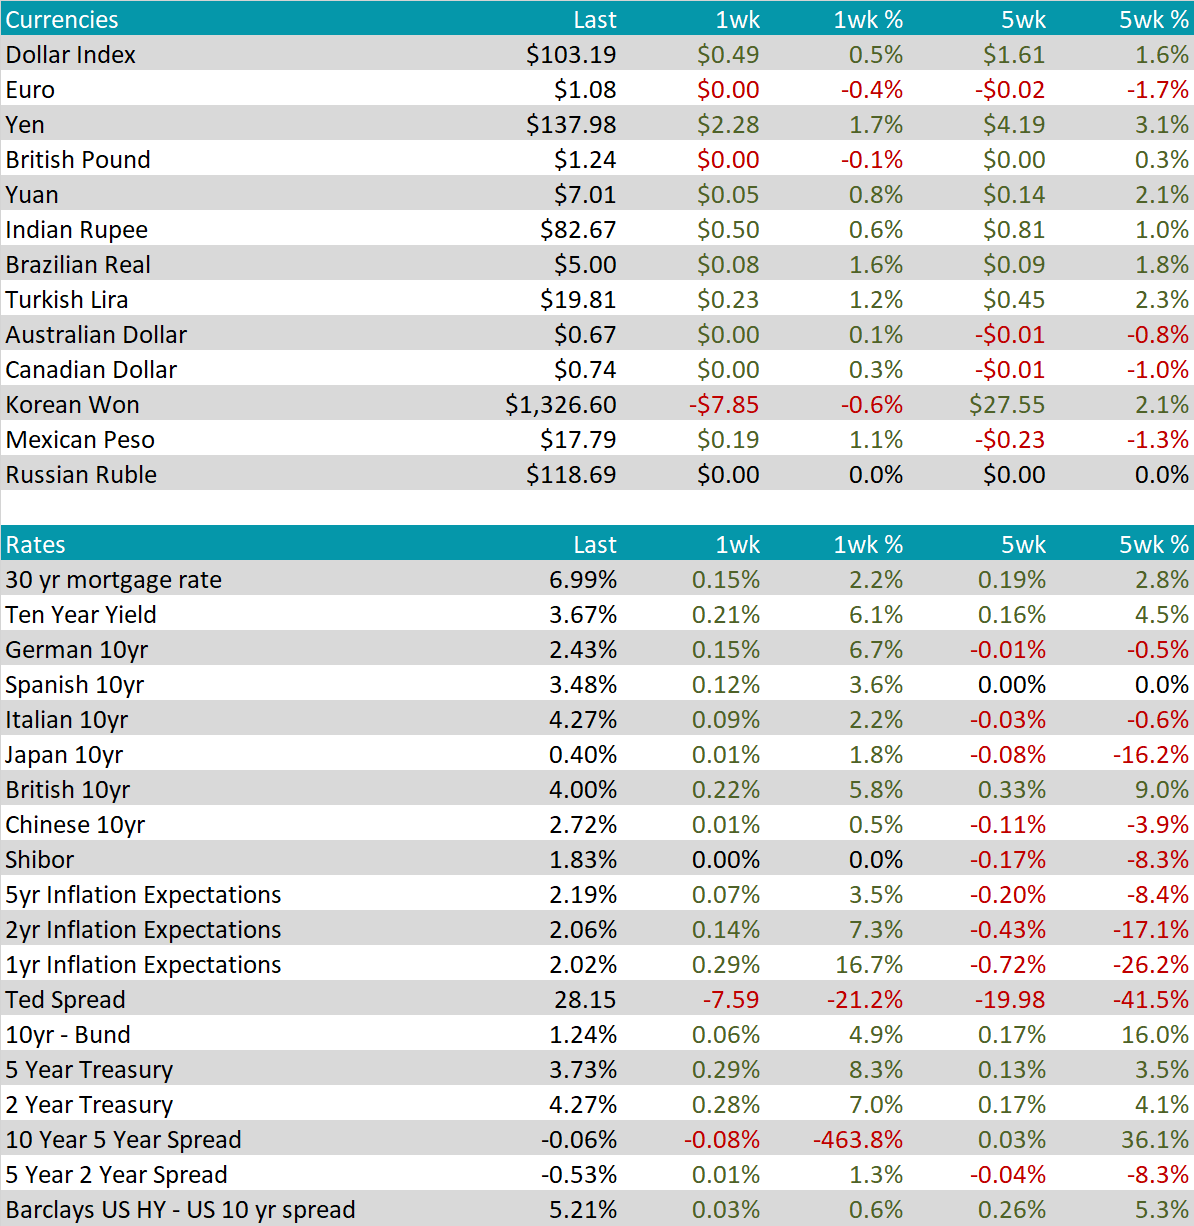
As we have emphasized in prior reports, central bank remains the primary drivers for currency movements between the USD and EUR. With expectations of higher rates in the US, the Euro has experienced a decline, falling from just below 1.11 to its current level of 1.08 against the USD. This represents a notable reversal from the upward trend that the Euro had been experiencing against the USD since last fall. The EURUSD cross has now fallen 1.7% over the past 5-weeks.
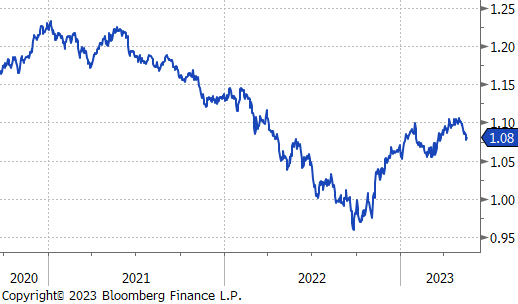
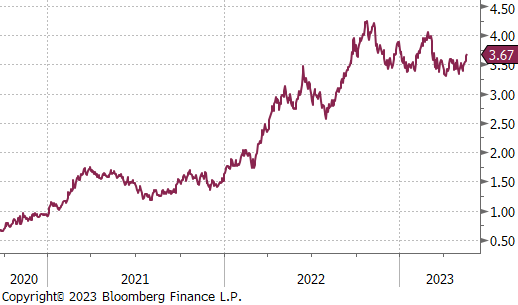
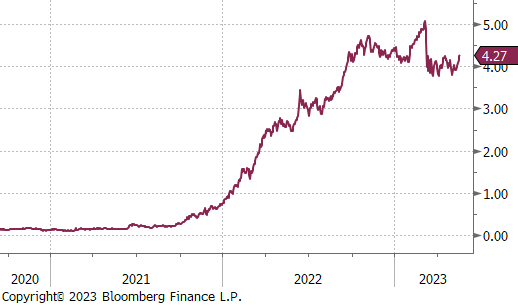
Over the past few months, treasury yields have been fluctuating between 3.4% and 3.6%. Last week brought about a notable change as the 10-year yield surpassed 3.7%, reaching new highs since the banking crisis in March. This comes following upside surprises in manufacturing, labor, and housing data. Short-term rates have also experienced substantial moves over recent weeks. The 2-year Treasury Note is now yielding over 4.27%, a new high since early March. These shifts were predominantly influenced by a significant change in expectations regarding near-term interest rate policies from the Federal Reserve. The market is currently reconsidering another rate hike by the end of this year and is assigning lower probabilities to significant rate cuts by the end of the year.