Flack Capital Markets | Ferrous Financial Insider
May 26, 2023 – Issue #381
May 26, 2023 – Issue #381
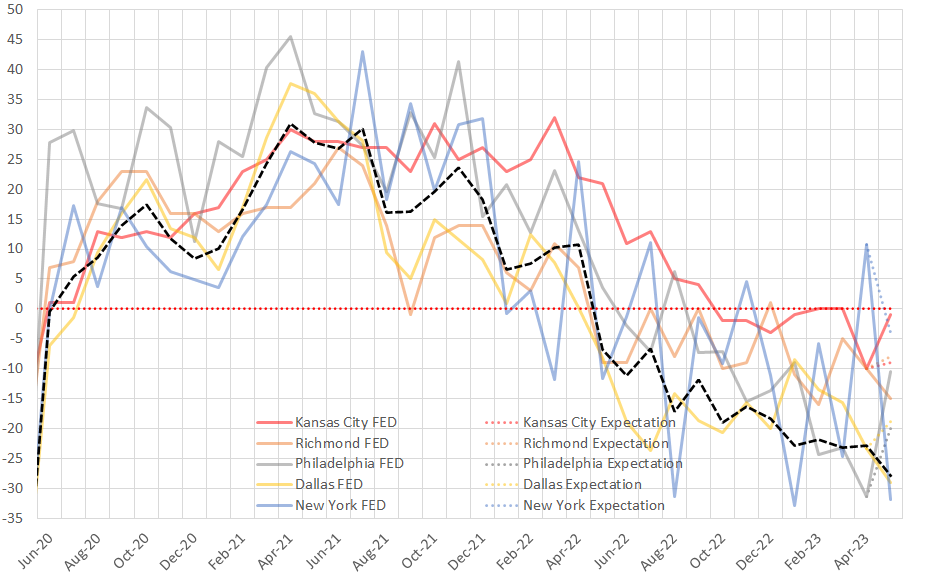
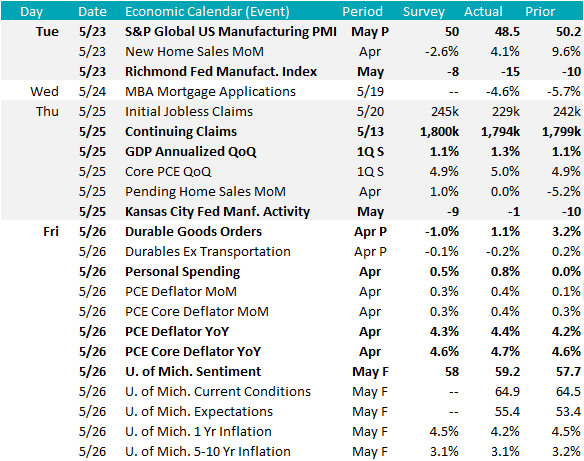
Last week, (also including Monday data) we received the remainder of the Regional Fed Manufacturing surveys for May. The overall takeaway is deeper contraction within the sector signaling further contraction in activity. Below are the 5 topline readings versus expectations:
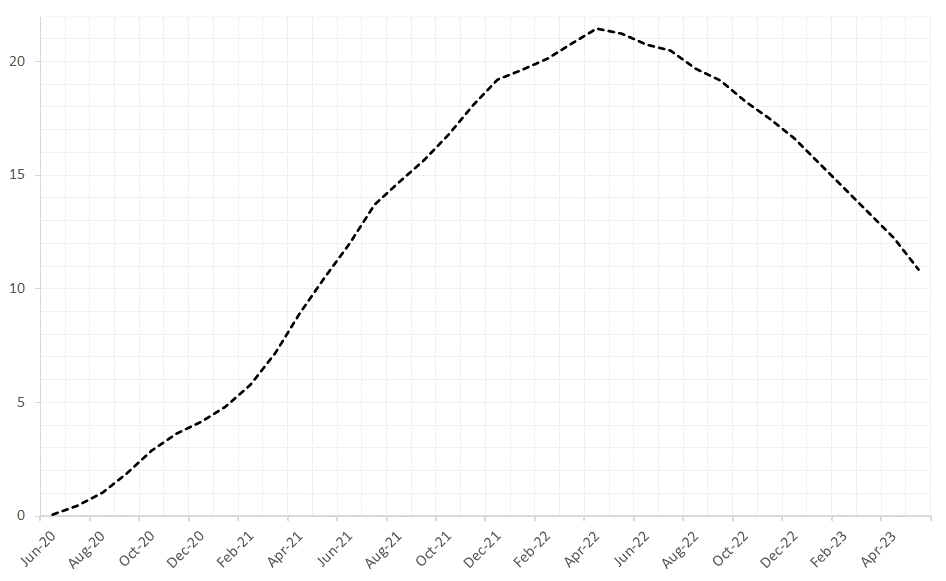
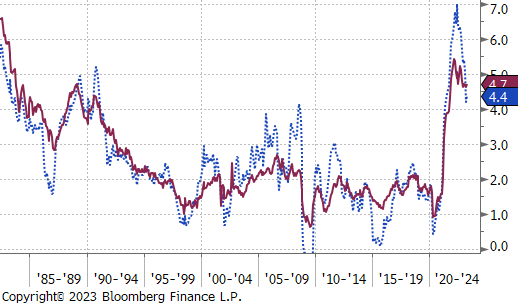
Prior to this month’s data, the underlying subcomponents of these reports were starting to show signs that we were reaching a turning point in the manufacturing sector. However, May data suggests that we will have to wait for that rebound. This is most clearly shown by the black dashed line in the top chart on the right, which is a composite of the five surveys. While the step lower in the data is not necessarily a welcome sign, further context is necessary in understanding exactly what it means, and the second chart provides it.
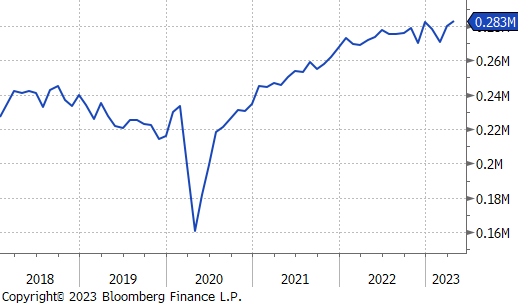
Here, we see the accumulation of the recovery following the pandemic mandated shutdowns for manufacturing over the last three years. What this shows most clearly is that recent contraction has only cut into about half of the expansion that occurred. This is further underscored by the fact that new construction spending on manufacturing has grown at an incredible pace, up another 8.3% in April (most recent), and up 151.7% since June 2020, the starting point for the recovery in the sector.
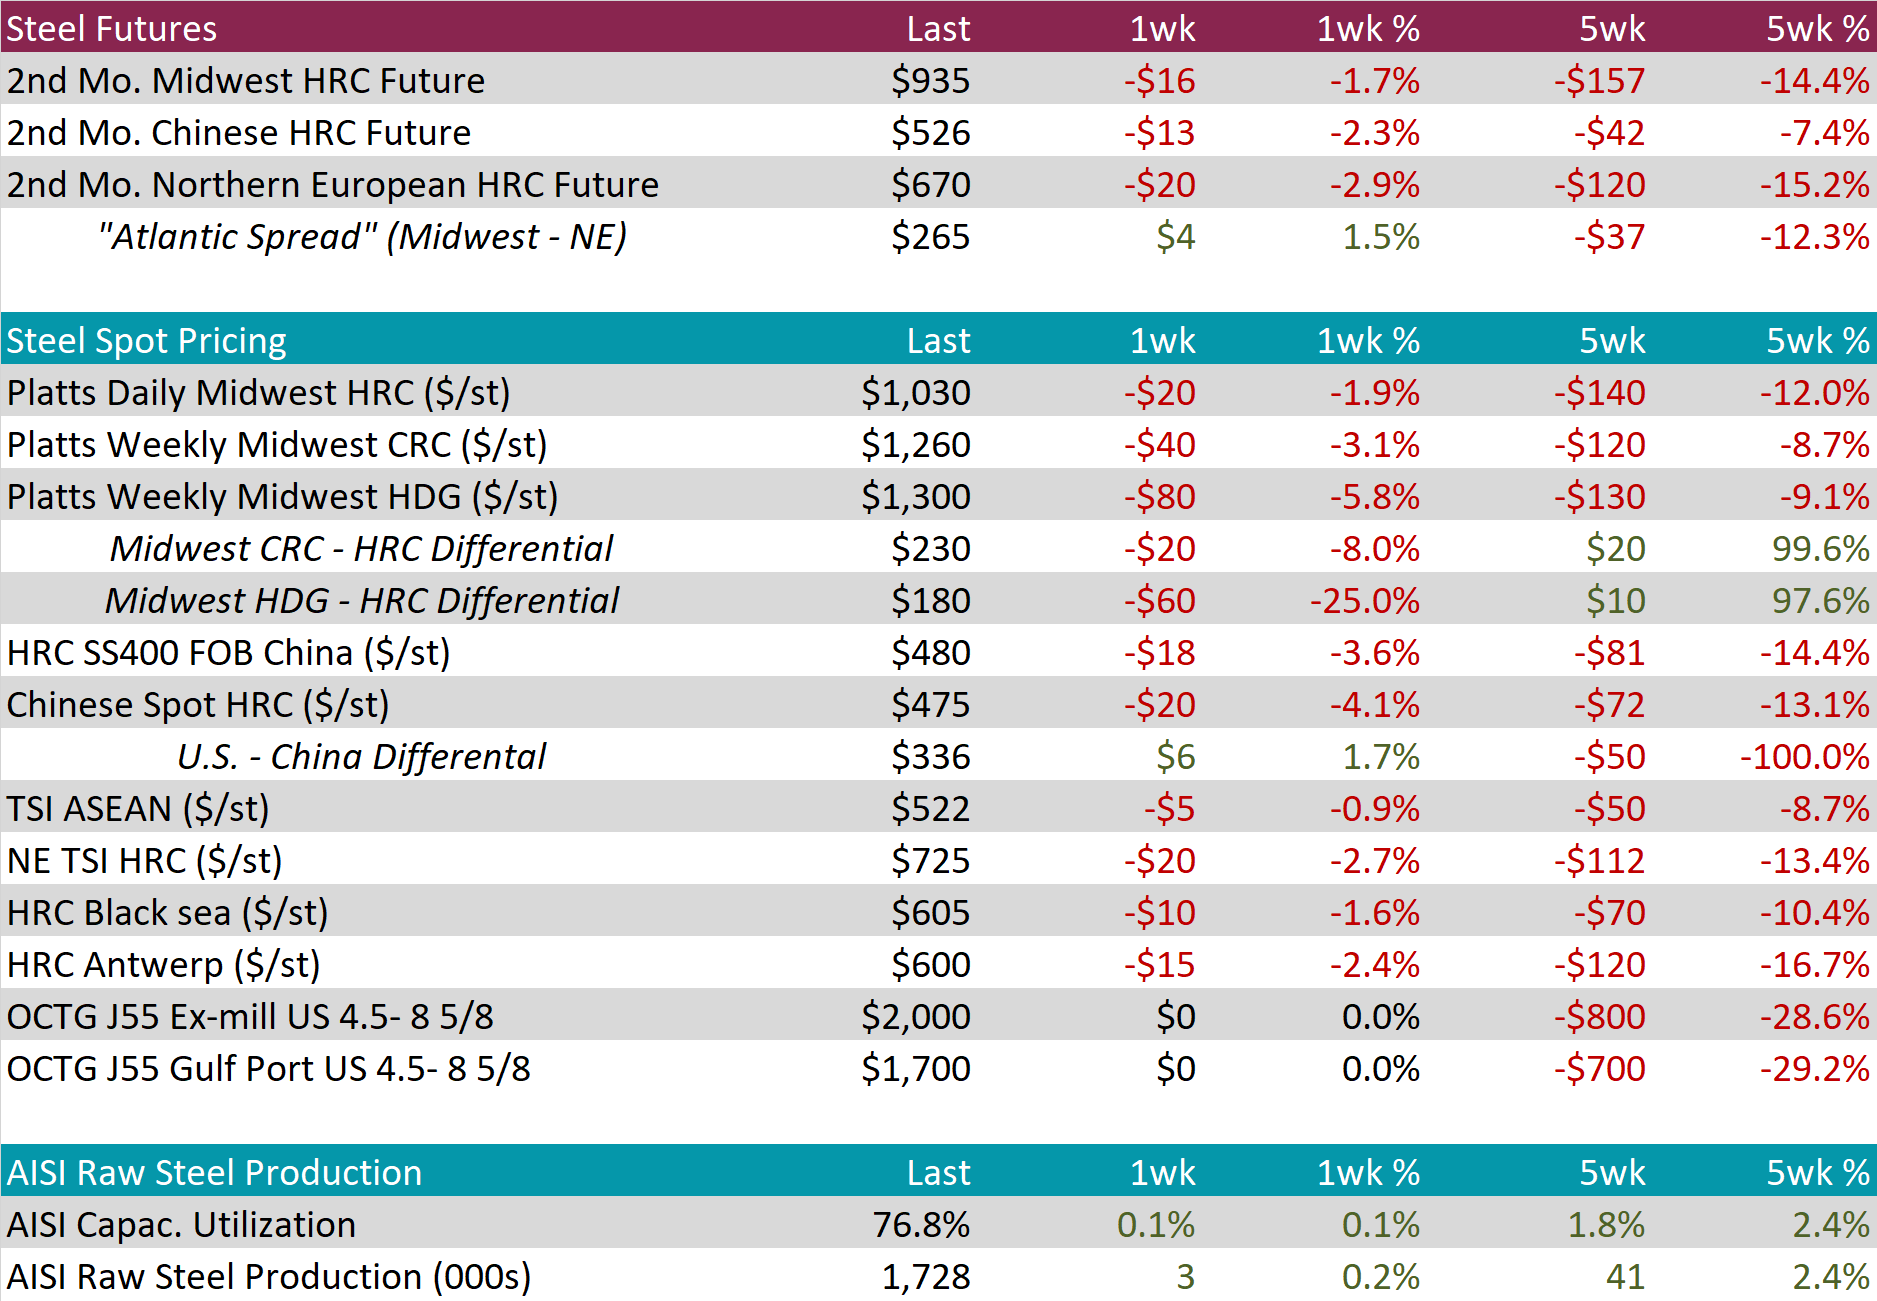
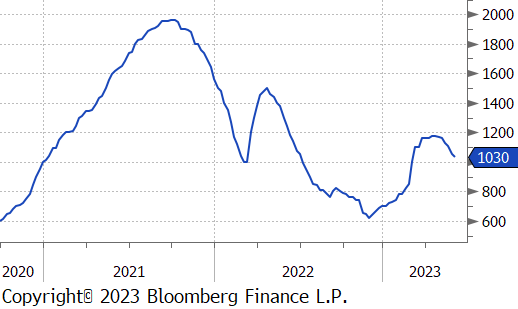
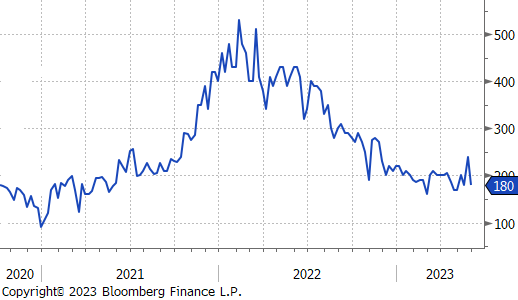
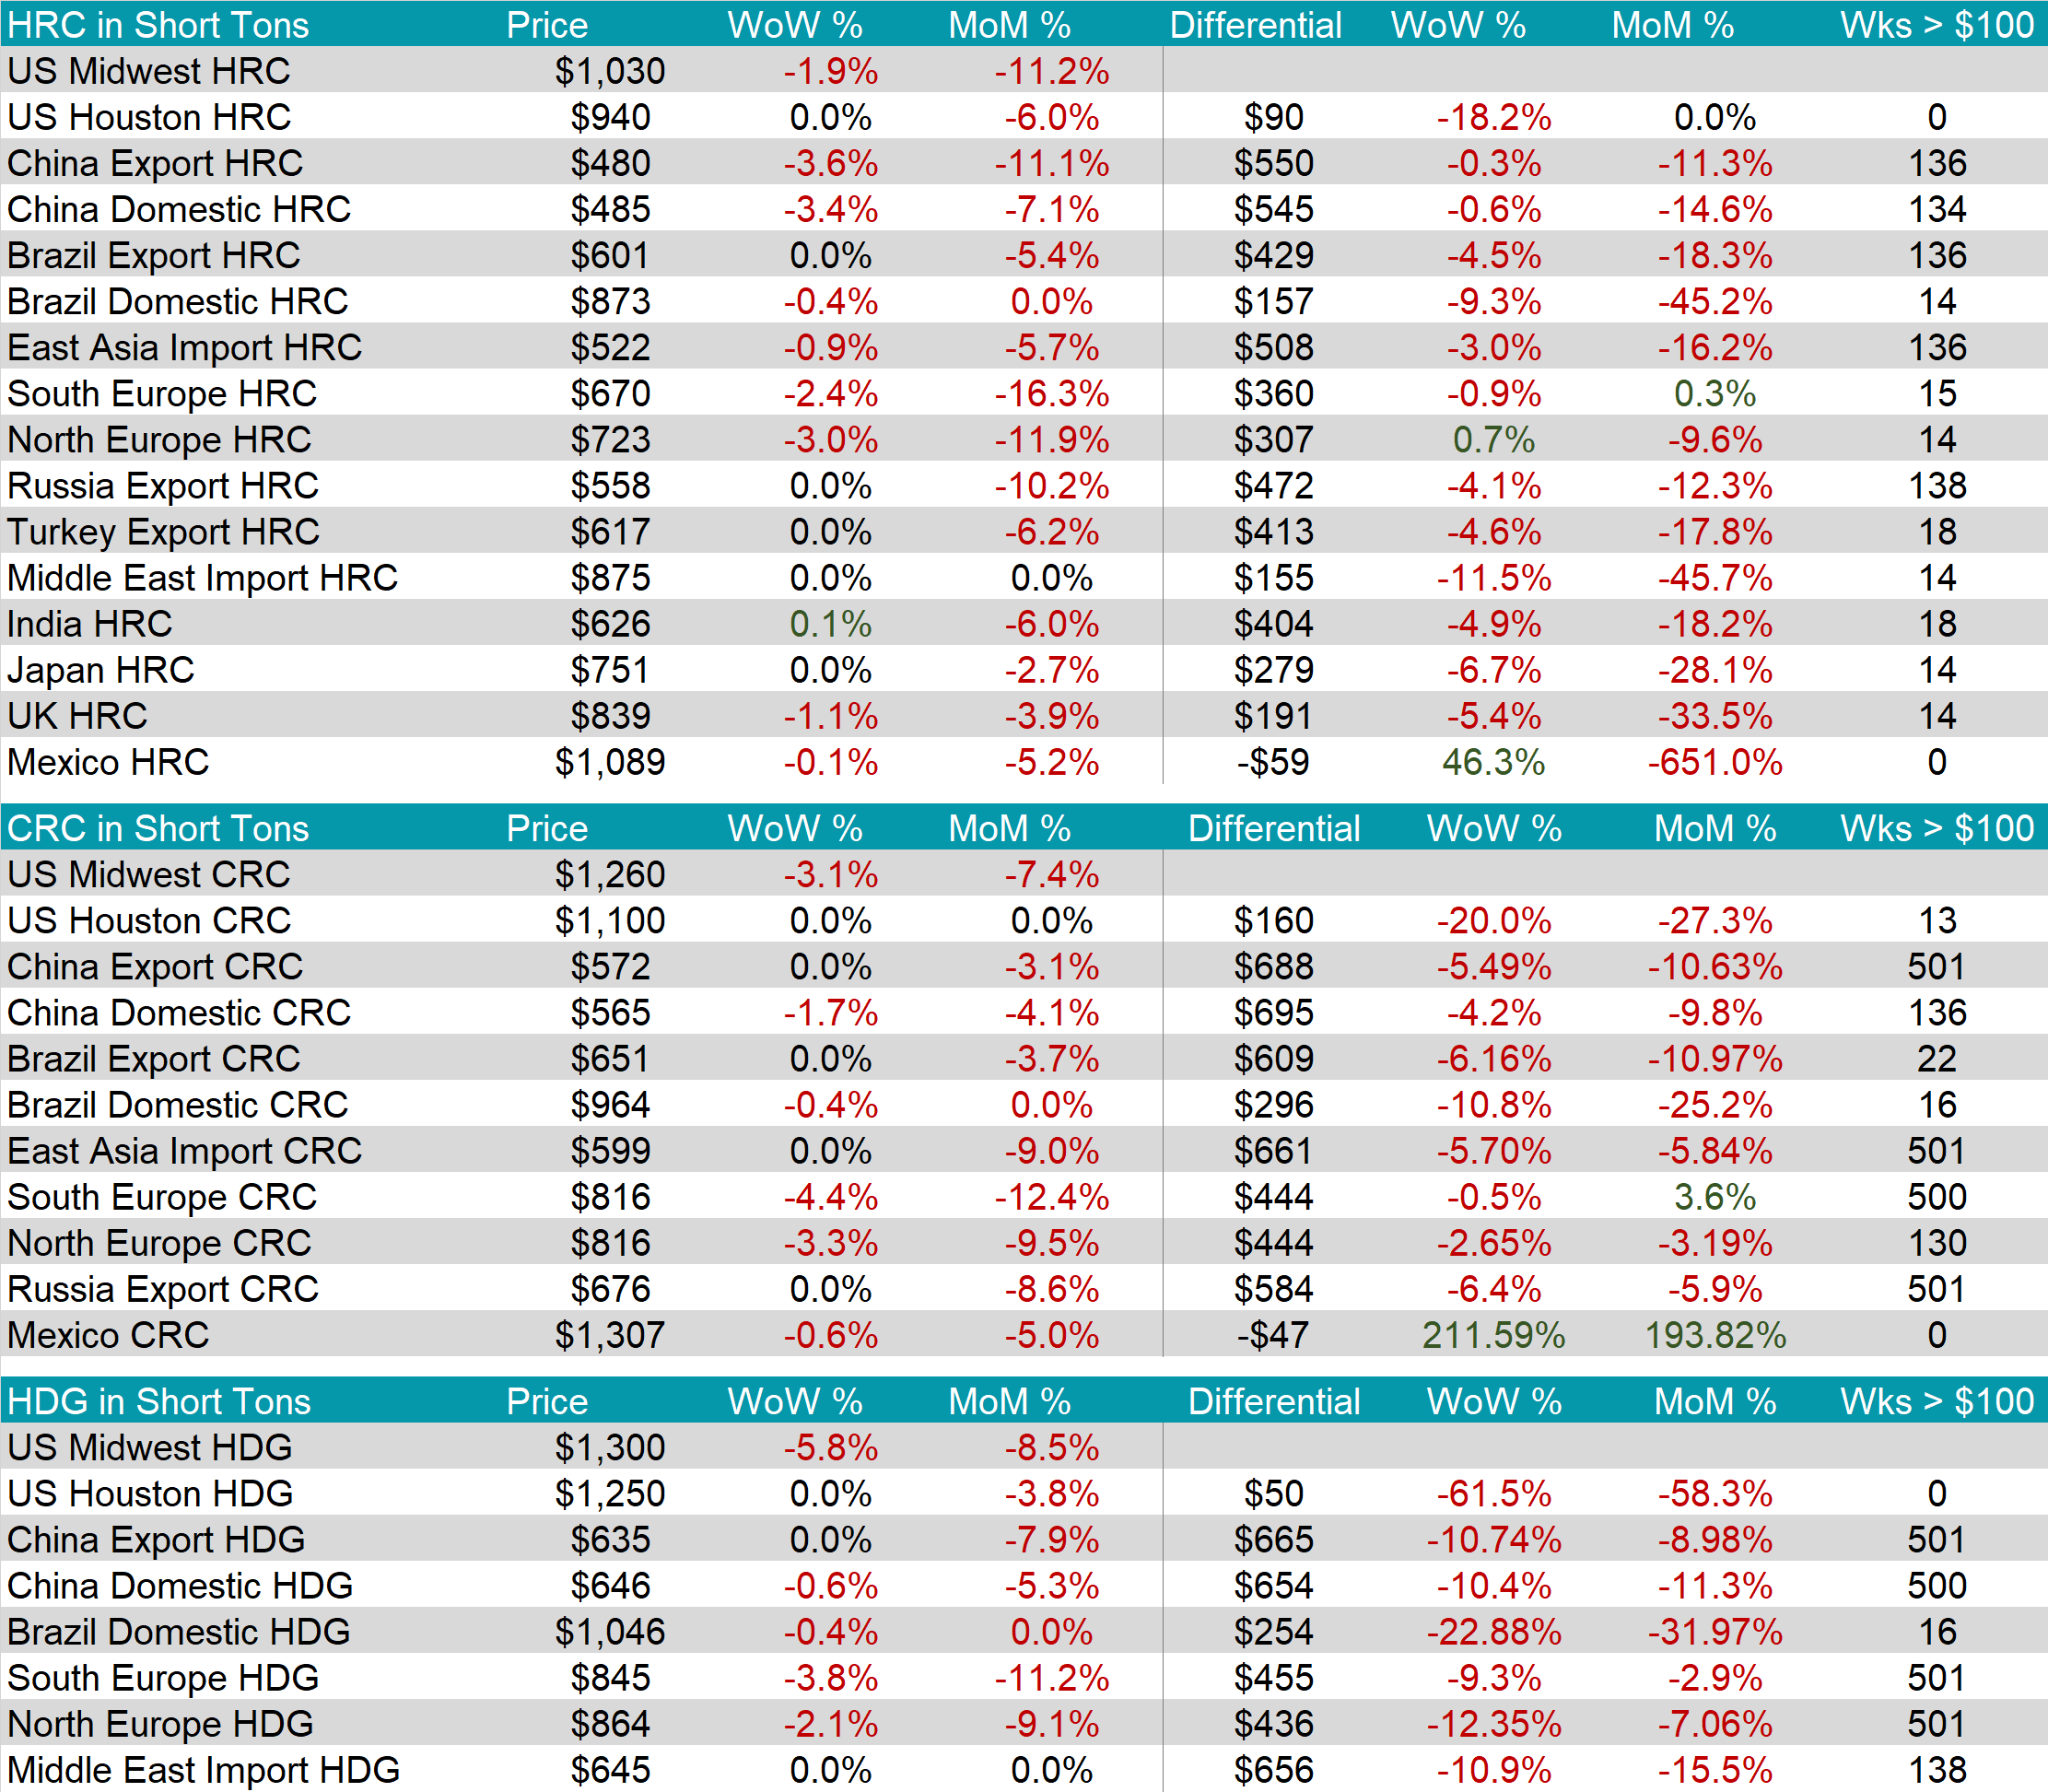
The HRC spot price was down $20 or 1.9% this week and is down 12% over the last 5 weeks. The 2nd month future (June) price was also lower this week, down $16 or 1.7%. The gap between the spot price and 2nd month future is $95, and we anticipate that the spot price will continue to slide until this spread has fully contracted.
Tandem products fell more significantly than HRC this week, HDG led CRC lower, down $80, and $40, respectively. This pushed the HDG – HRC differential back down to $180 after last week’s spike.
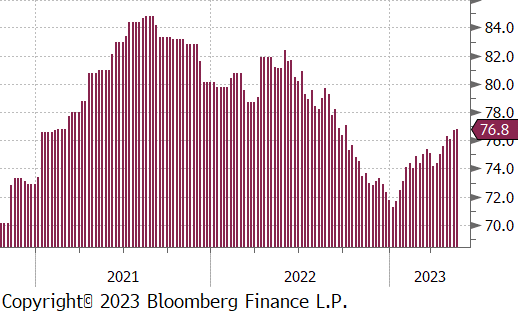
Mill Production continues to climb, with capacity utilization up 0.1% to 76.8%, this week.
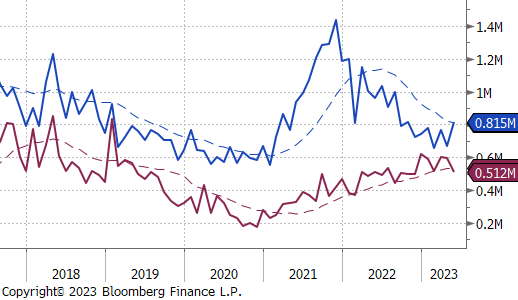
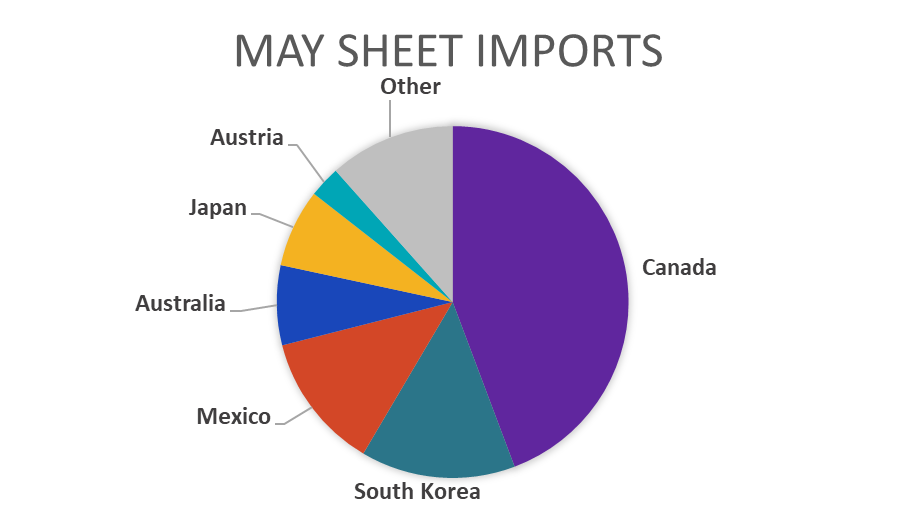
May Projection – Sheet 815k (up 147k MoM); Tube 512k (down 85k MoM)
After preliminary projections for May imports were pointing to a significant increase, the pace of sheet license data has sharply decelerated.
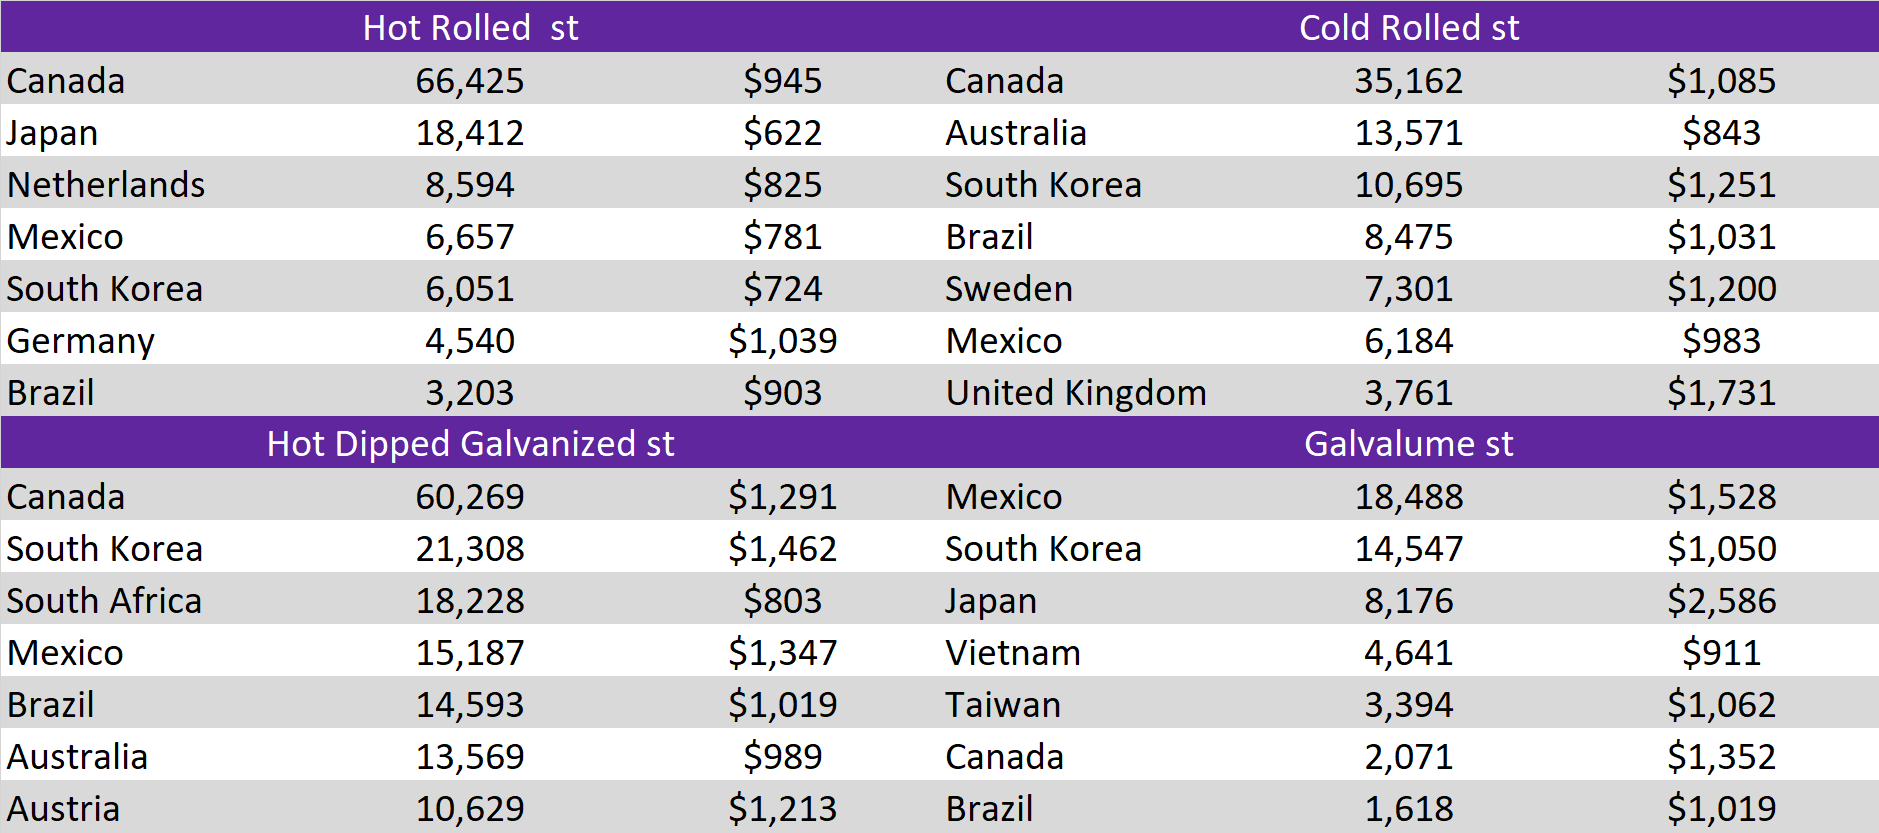
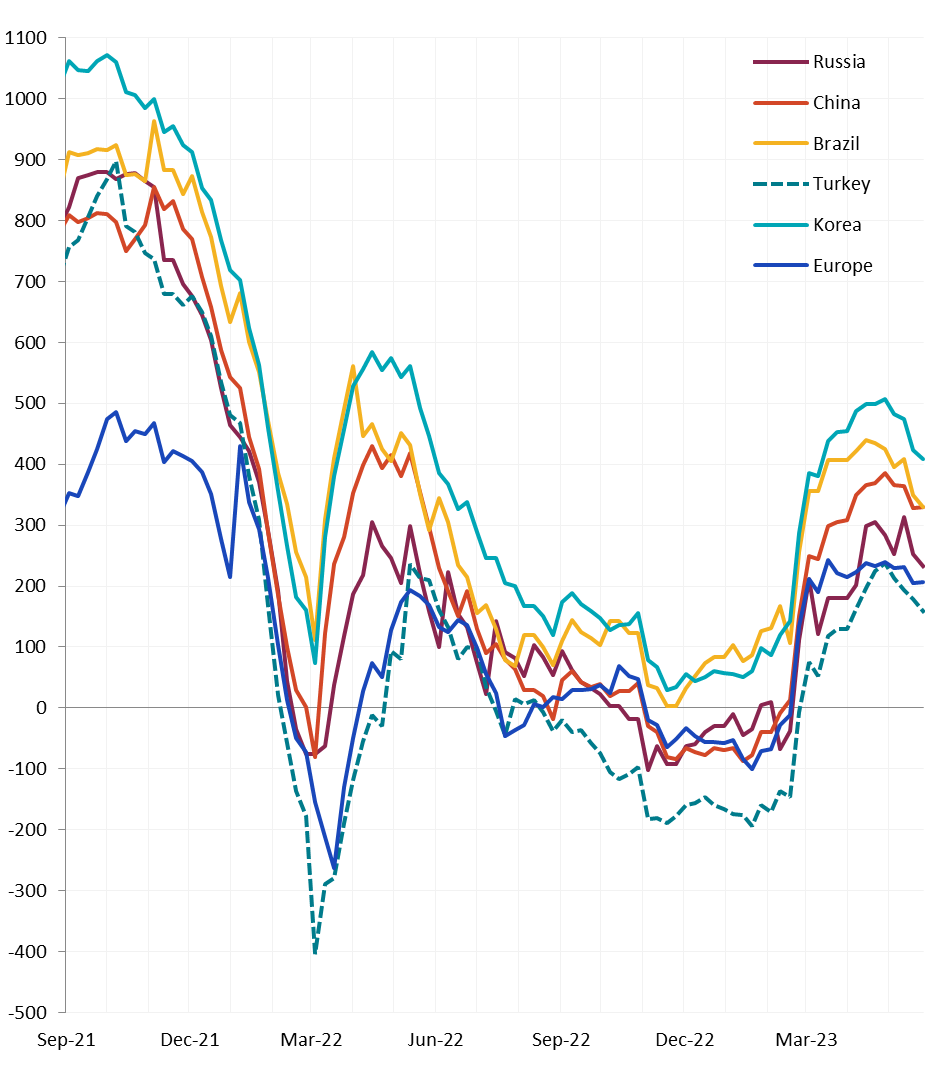
Most global differentials continued the trend lower this week, except for Europe and China, who saw their weekly prices fall more significantly than U.S. domestic prices.
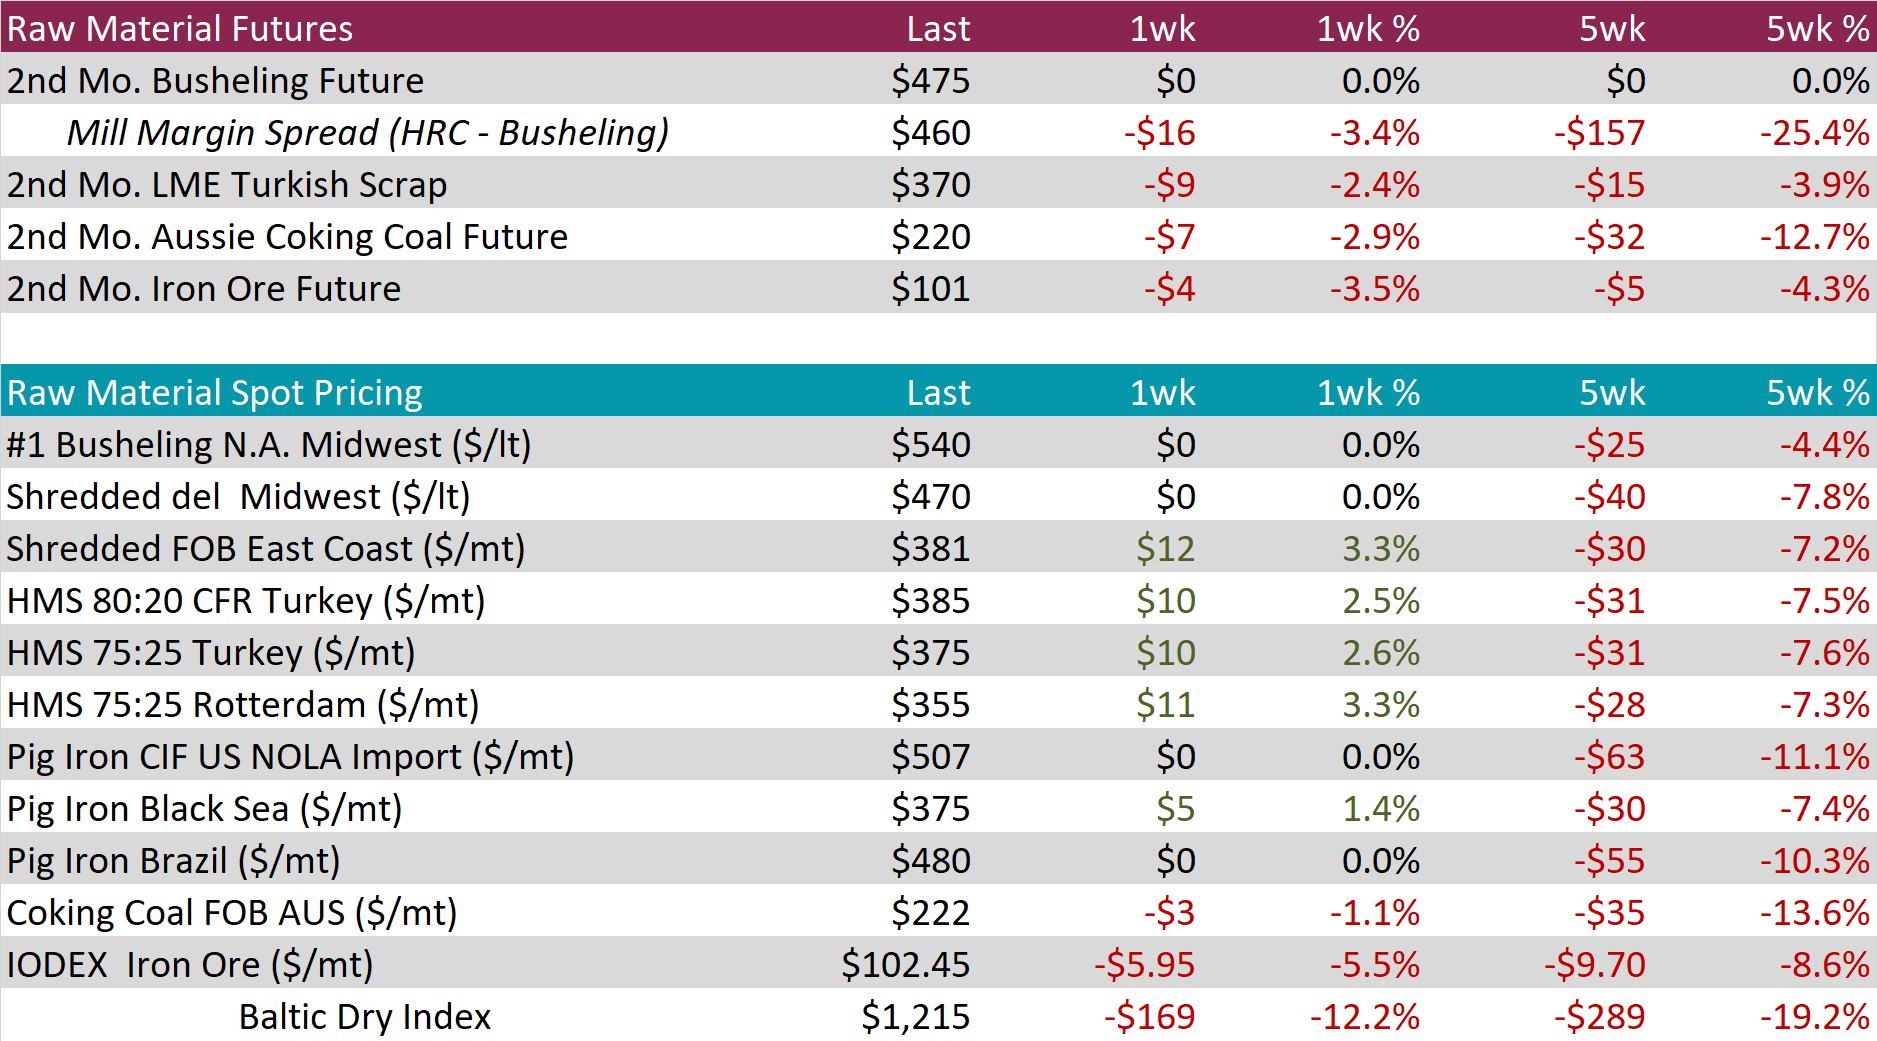
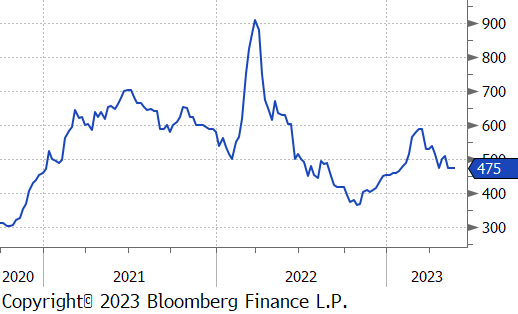
The 2nd month Busheling future (July) was unchanged again this week, but the decrease in HRC caused the mill margin spread to compress. This spread is down $157, or 25.4% over the last 5 weeks. We anticipate further downward pressure on the spread until we reach the low levels from 4Q22.
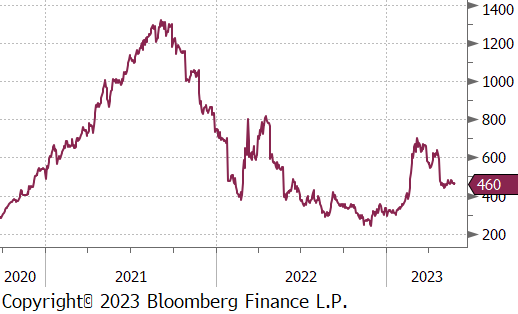
The 2nd month iron ore future (July) price was down $4 or 3.5%, last week. Both the front month futures and IODEX index price continue to find support just below the $100 level.
Dry Bulk / Freight
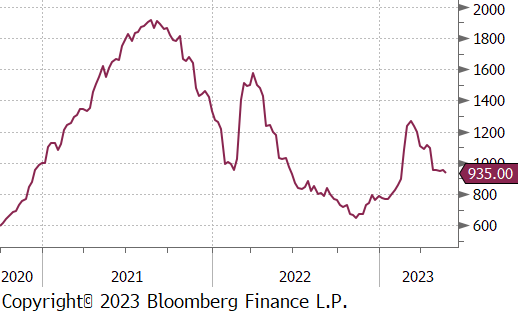
The Baltic dry index was down $169 or 12.2% this week. This is the first time it broke out of the recent trading range established in early March and suggests there is a slip in demand for iron ore.
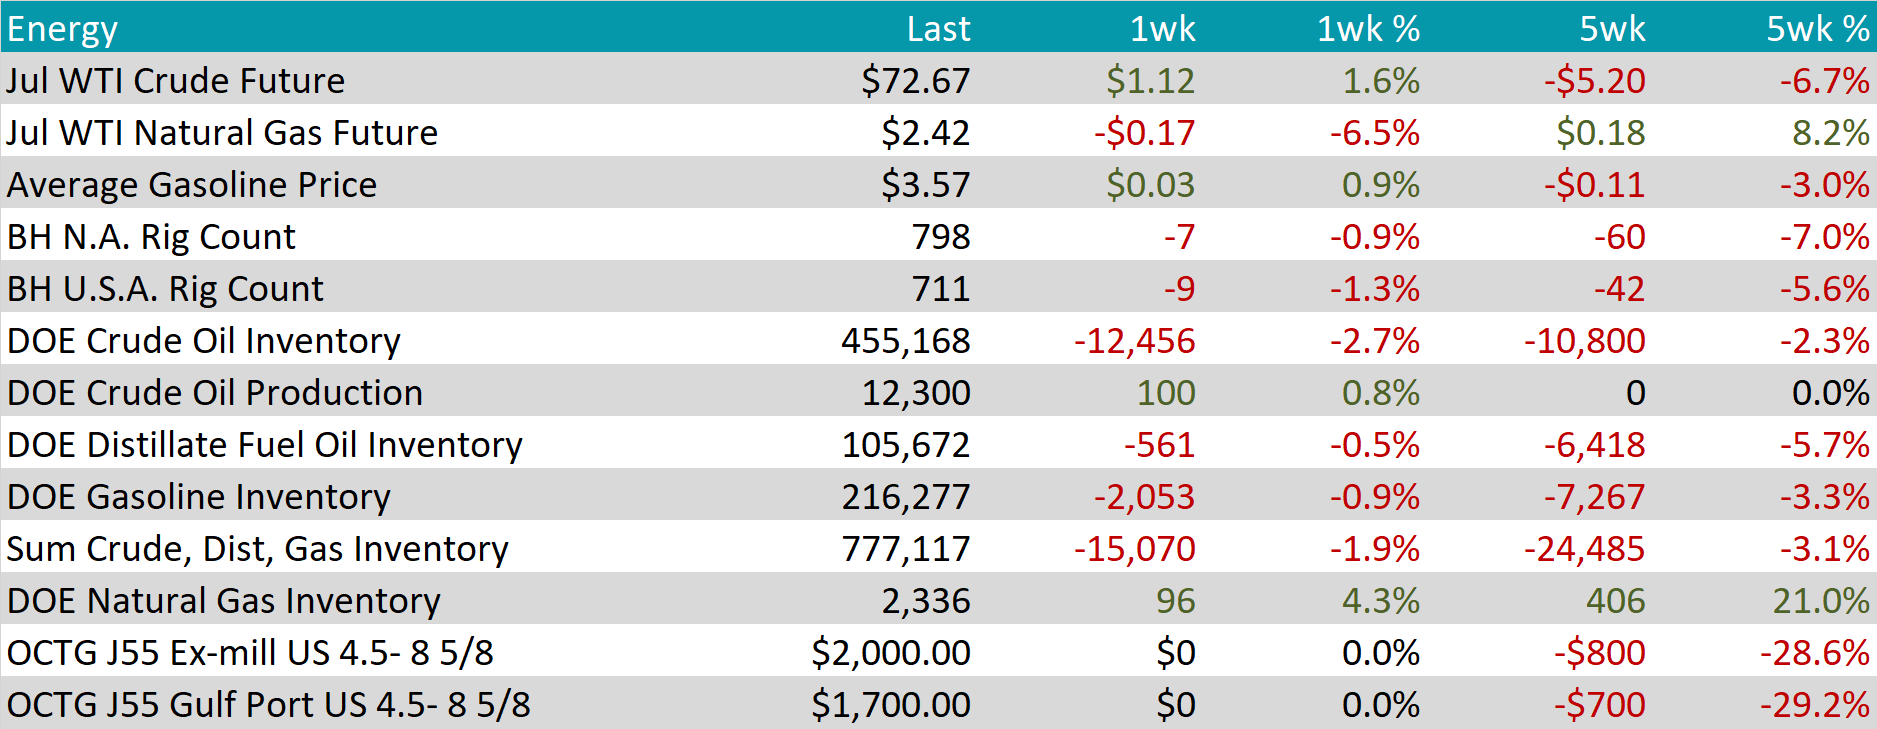
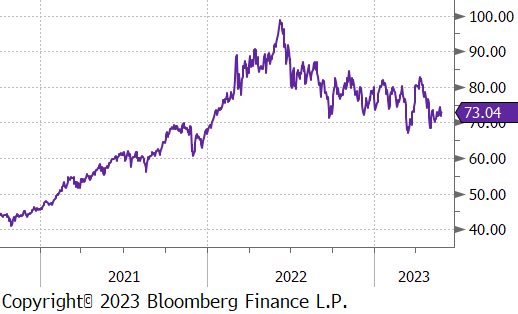
WTI crude oil future gained $1.12 or 1.6% to $72.67/bbl.
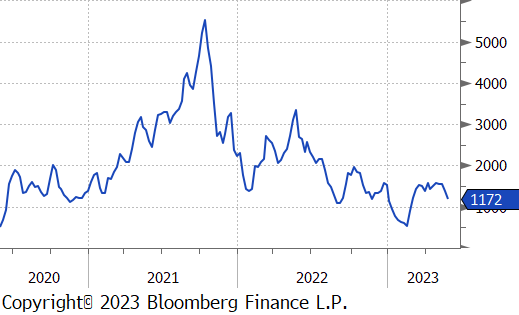
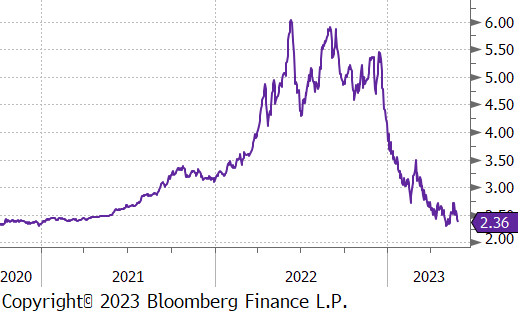
WTI natural gas future lost another $0.17 or 6.5% to $2.42/bbl.
The aggregate inventory level continues to fall, now down another 1.9% this week.
The Baker Hughes North American rig count was down 7 rigs, and the U.S. count is down 9 rigs.
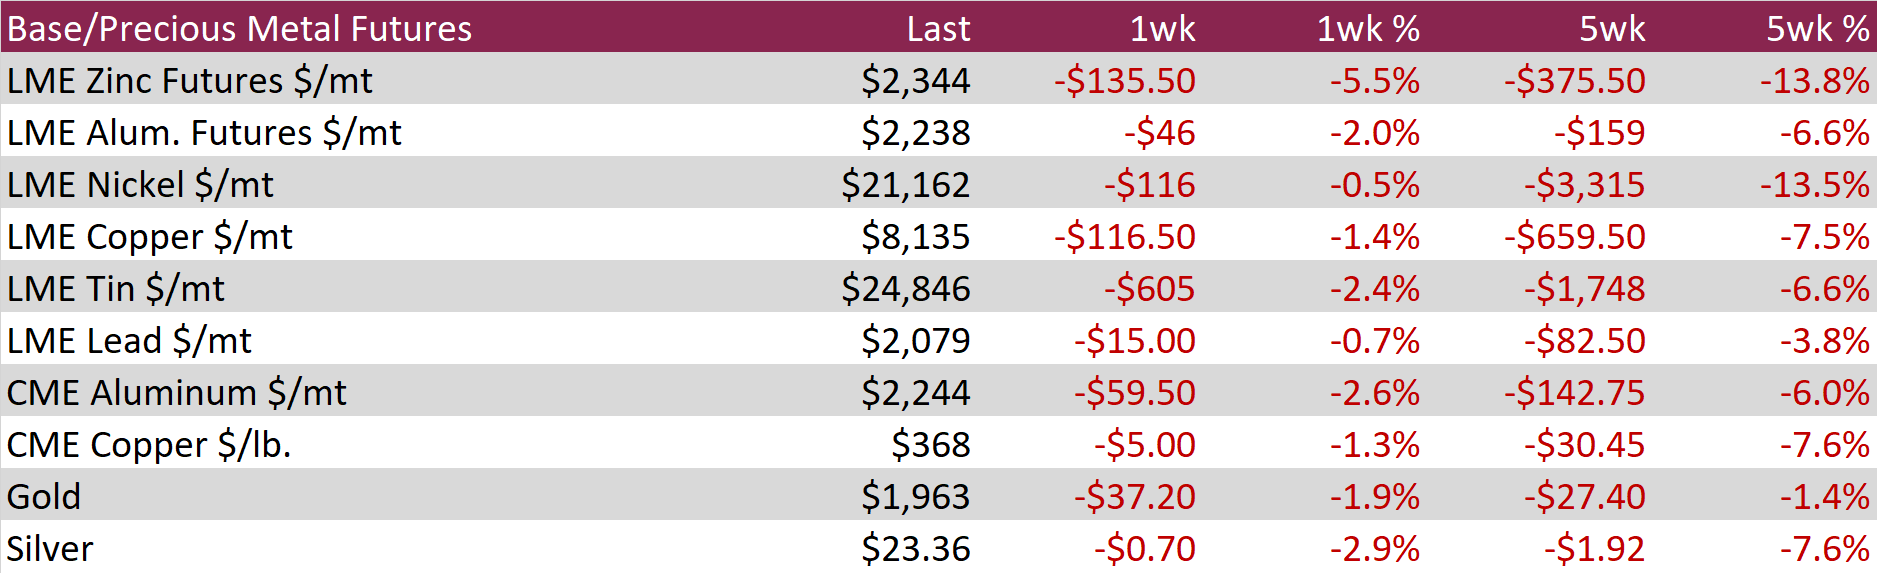
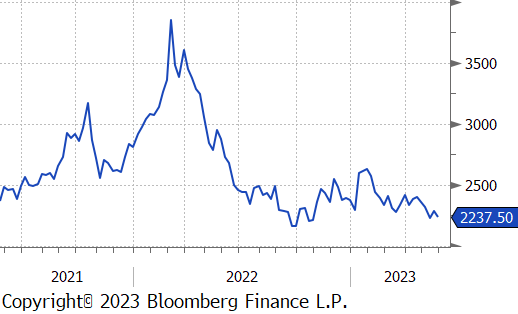
LME Aluminum lost $46 or 2% last week and it continues its trend lower after reaching its local peak in late January/early February. Concerns around demand for all base metals have grown louder as stimulus measures out of China have faltered. This is seen more clearly in the CME Copper chart, which also peaked around the same time and was down another $5 of 1.3%, last week.
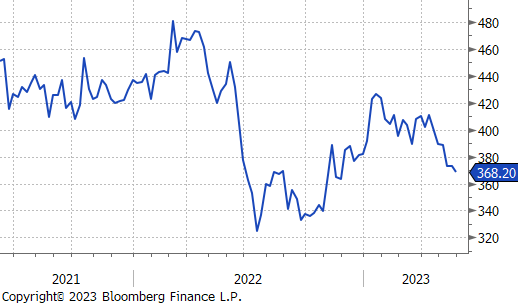
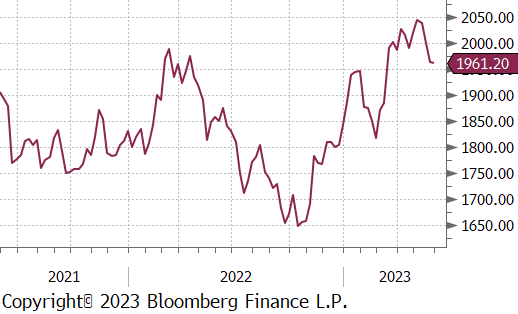
Gold also continued its losing streak this week, after much of the major economic concerns that drove it higher appear to be temporarily resolved. Gold was down $37 or 1.9%, last week and is now firmly below $2,000.
The most important economic data from last week came in the form of inflation. Here, the April PCE topline and core (ex. food and energy) show that prices are not falling as fast as the market continues to expect. The topline figure showed a YoY increase of 4.4% versus expectations of 4.3%, while core shoed a YoY increase of 4.7% versus expectations of 4.7%. Both readings were higher than in March and continue to highlight the fact that the fight against rising prices is far from over.
On the manufacturing side, we saw a promising signal from the preliminary April durable goods report, where new orders were up 1.1% versus expectations of a 1% decline. This was driven by the transportation sector, as ex. transportation new orders were down 0.2% versus an expected 0.1%.
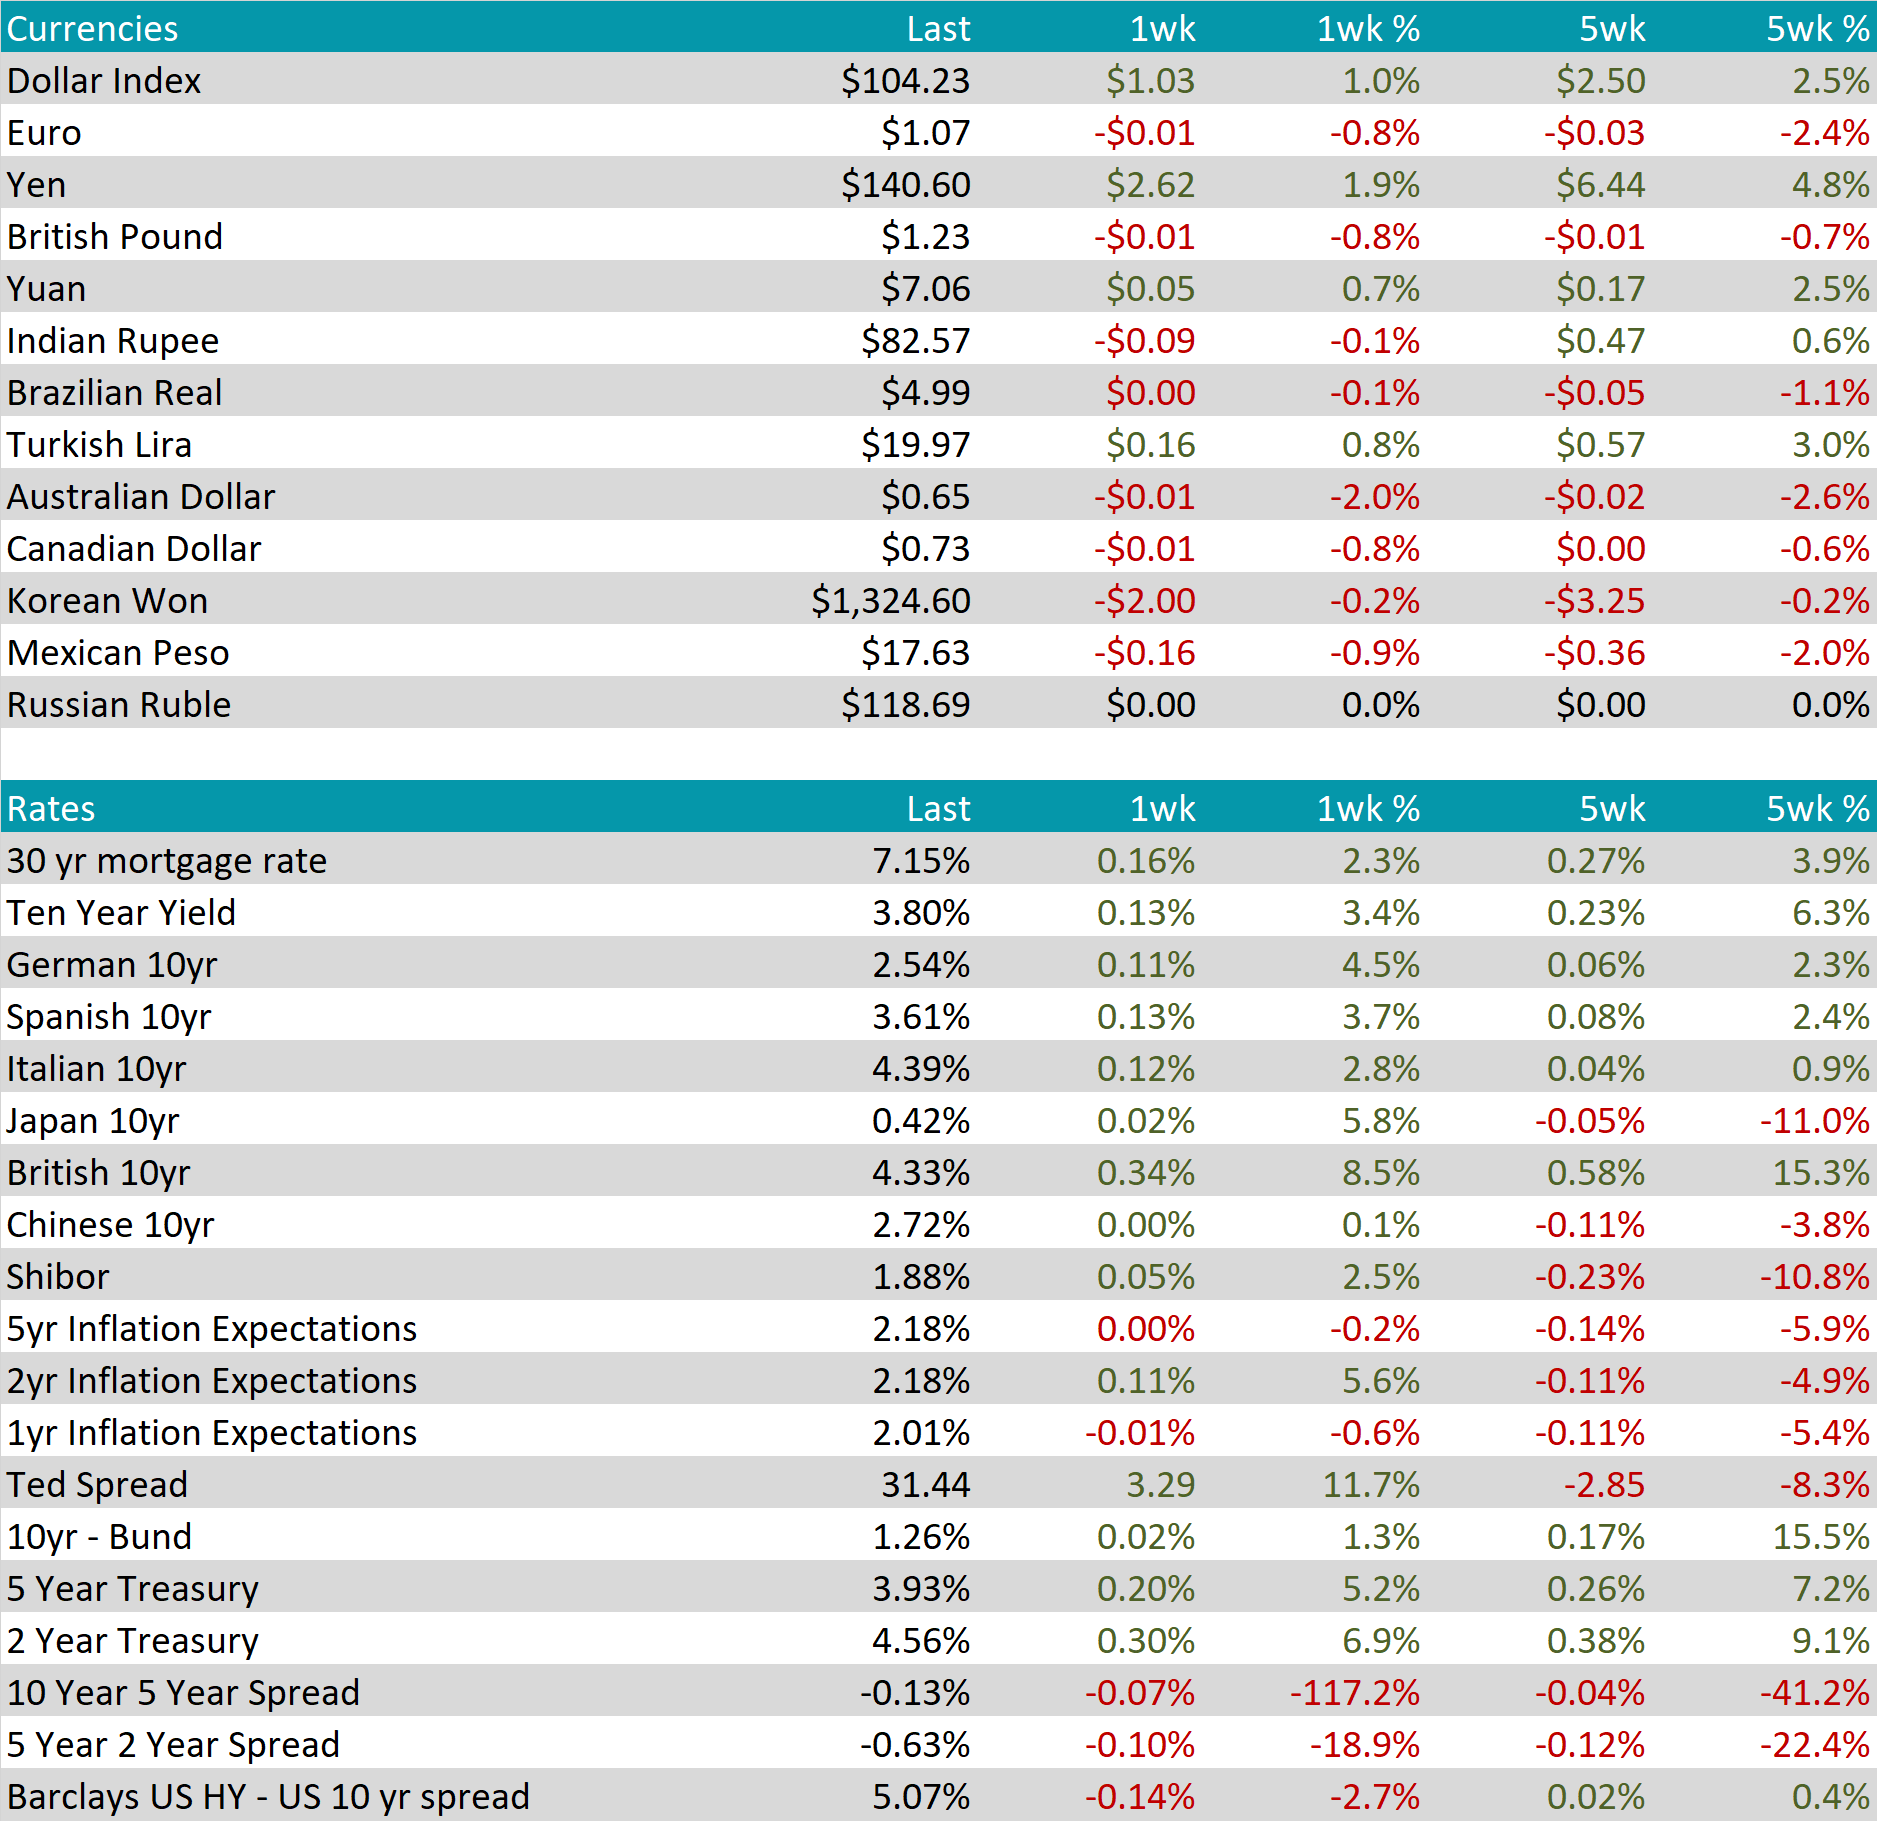
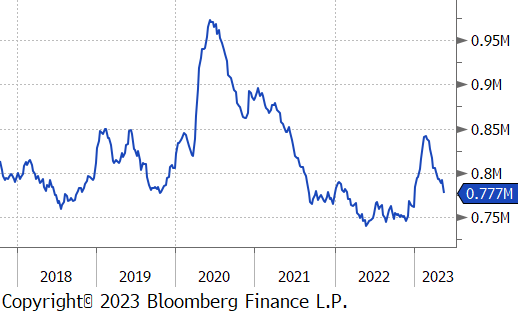
U.S. dollar gained $1.03, up to $104.23, this week. It gained the most against the yen, where the cross between them was up by 1.9%. The resistance to move away from ultra easy policy in Japan continues to weaken the currency against the rest of the world and increases inflationary pressure in the country.
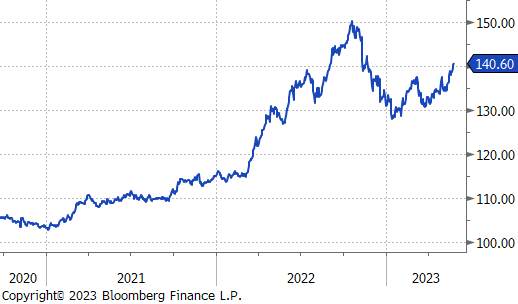
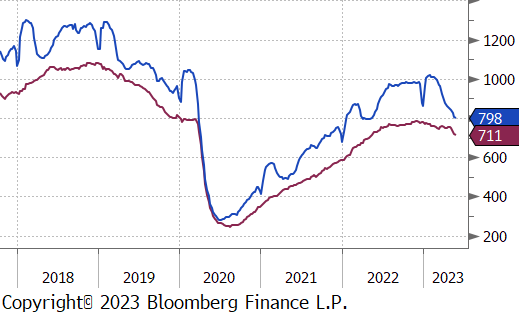
U.S. 10yr Treasury yield has clearly broken out of its 3.3-3.6% 2-month trading range, after increasing another 13-bps last week, up to 3.8%. Recent U.S. economic data is pointing to a resilient economy that has less deflationary pressure than anticipated. While prices are rolling over, the slower than expected pace is causing market participants to increase their bets that the Federal Reserve will have to keep interest rates elevated for longer.
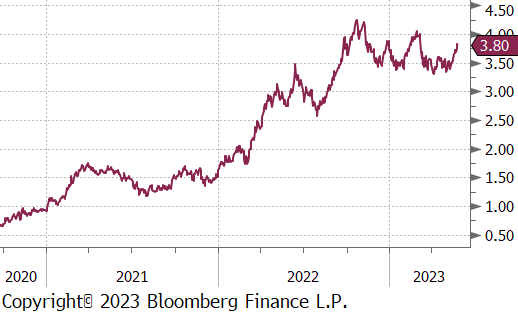
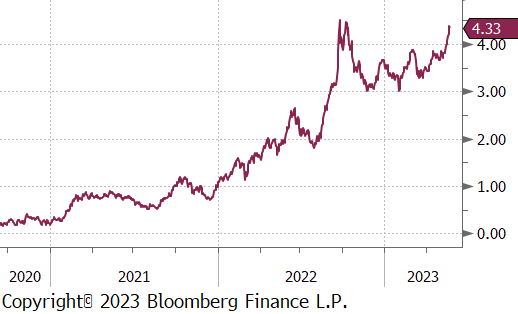
The U.K. is in a similar position; however, inflationary pressure is more pronounced across the pond. As a result, last week saw the British 10yr yield up 34-bps, an 8.5% increase from the prior week ending at 4.33%. This suggests that traders believe the BoE is likely not finished with their interest rate hiking cycle.