Flack Capital Markets | Ferrous Financial Insider
May 5, 2023 – Issue #378
May 5, 2023 – Issue #378
At the beginning of every month, there is a large group of data which provides context to recent steel demand and economic health. Since the beginning of the 4Q22, the murmurs of an impending severe recession have been growing, however, this month’s data suggest that the U.S. continues to hold up better than expectations (more on p.7).
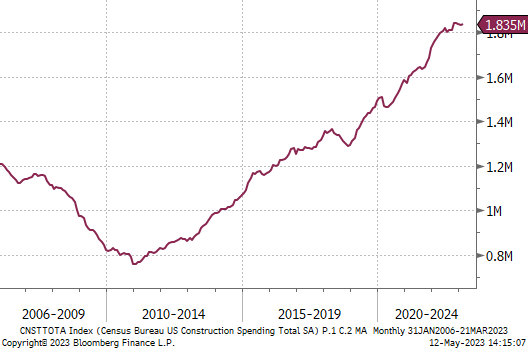
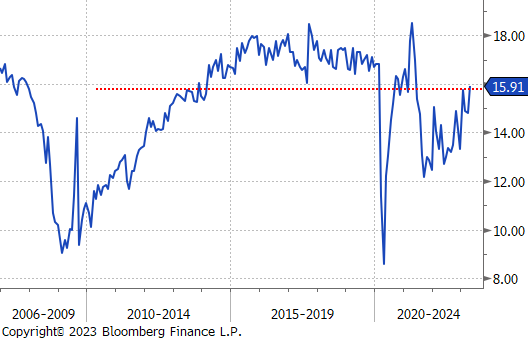
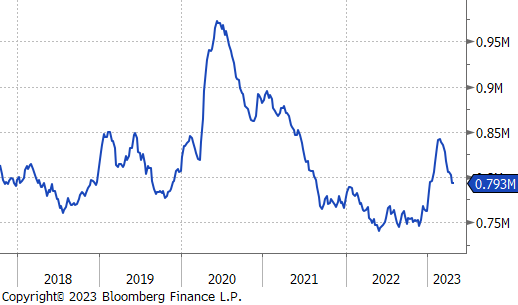
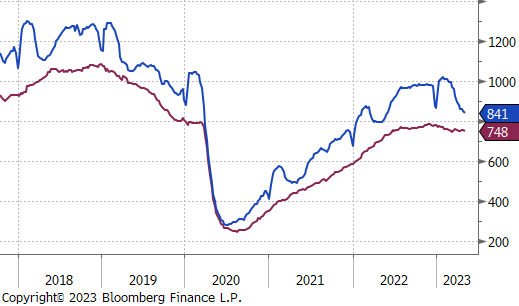
This week also had an FOMC meeting, culminating in another 25-bps rate hike, bringing interest rates to 5-5.25%. Tying that back to the steel sector, the two demand sectors (construction & autos) on the right have long been noted as the most interest rate sensitive. Starting with construction, the initial impact of rising rates was clear with the loss of upward momentum, however, rather than materially decelerating, spending continues to hold up – largely driven by YoY growth in non-residential spending. Autos on the other hand, have been a different story because of chips and supply chain issues predating the rate hikes. Here, concerns around demand for cars in a higher rate environment have been overpowered by the multiple year backlog. In April, it printed at an annualized rate of 15.91m units, just above the 10yr average prior to the pandemic (dotted red).
While it is important to note that both datasets are lagged, and that higher interest rates will be a strong headwind going forward, the clear takeaway up to this point is that the economy has been far more resilient than expectations. If you are “waiting it out,” you are leaving opportunities on the table.
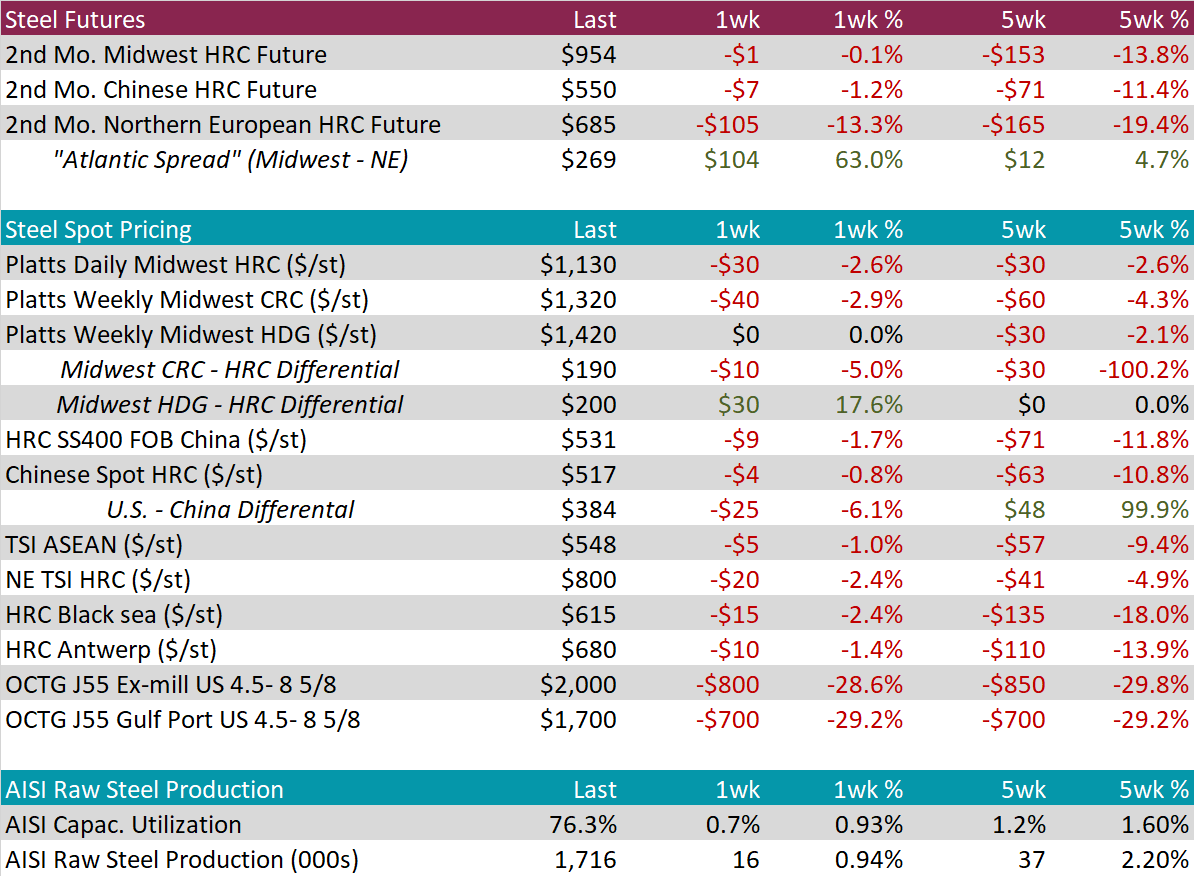
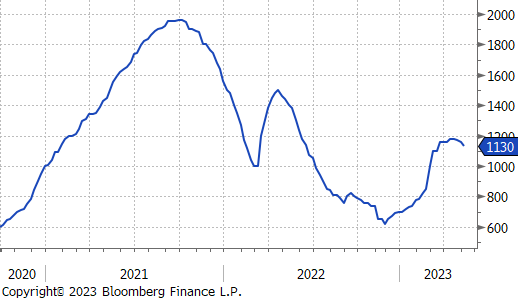
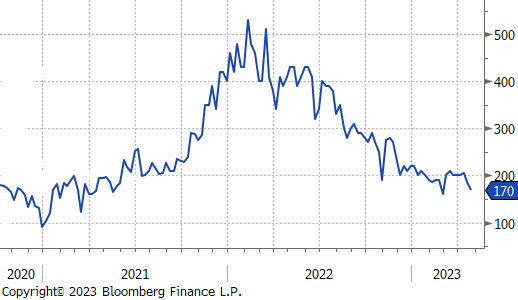
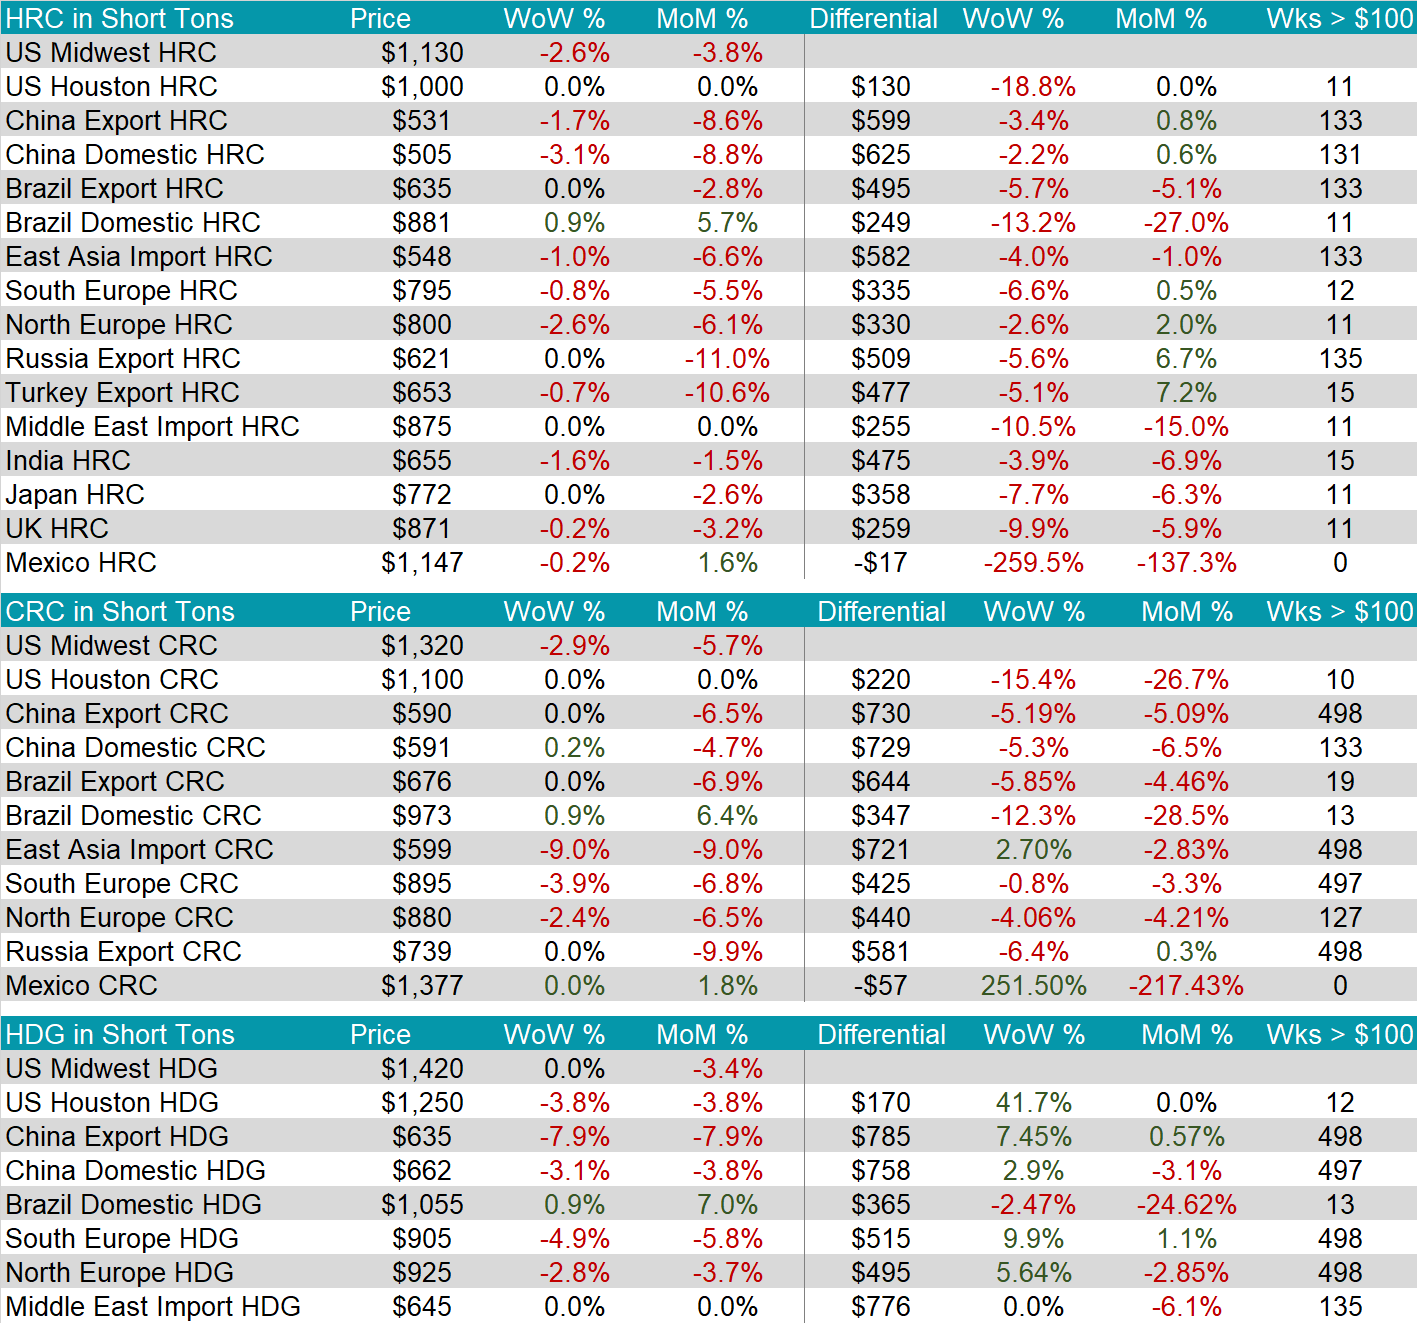
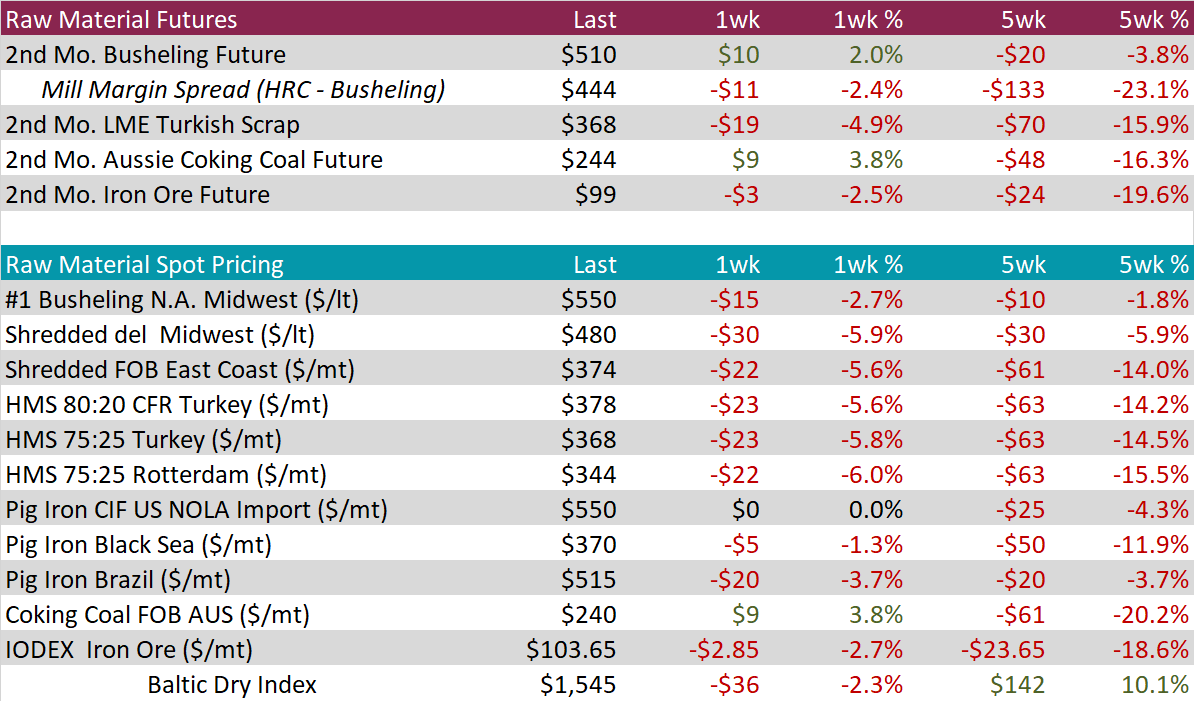
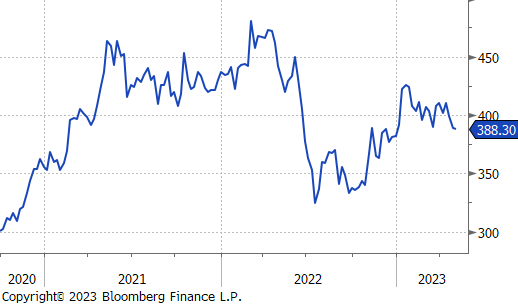
The HRC spot price took its first meaningful step lower since the rally began 22 weeks ago, with prices down $30 or 2.6%, last week. The 2nd month future (June) price was down slightly this week.
Tandem products were mixed this week with no change in HDG prices and CRC down 2.9%. That sad, lead times for HDG and HRC are nearly at parity, suggesting there is significantly more availability for tandem products in the spot market.
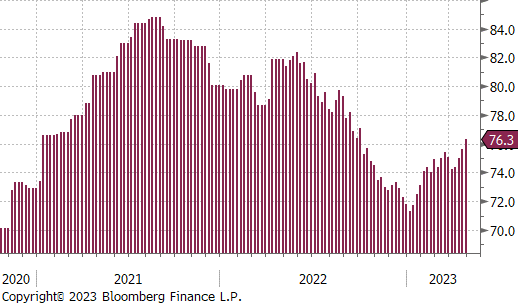
Domestic Production jumped this week, with utilization up 0.7% to 76.3%. This is its highest level since early October, last year.
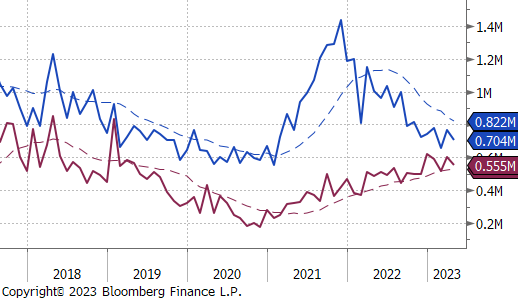
April Projection – Sheet 704k (down 61k MoM); Tube 555k (down 46k MoM)
March Census Data – Sheet 764k (up 106k MoM); Tube 601k (up 82k MoM)
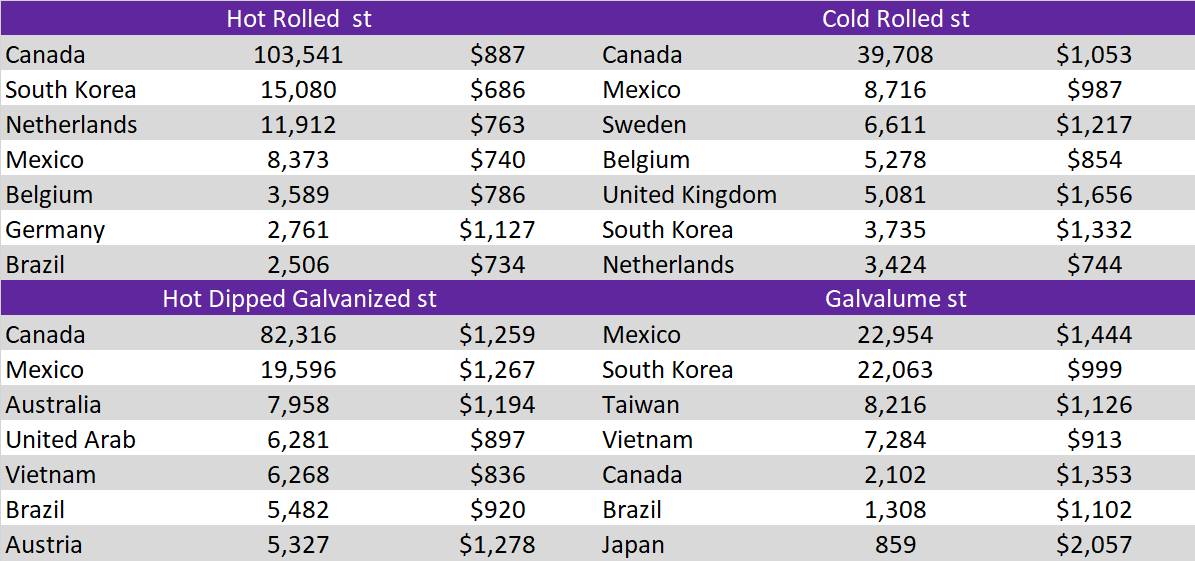
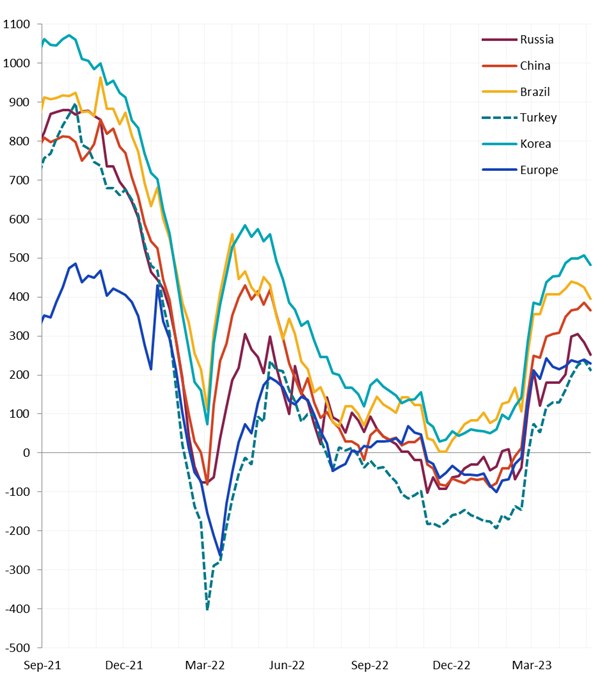
Global differentials were lower across the board this week, with the U.S. domestic price leading the rest of the world lower.
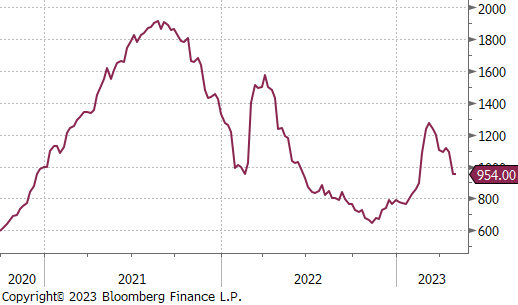
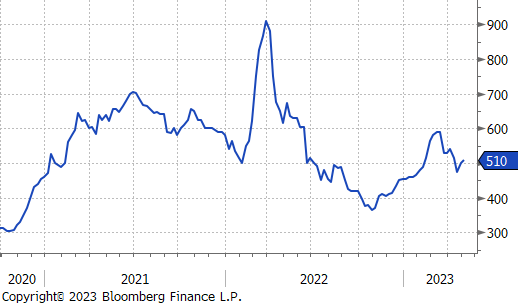
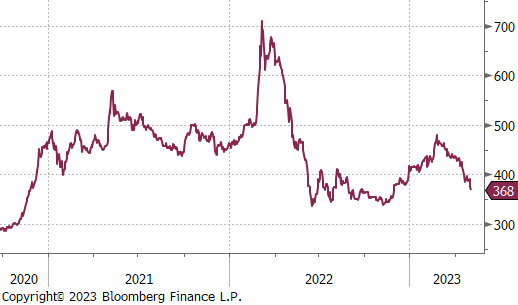
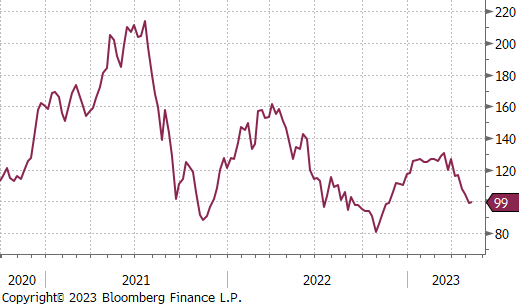
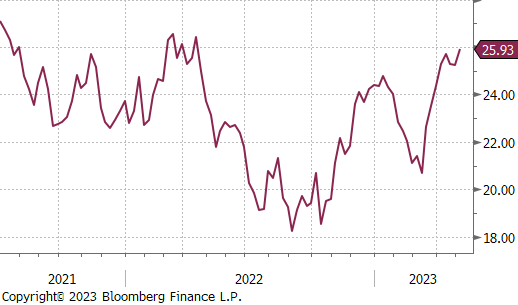
The 2nd month Busheling future rose $10 on the week, while the spot price fell $15 or 2.7%. The 2nd month Turkish scrap future lost $19, or 4.9% on the week and continued its recent downtrend. Finally, the corresponding iron ore future lost another $3, it’s now lost 16.3% over the last 5 weeks.
Dry Bulk / Freight
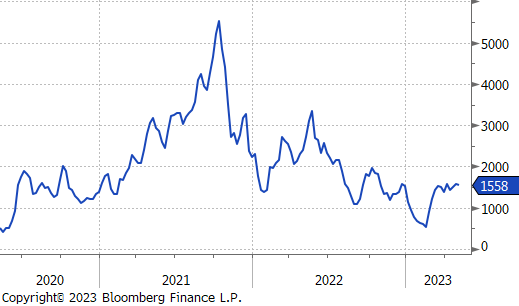
Baltic dry index was down 2.3% this week, but it continues to trade in a tight range since the beginning of March.
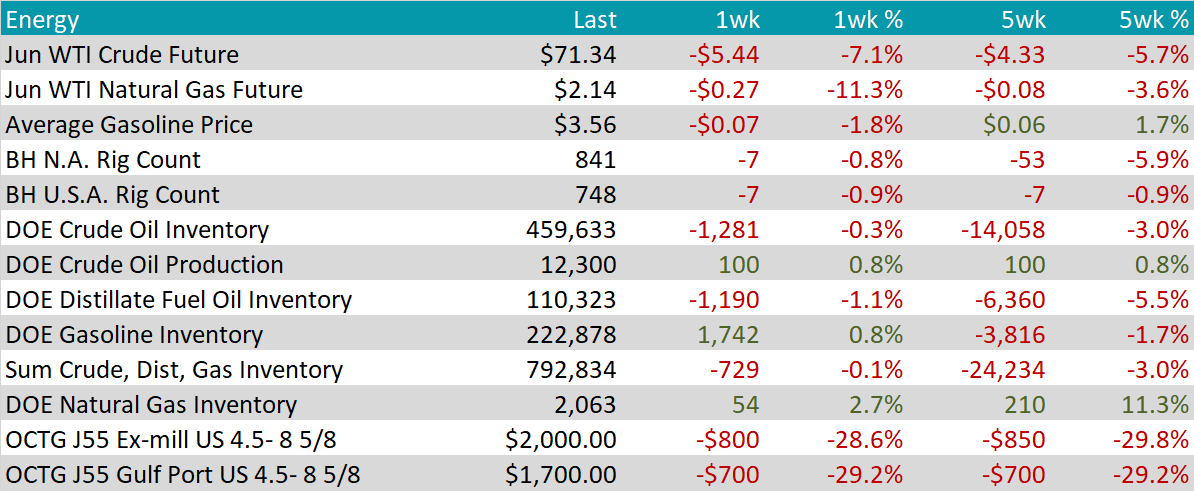
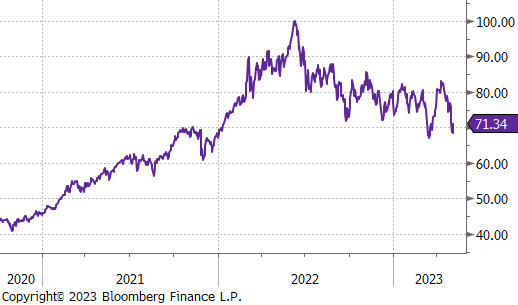
WTI crude oil future lost $5.44 or 7.1% to $71.34/bbl.
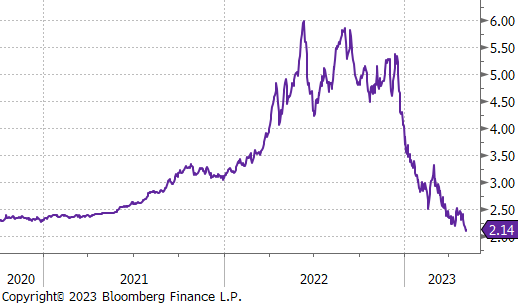
WTI natural gas future lost $0.27 or 11.3% to $2.14/bbl.
The aggregate inventory level fell further, down 0.1% this week and 3% over the last 5 weeks.
The Baker Hughes North American and U.S. rig count we both down 7 rigs last week. Over the last 5 weeks, the overall North American rig count has fallen far more significantly, down 53 rigs, compared to only 7 in the U.S.
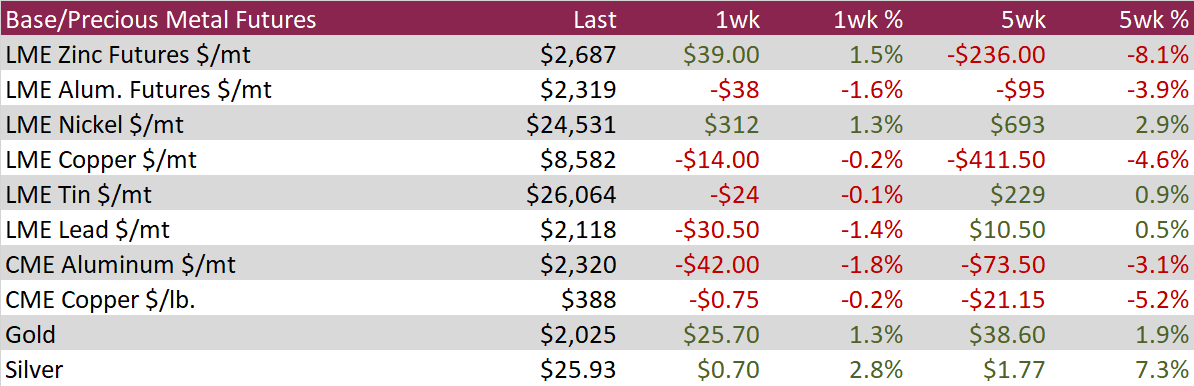
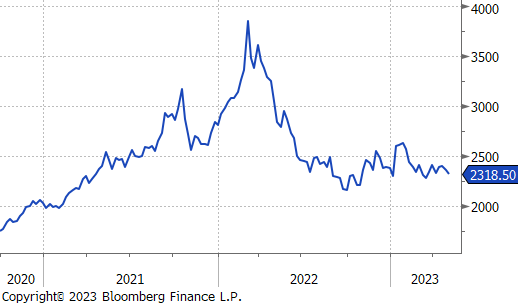
Aluminum futures on the LME fell 1.6% during the week along with most other industrial metals. Banking troubles in the US and mixed data out of China weighed on commodity prices and saw aluminum trade to the lowest price in approximately 7 weeks. In industry news, Apollo Global agreed to acquire aluminum company Arconic Corporation.
Copper futures traded mostly flat during the week, closing slightly lower and extending a 3-week slide. Macro fears weighed over the copper market as the state of the US banking system remains in question, the Federal reserve hinted at further rate pauses, and data out of China painted a mixed picture. Money managers have increased their bearish Comex Copper bets by 5,178 net short positions, bringing the net-short position to the most bearish in more than 8 months.
Silver ended the week 2.8% higher, its largest one-week percentage gain since the week ending April 6th and snapping a two-week losing streak. Silver performed well on a weaker dollar and as investors sought out save haven assets amidst renewed concerns over the banking sector. Money managers increased their net-bullish bets to the most bullish in 15 weeks, with long-only positions at the highest level in more than a year.
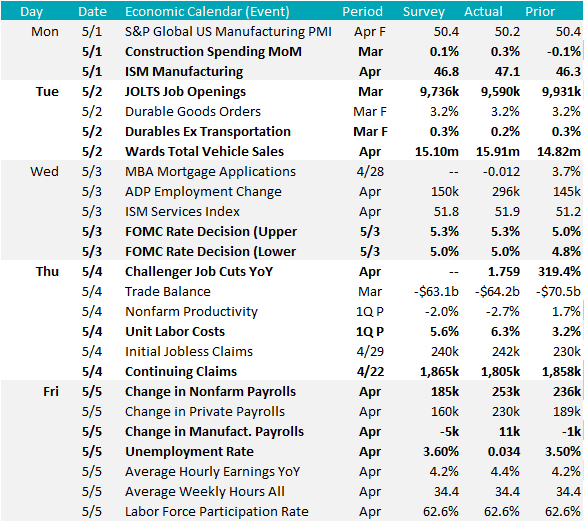
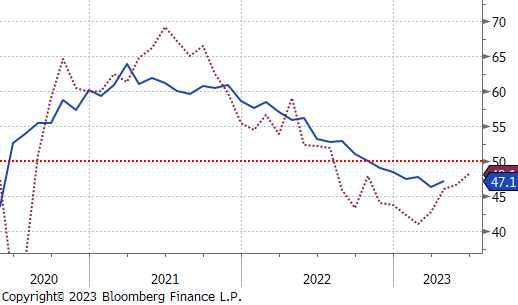
The April ISM Manufacturing PMI printed at 47.1, better than expectations of 46.8. Looking more closely at the data, bright spots are starting to emerge as new orders, production, and employment all printed higher than in March. Furthermore, the demand minus inventories leading indicator suggests the headline number should continue to improve going forward.
Additionally, durable goods new orders ex. transportation printed slightly below expectations but remains in positive territory.
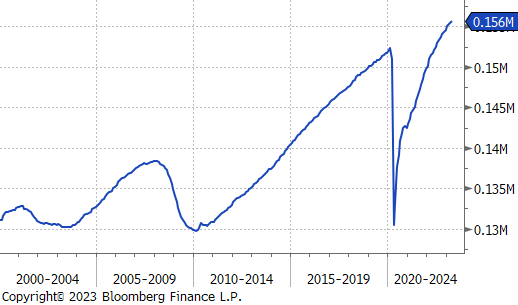
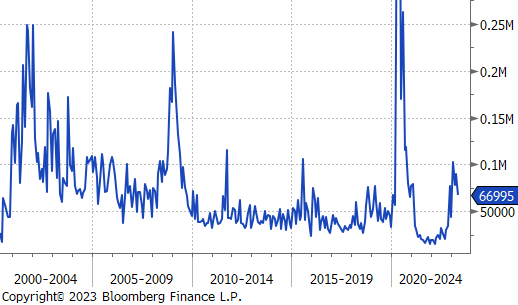
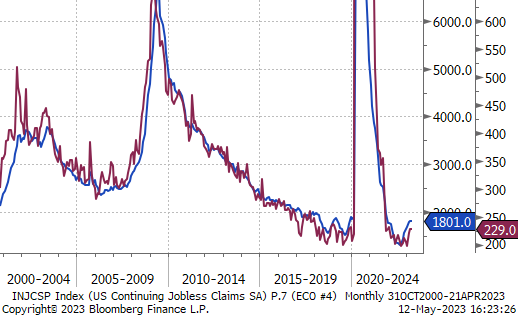
Labor market data continues to come in far hotter than expectations. The change in nonfarm payrolls shows that the economy added 253k, versus expectations of 185k. This is the 13th month in a row where payrolls beat expectations. At the same time, it is important to note that a trend has started over the last three months of lower revisions to the prior month, signaling that some of the upside surprise will likely be revised lower next month. On the right we show total payrolls to provide additional context for just how strong payrolls currently are. Additionally, the unemployment rate printed lower, at 3.4%, beating expectations of a slight increase to 3.6%. Earlier in the week, we saw the YoY challenger jobs cut announcements continue to decelerate. This is shown in the chart at an absolute level to, again, provide additional context. While elevated, announcements are not at concerning levels compared to historical norms and have even begun decelerating. Finally, initial and continuing jobless claims continue to show a cooling labor market, but also one at a historically strong level.
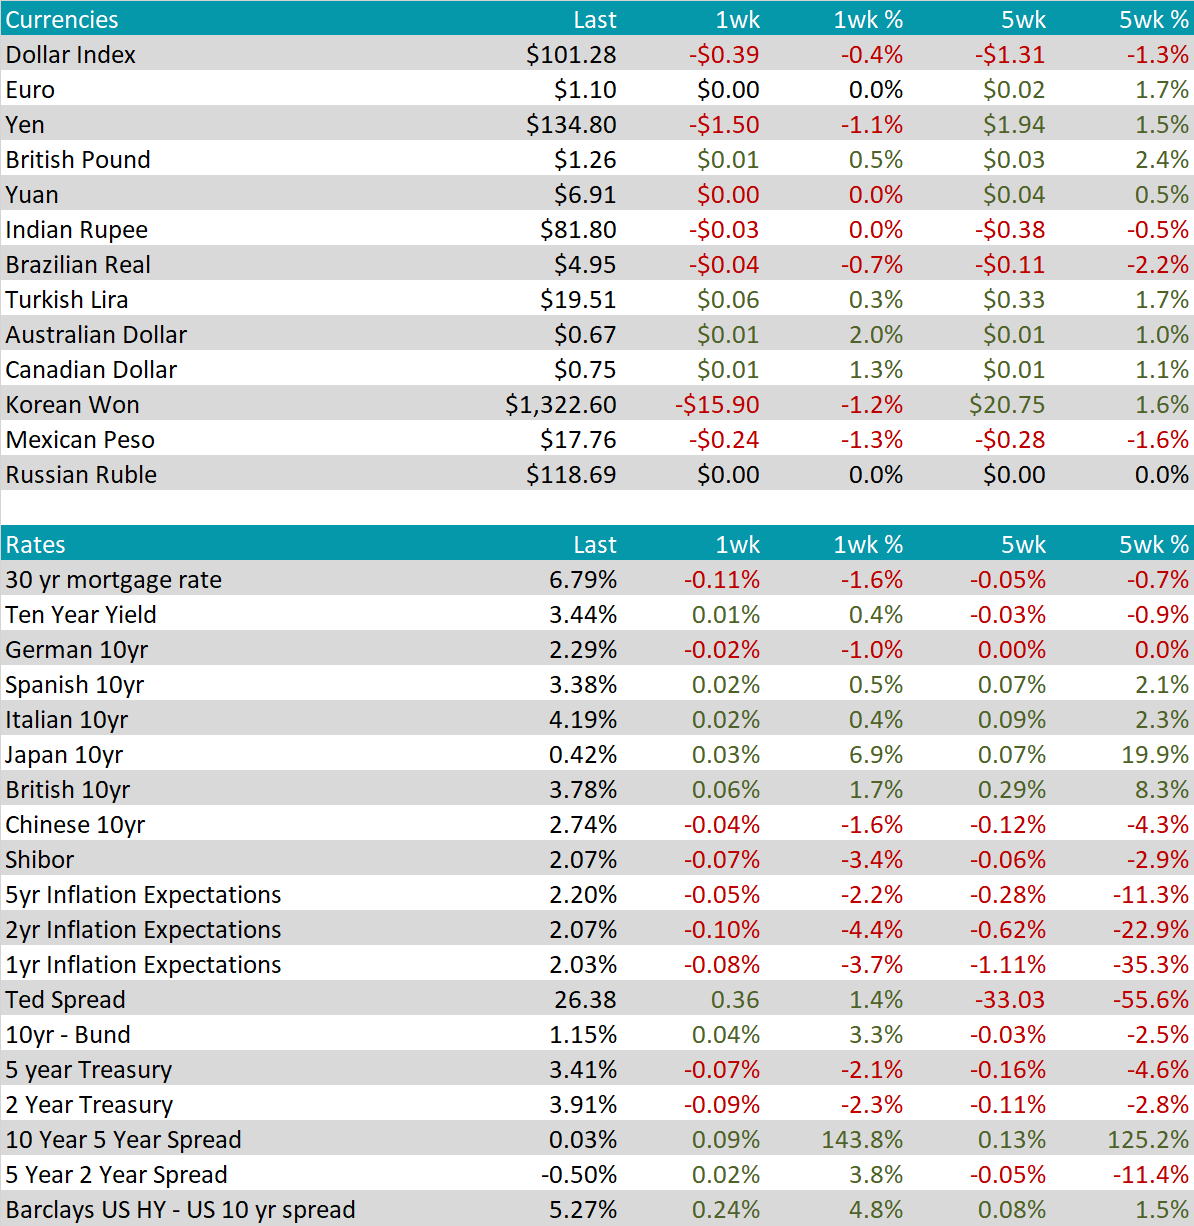
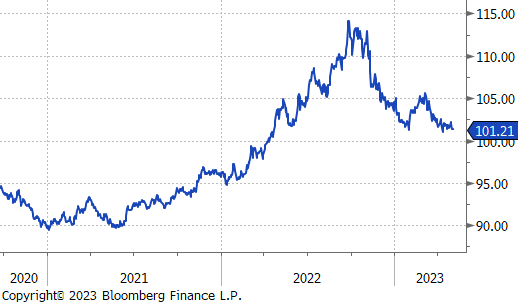
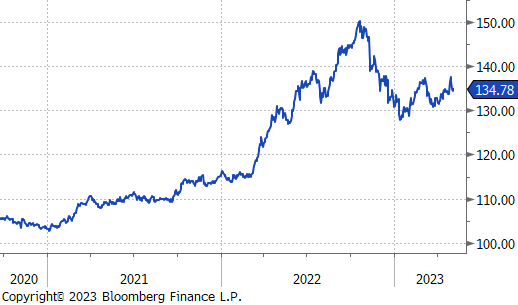
The dollar lost $0.39, down to $101.28, while the yen appreciated significantly against the dollar, driven by increased expectations for cuts from the FOMC, as well as concerns that high inflation in Japan will force the Bank of Japan to raise their interest rates and move away from ultra easy policy. The euro rallied against the USD as market participants anticipate even more rate cuts from the US Federal Reserve. This comes after more concerns in the US regional banking sector.
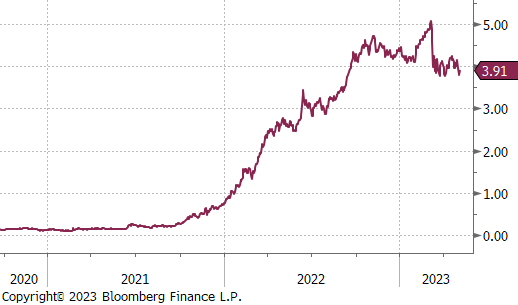
US treasury bond yields fell significantly after the Fed meeting on the belief the Fed has reached the end of its tightening campaign. However, the short-term rally in bonds ended Friday after strong labor market data. Yields climbed after jobs data showed hiring and wages remain elevated. The 2yr yield surged to 3.91% from 3.73% in response to the data. Investors remain uncertain about the path forward for the economy with the conversation oscillating between banking stability, labor markets, and inflation.