Flack Capital Markets | Ferrous Financial Insider
November 1, 2024 – Issue #456
November 1, 2024 – Issue #456
Overview:
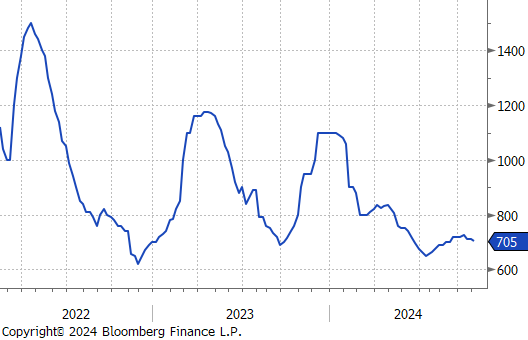
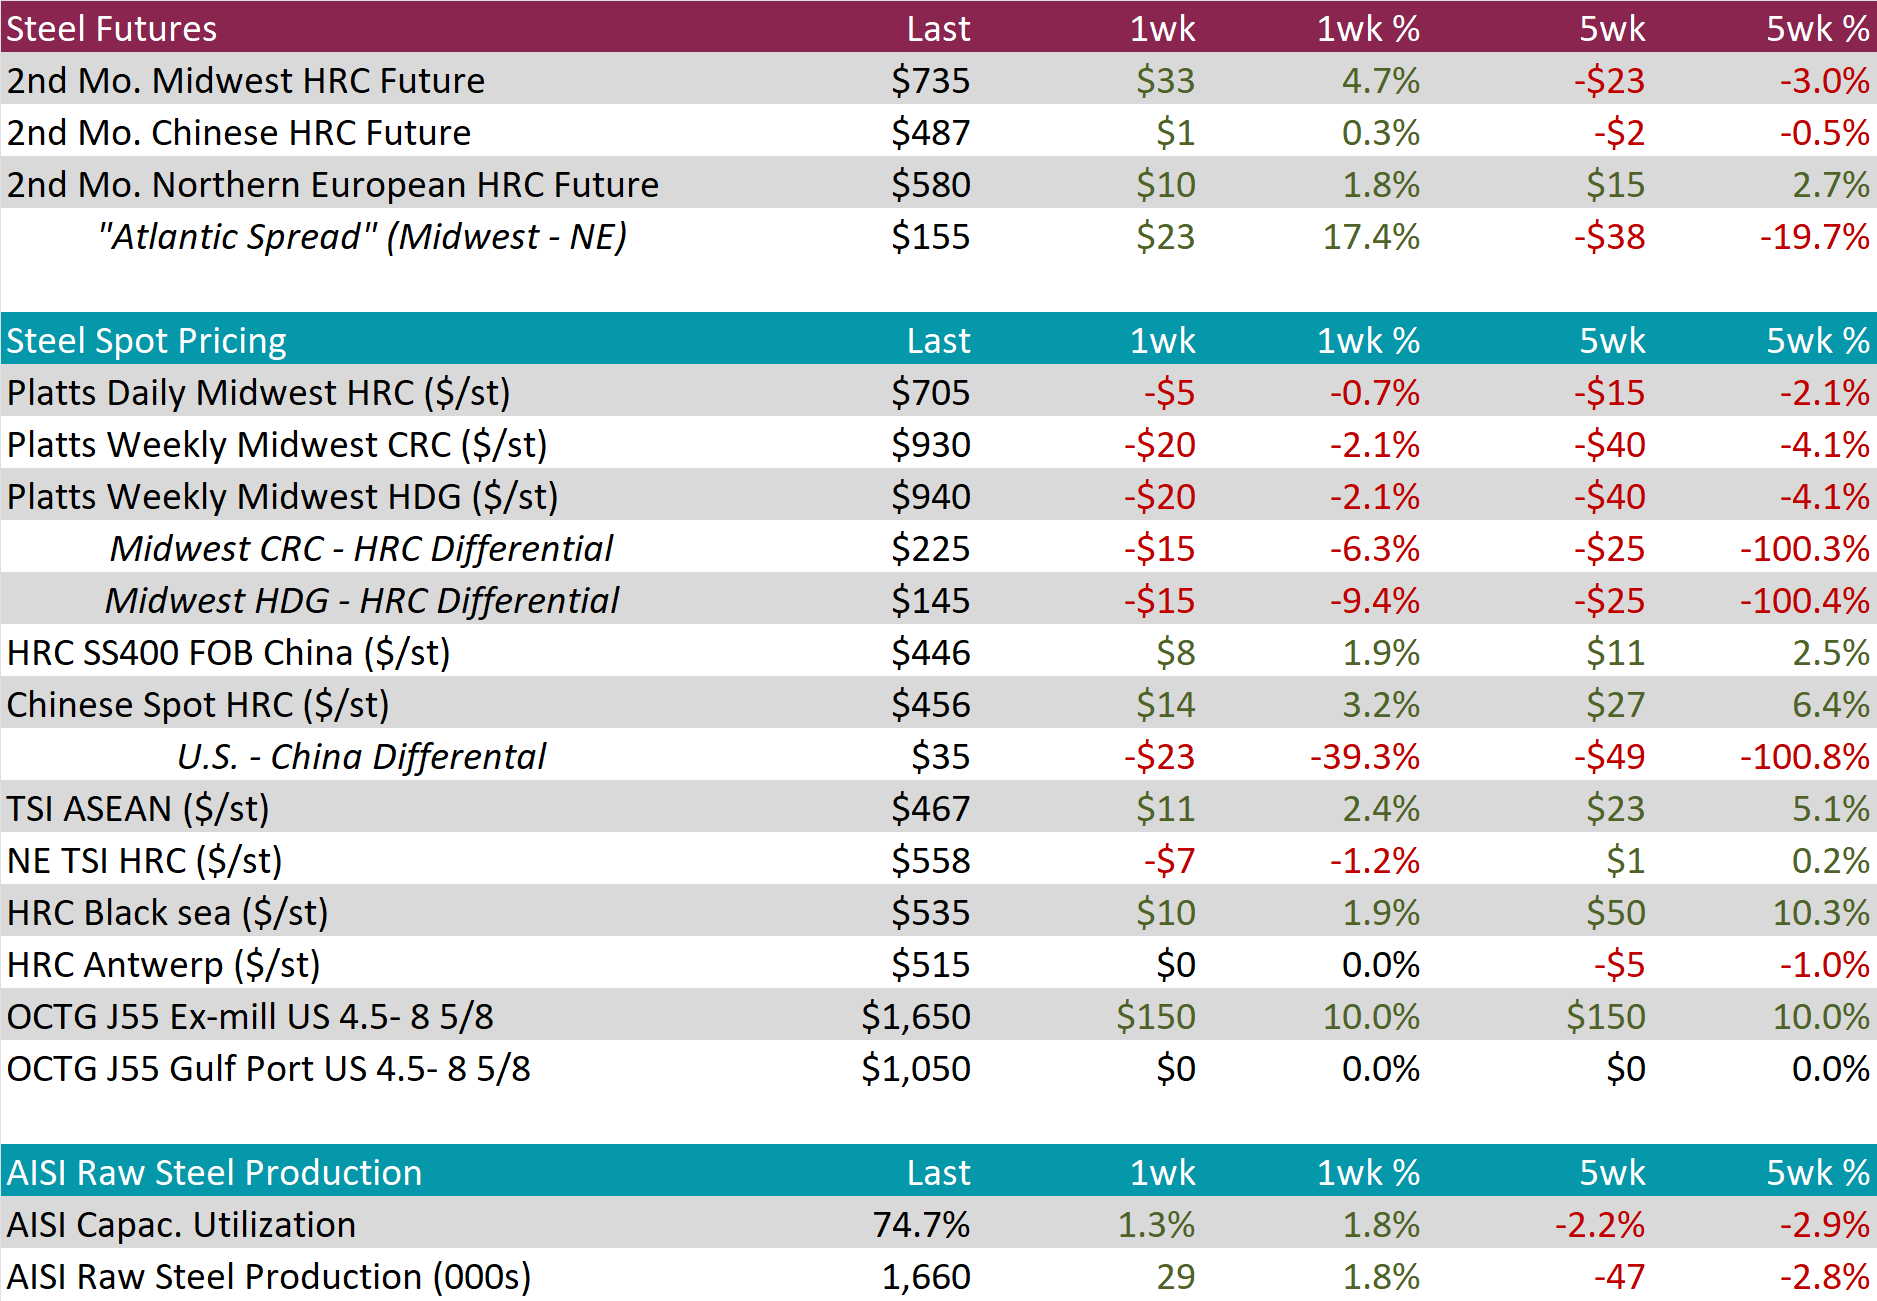
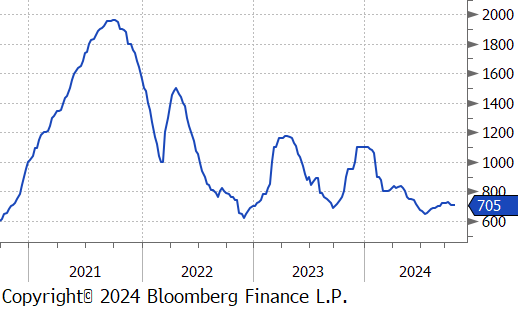
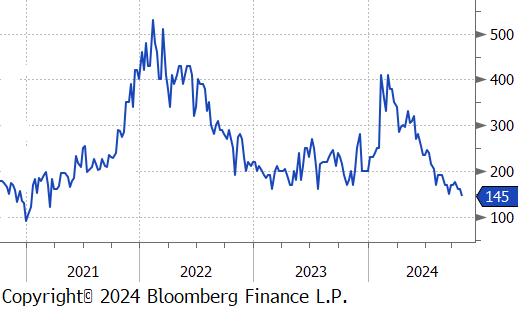
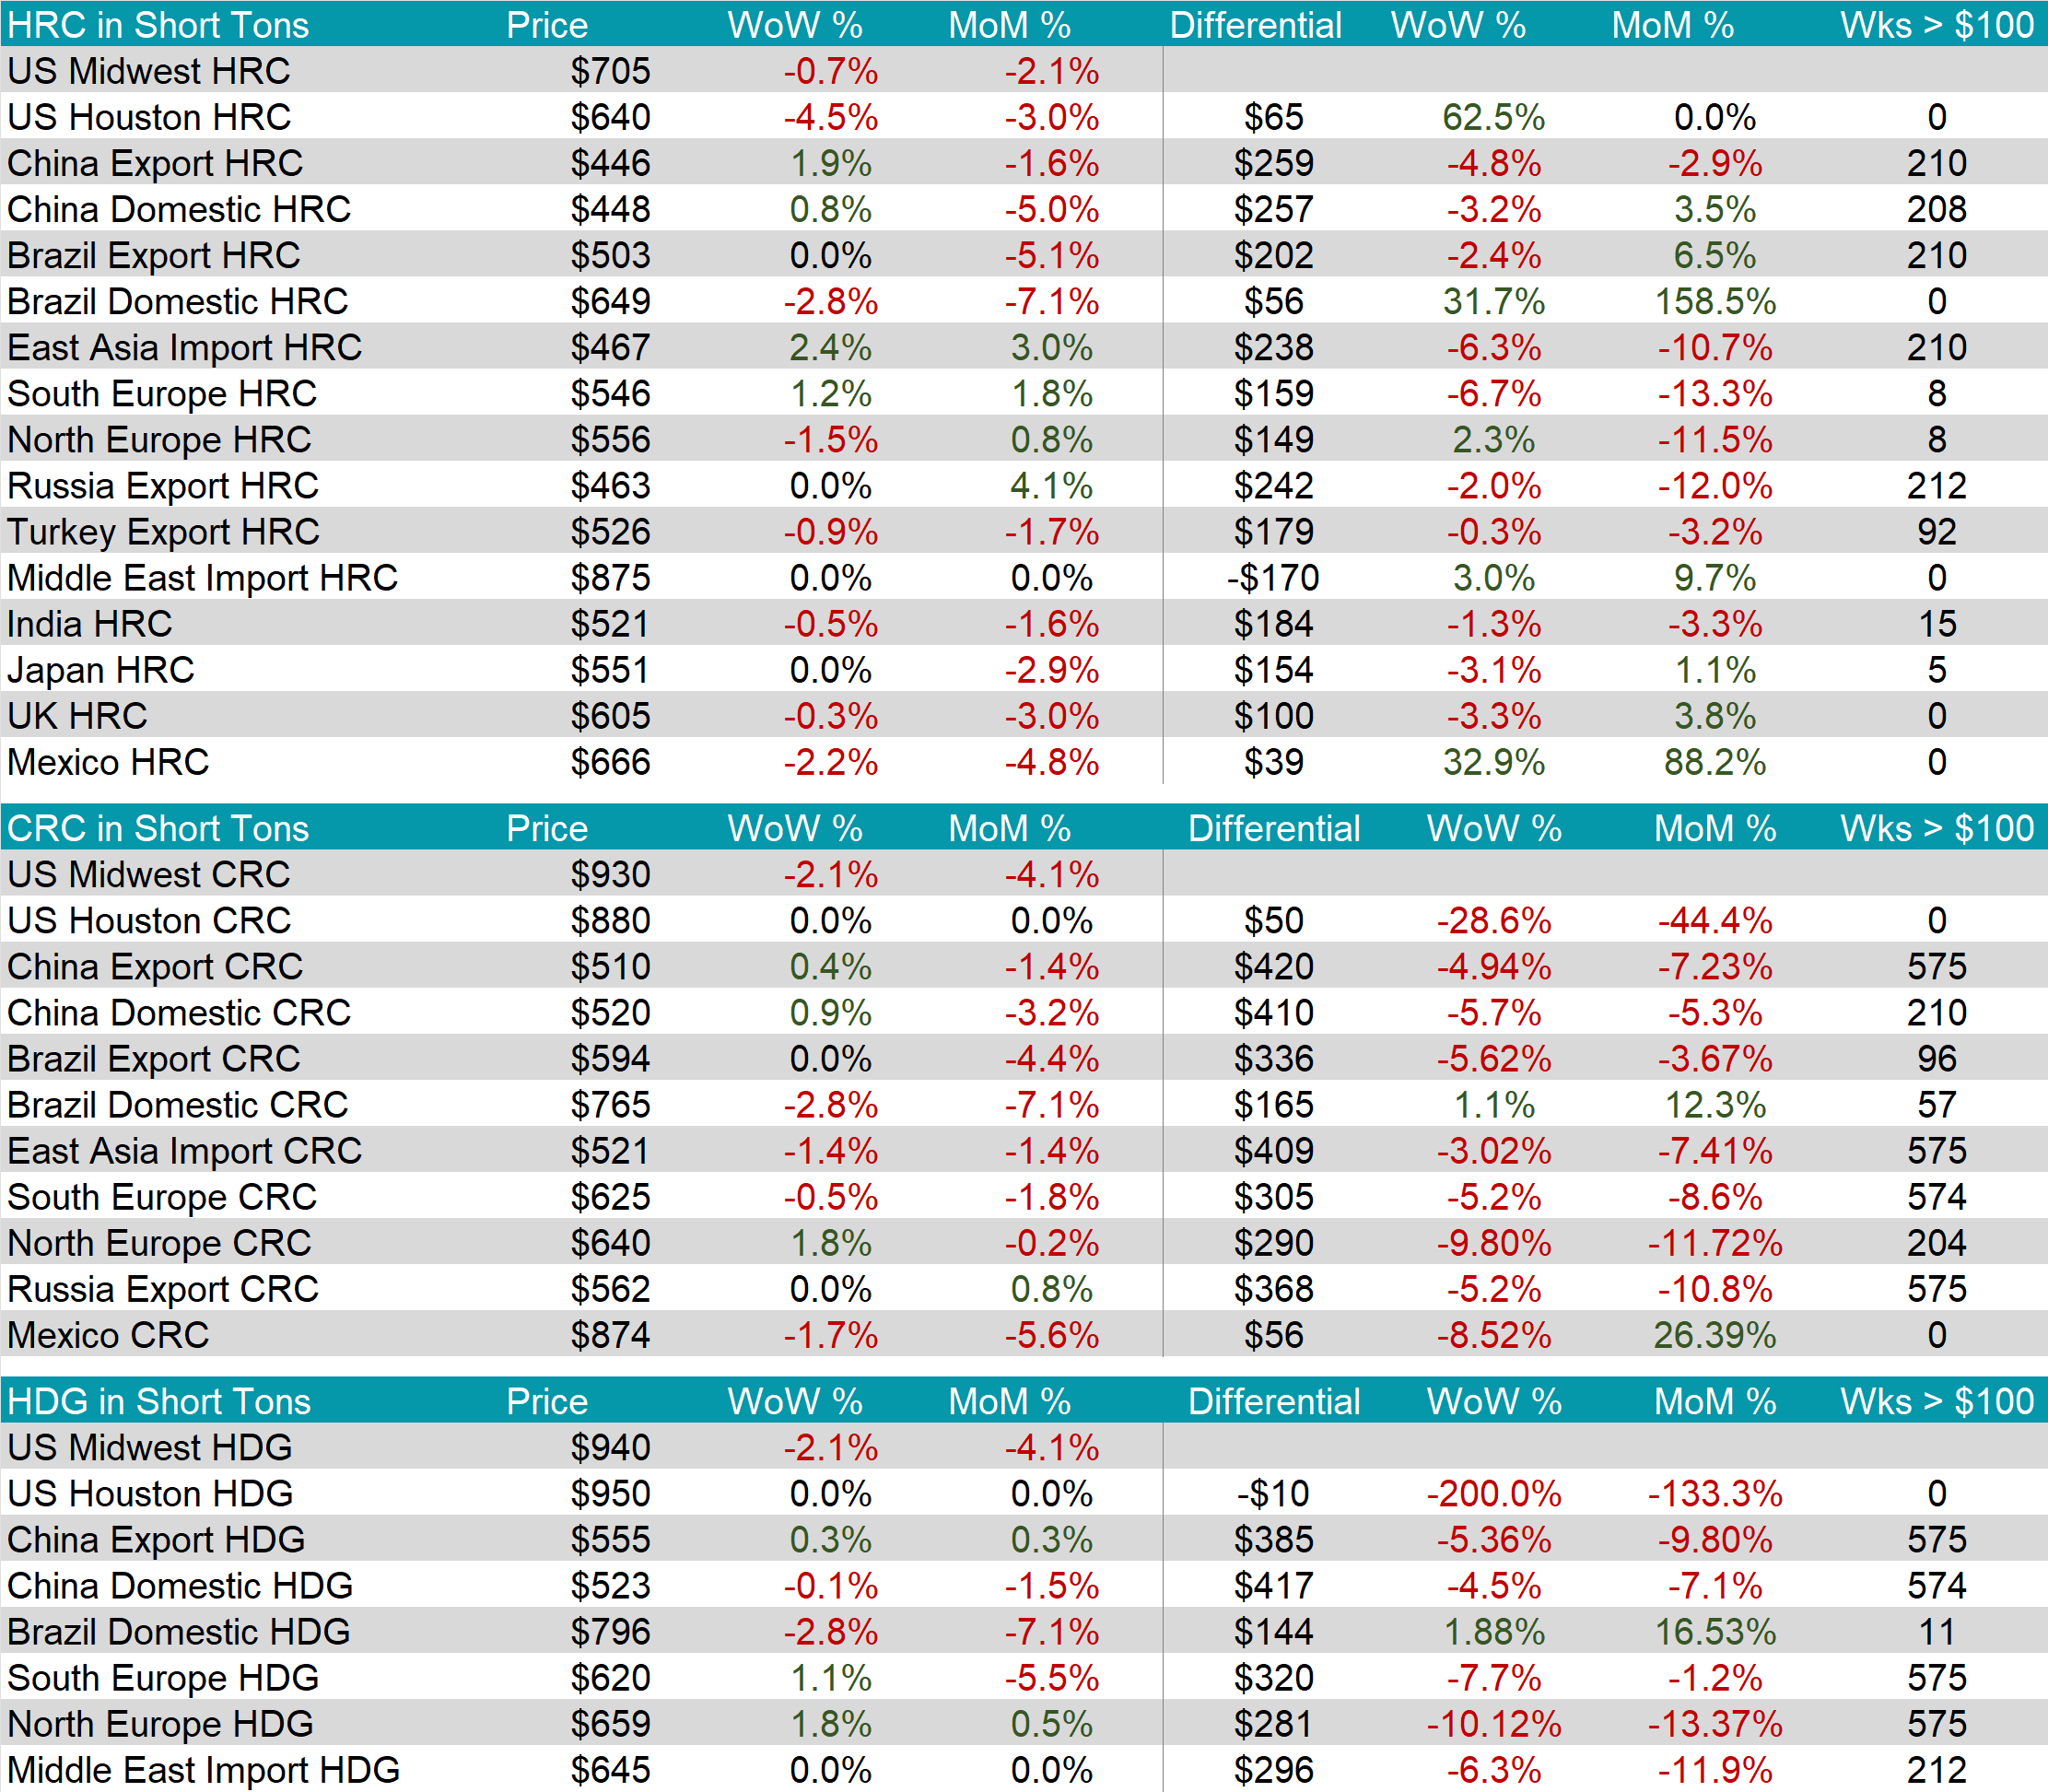
The HRC spot price fell by $5 or -0.7% to $705, reaching the lowest level since late August. At the same time, the HRC 2nd month future jumped up by $33 or 4.7% to $735, ending the recent down trend.
Tandem products both declined by $20, resulting in the HDG – HRC different is decrease by $15 or -9.4% to $145
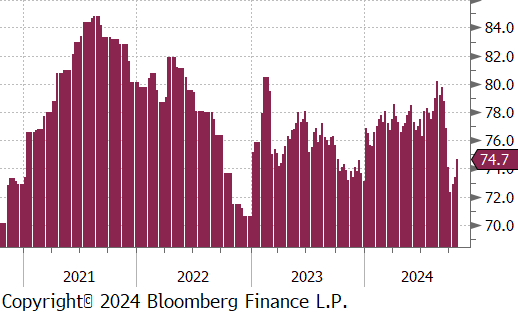
Mill production remained subdued despite capacity utilization ticking up by 1.3% to 74.7%, bringing raw steel production up to 1.660m net tons.
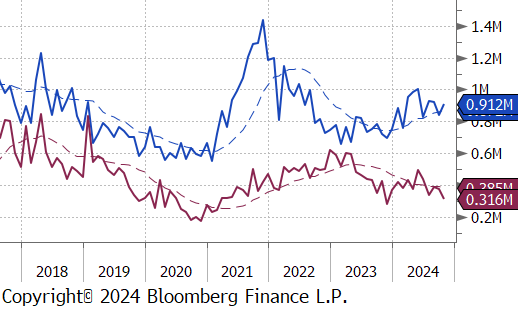
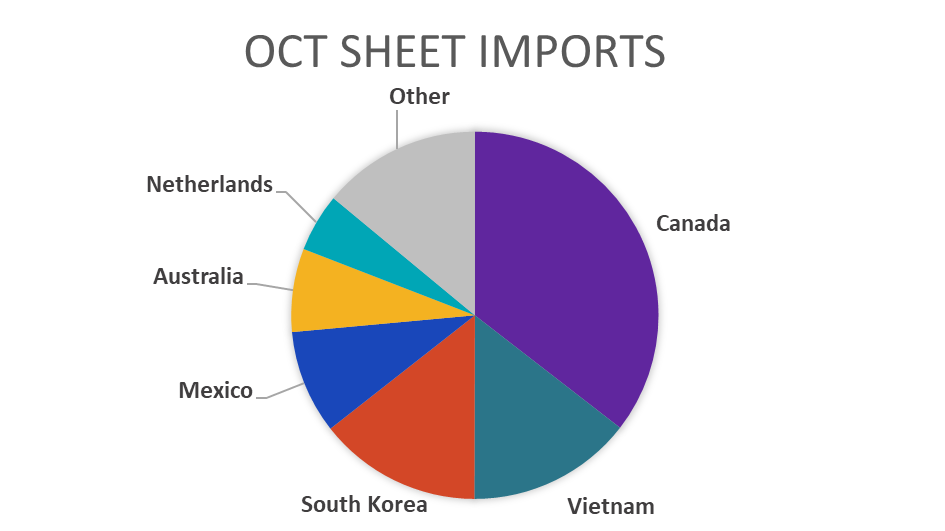
October Projection – Sheet 912k (up 71k MoM); Tube 316k (down 58k MoM)
September Census – Sheet 841k (down 78k MoM); Tube 373k (down 15k MoM)
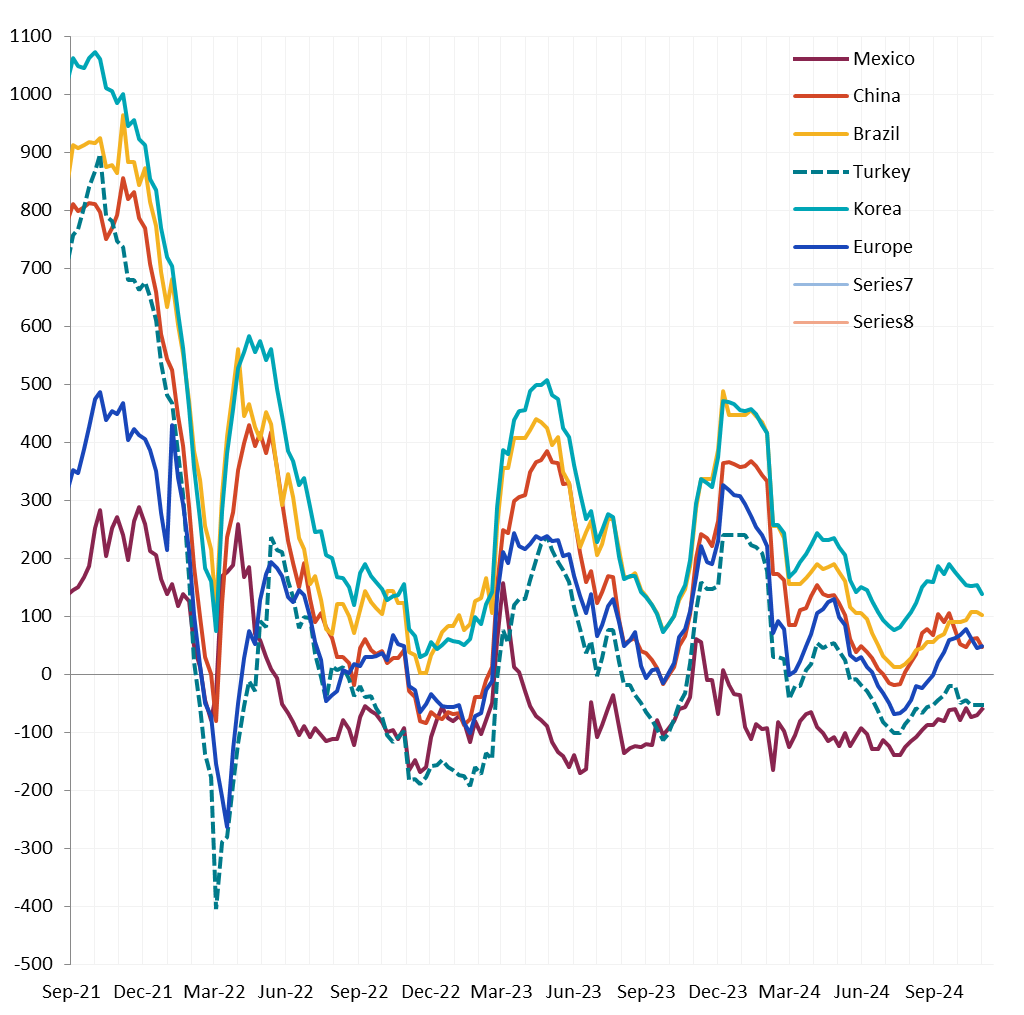
Watched global differentials largely contracted this week, with China Export HRC rising by 1.9%, Korea’s HRC up by 2.4%, while both North Europe HRC and Turkey Export HRC fell, -1.5% and -0.9%, respectively.
Scrap
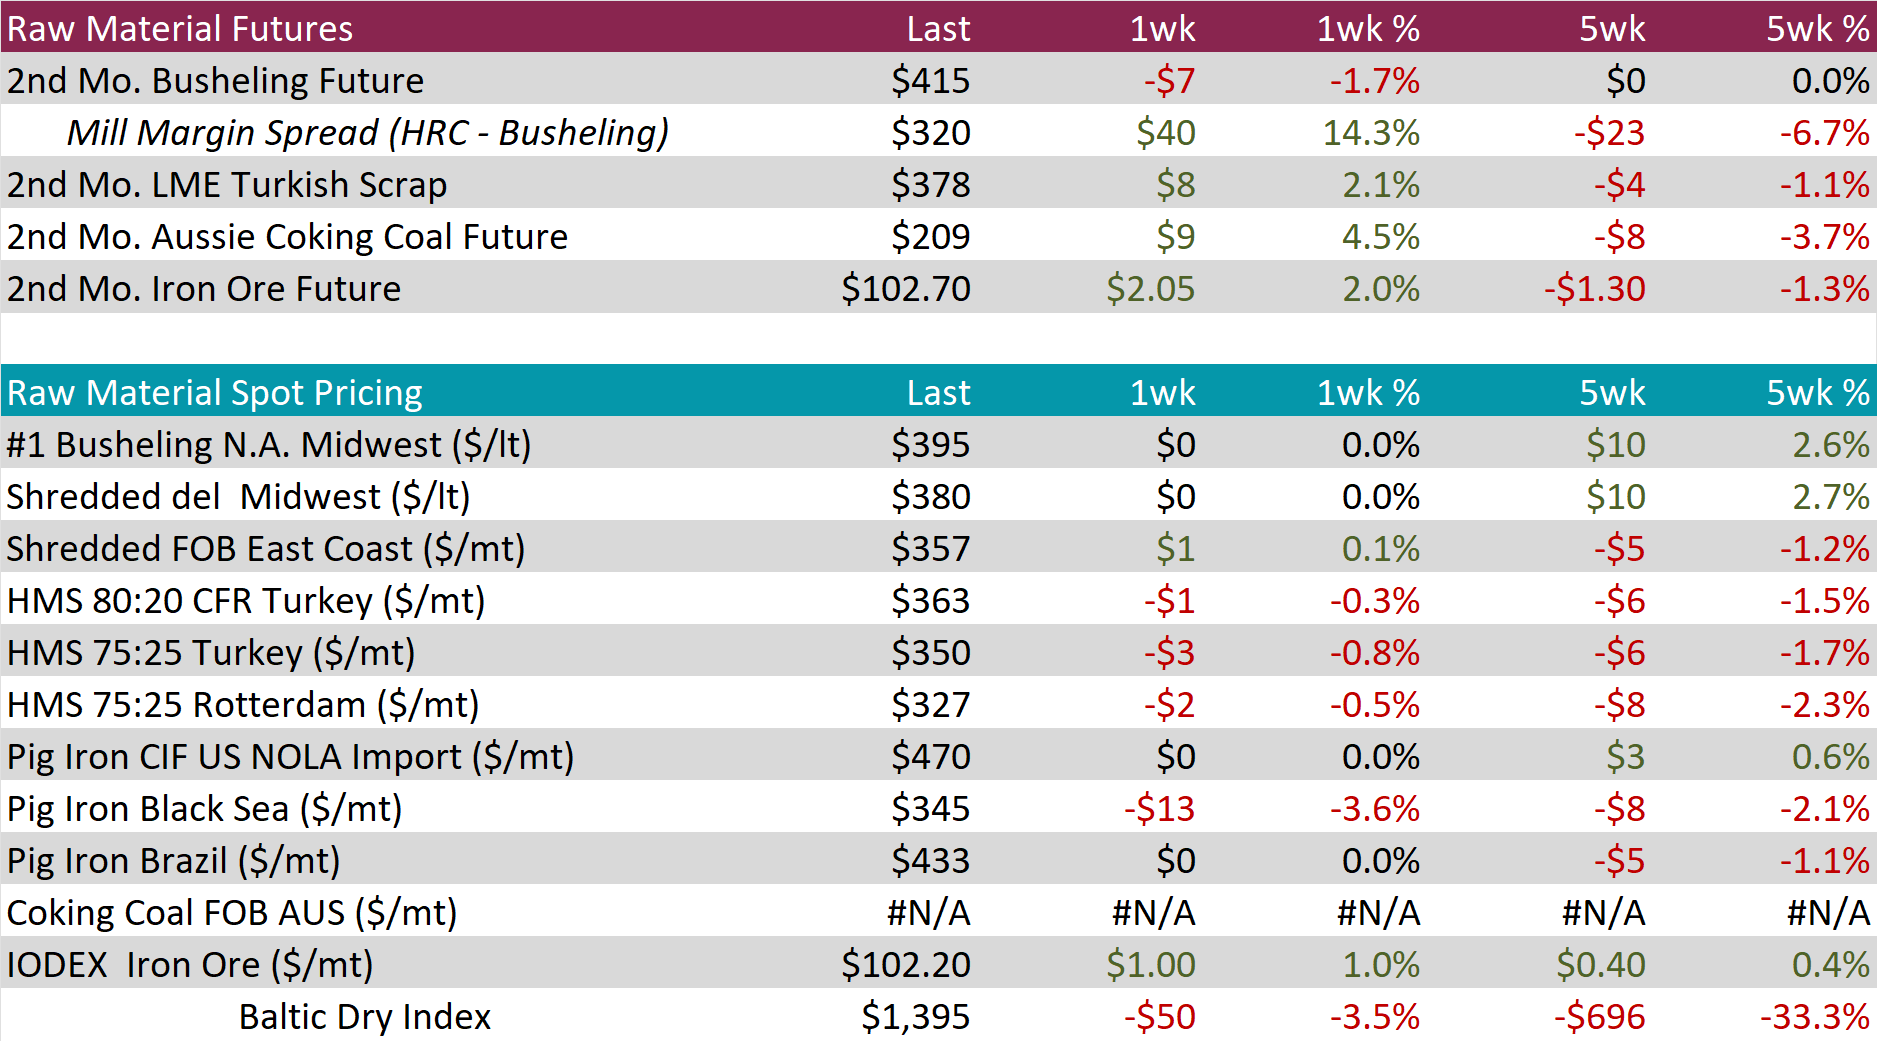
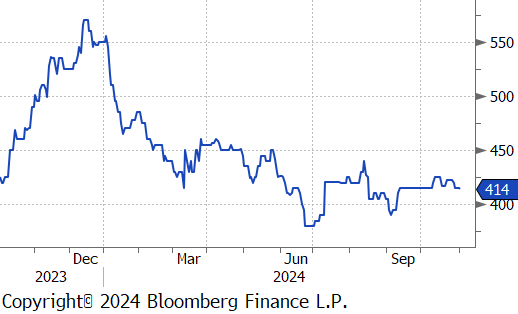
The busheling 2nd month future declined by $7 or -1.7% to $415, ending the recent upward trend.
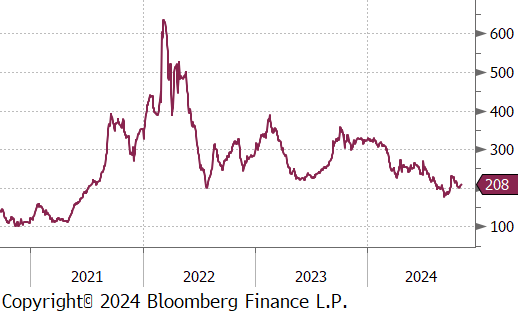
The Aussie coking coal 2nd month future rose by $9 or 4.5% to $209, rebounding from three consecutive weeks of price decreases.
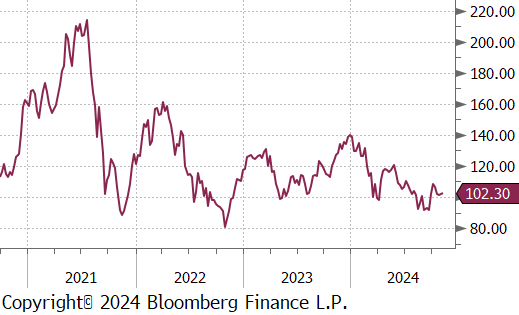
The iron ore 2nd month future increased by $2.05 or 2.0% to $102.70, however, the five-week price change continues to be down by $1.30 or -1.3%.
Dry Bulk / Freight
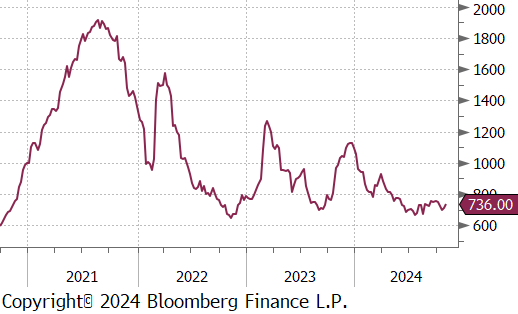
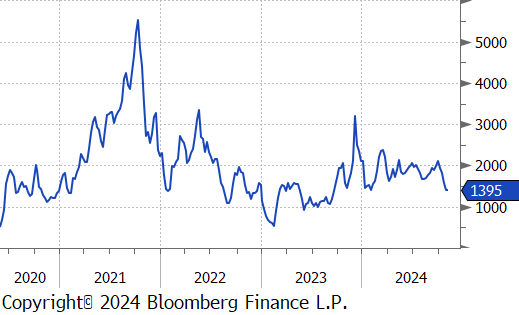
The Baltic Dry Index fell by $50 or -3.5% to $1,395, marking the fifth consecutive week of declines.
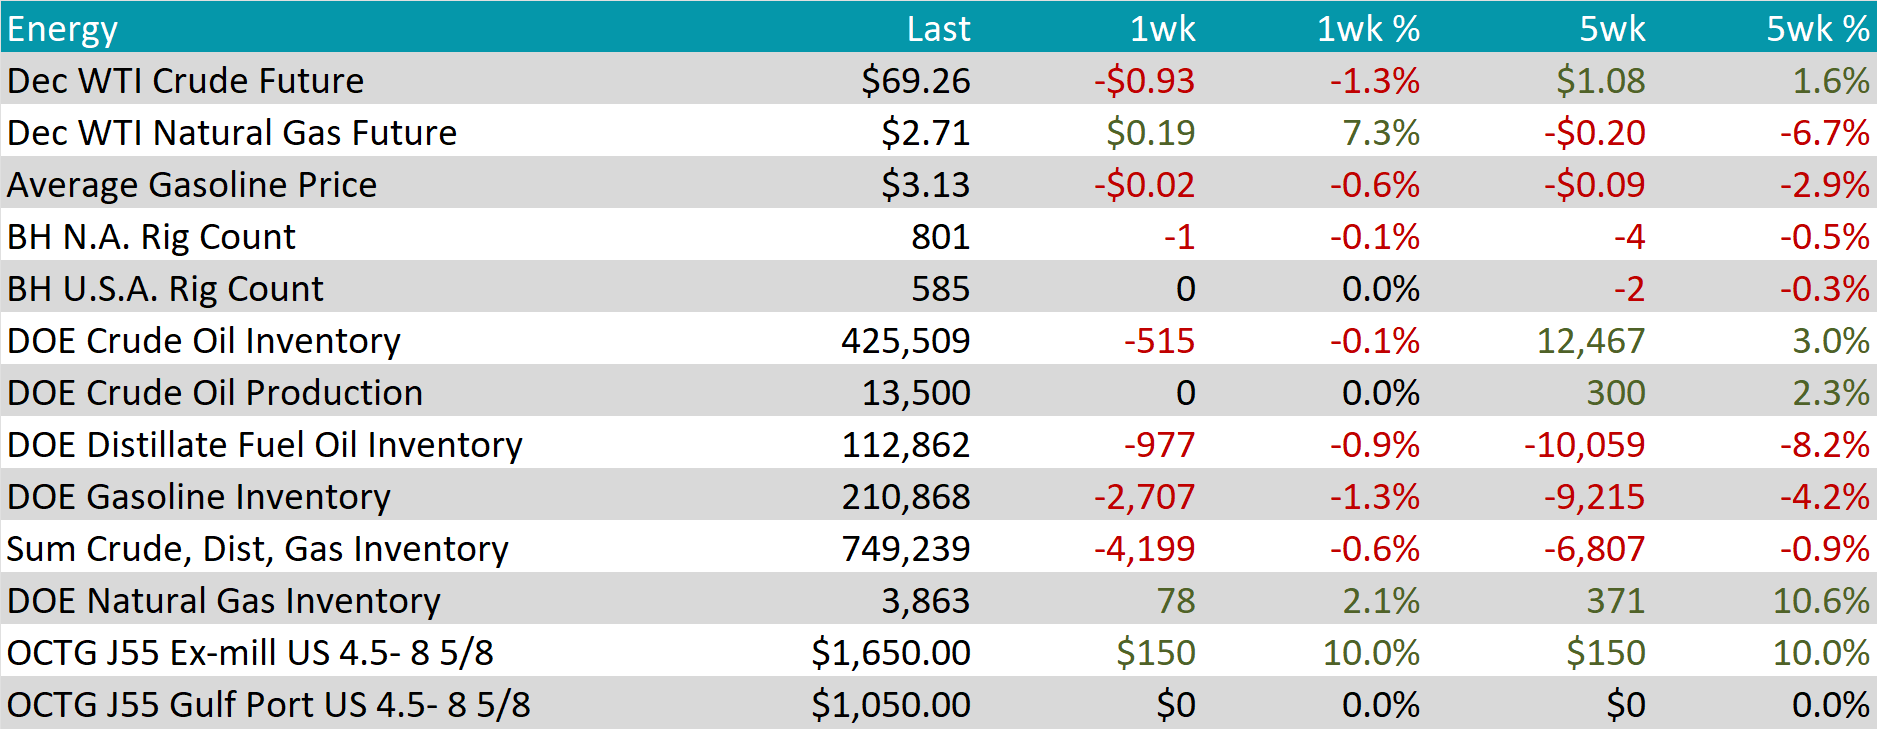
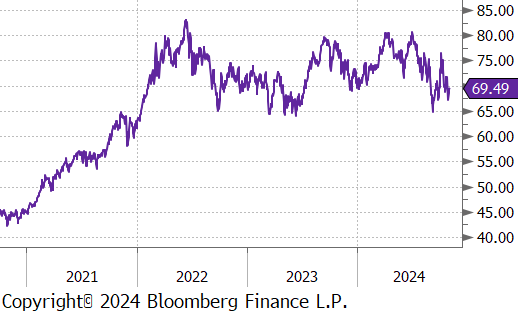
WTI crude oil future lost $0.93 or -1.3% to $69.26/bbl.
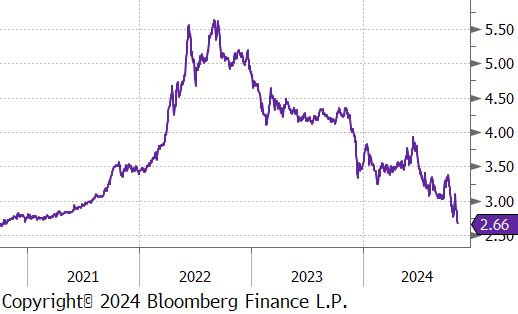
WTI natural gas future gained $0.19 or 7.3% to $2.71/bbl.
The aggregate inventory level experienced another decline, this time slipping by -0.6%.
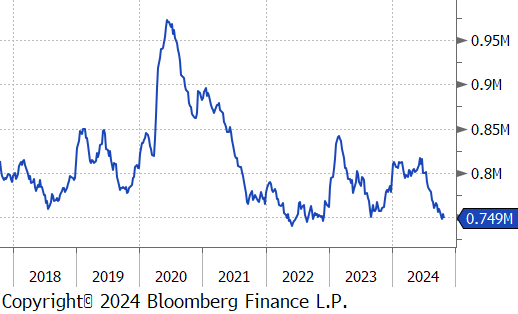
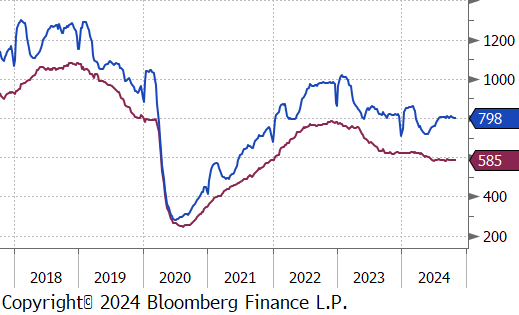
The Baker Hughes North American rig count reduced by 1 rig, bringing the total count to 801 rigs. At the same time, the US rig count held steady at 585 rigs.
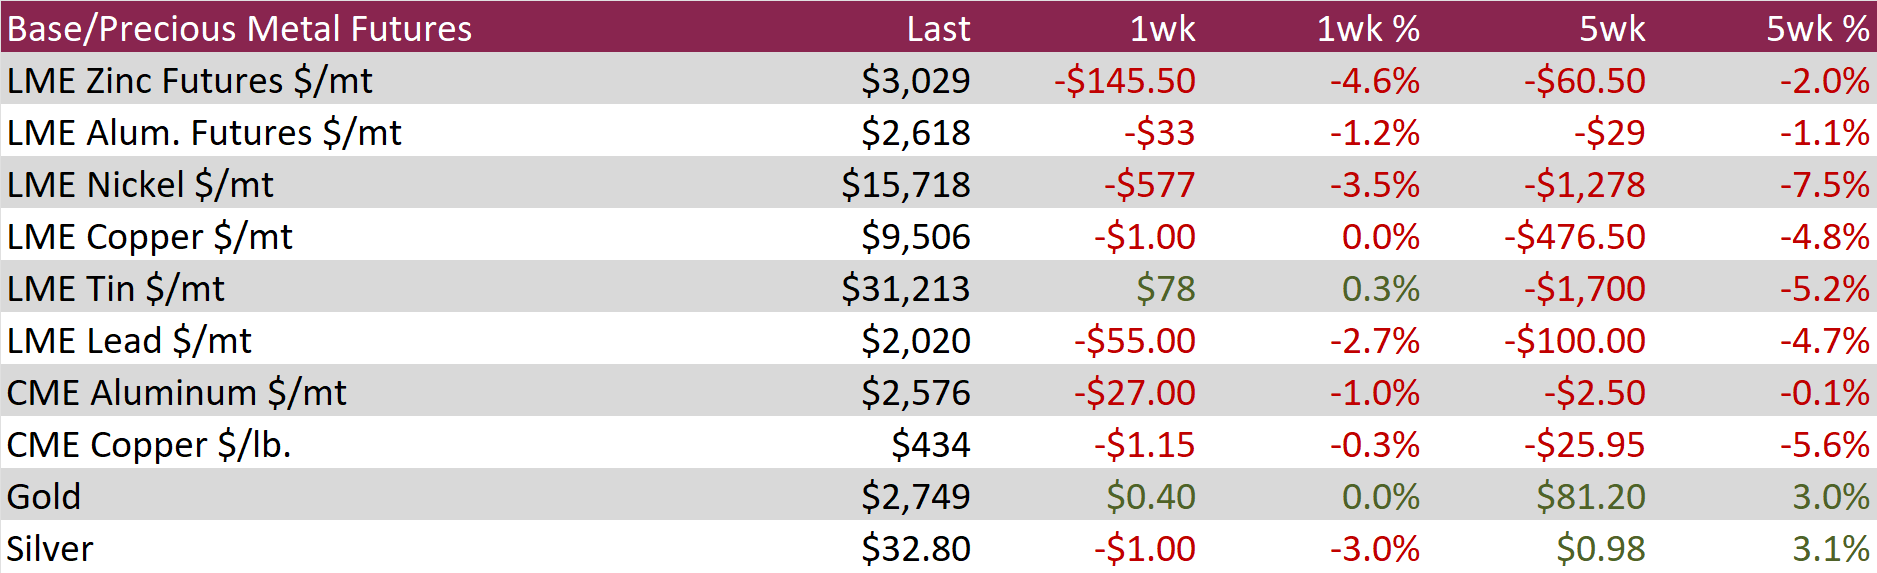
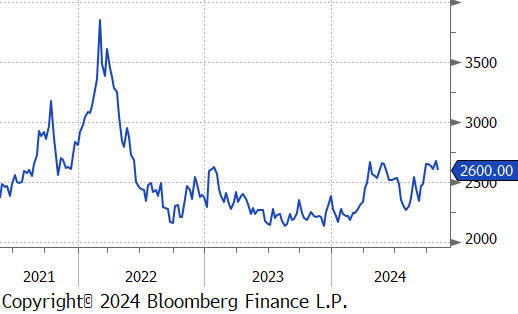
Aluminum futures dropped by $33 or -1.2% to $2,618 as a recent supply crunch for alumina, a key raw material in aluminum production, has driven prices to record highs, sparking concern across industries reliant on aluminum, such as beverage and aerospace manufacturing. Disruptions across the alumina and bauxite supply chain, including production issues in Australia and export restrictions from Guinea, have tightened the market and led to panic buying. This shortage has heavily impacted producers without secure, captive supplies of alumina, as prices for alumina have surged faster than those for finished aluminum, pressuring profit margins. With China’s aluminum production reaching record levels amid increasing demand, some analysts expect supply challenges to persist, which could lead to higher costs and potential production cuts for smelters globally if relief doesn’t emerge soon.
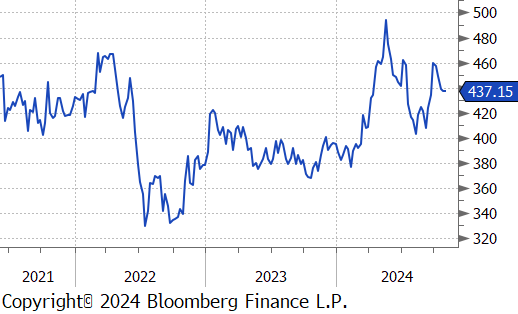
Copper futures fell by $1.15 or -0.3% to $434. China’s National People’s Congress begins a five-day session, markets are anticipating announcements of new debt and fiscal policies to boost economic growth, with reports suggesting a potential stimulus package of over 10 trillion yuan. Additionally, Chilean miner Codelco, the world’s largest copper producer, reported a production rebound, with 338,000 tons generated in the third quarter.
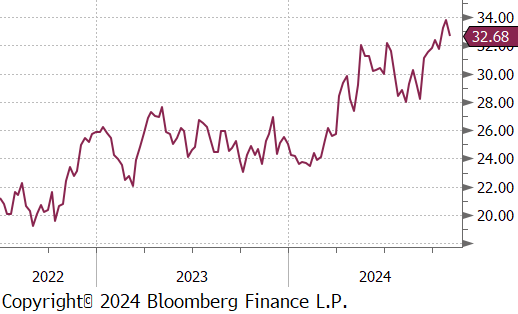
Silver declined by $1 or -3.0% to $32.80, a two-week low, prior to the US presidential election and the upcoming Federal Reserve rate decision, along with expectations for Chinese stimulus as the National People’s Congress begins its five-day session, with reports suggesting a potential 10 trillion-yuan package aimed at boosting economic growth. Investors are also bracing for key monetary policy decisions from central banks in the UK, Australia, Brazil, Poland, and Norway, adding caution to the market outlook.
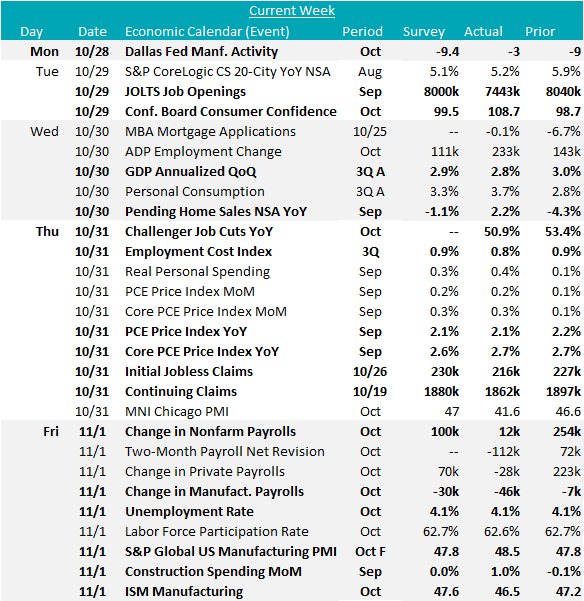
October manufacturing data highlights ongoing challenges in the sector while also showing some signs of improvement. The ISM Manufacturing PMI dropped to 46.5, missing the forecasted rise to 47.6 from September’s 47.2. Conversely, the final data for the S&P Global Manufacturing PMI rose to 48.5, exceeding the preliminary 47.8, yet still in contraction. Furthermore, most Fed Manufacturing Surveys surpassed market expectations – ex Empire (NY) – but the overall aggregate reading remains in contraction.
Construction Spending increased by 0.1% vs the anticipated 0.0%, with year-over-year growth up by 4.6% in September. Private spending was steady while public spending increased 0.5%.
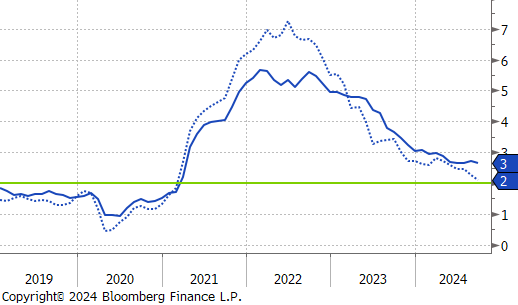
September Topline PCE was down to 2.1% YoY, while Core PCE (the FED’s preferred inflation measure) remains elevated and increased on the month, up to 2.7% from 2.6% last month.
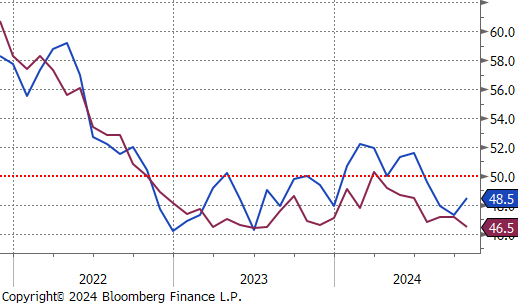
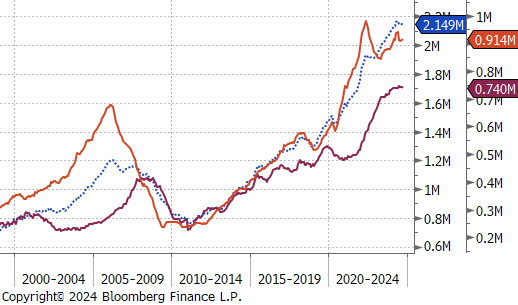
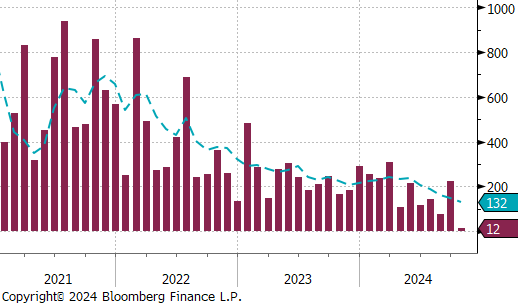
This week’s tranche of labor market data was incredibly varied. To start, Job openings decreased to 7.44M, moving below the pre-pandemic peak of 7.56M from November 2018. Job cuts were slightly lower, to 72,821 MoM and continue to bounce around the 60-90k range that we have been mostly stuck in since the end of 2022. The ECI (employment cost index) also came in slightly below expectations at 0.8% vs the expected 0.9% in 3Q24 (slightly elevated, but not inflationary), while initial and continuing claims both came in under expectations, a sign that the impact of the hurricane is almost fully removed once we clear the month of October. The former conclusion is important when viewing the significant downside surprise in the change non-farm payrolls which came in at 12k jobs added vs an expected 100k. What’s interesting, is that this reading stands in stark contrast to what we saw in the ADP employment data, which showed 233k jobs added, vs the expectation of 111k. Finally, the unemployment rate held at 4.1%.