Flack Capital Markets | Ferrous Financial Insider
November 10, 2023 – Issue #405
November 10, 2023 – Issue #405
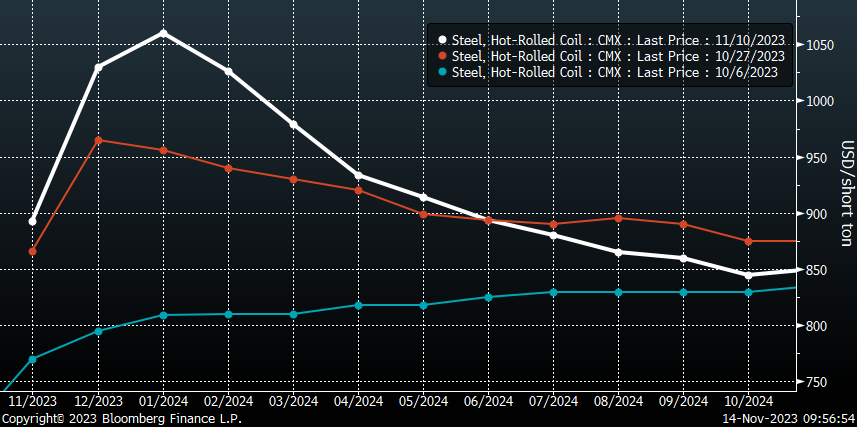
Over the last 5 weeks, the move in the forward curve has been nothing short of remarkable. The chart on the right shows the curve from last Friday, 2-weeks ago in orange, and 5-weeks ago in blue.
Over the full 5 weeks, the forward curve is up 14.5%, shifting from a slight contango into full, sharp backwardation. This is the result of what happened to December and January, each up 29.5%, and 31%, respectively.
While this shift may have taken a lot of participants by surprise, it is important to take a step back and add the context of what the curve is telling us and what the signal is for the physical market. First, we have long been very vocal about not looking at the curve as a predictor of pricing. The seismic shift from contango (near months below later months) into backwardation (near months above later months) shows the market first and foremost that we are currently in a temporary shortage. This fact is confirmed by recognition that lead-times are currently the most extended that they have been since the historic 2021 rally.
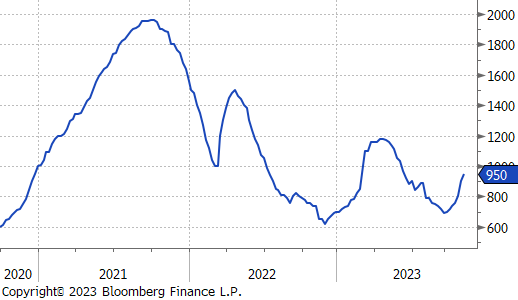
Exactly what this means for both the spot market and futures market is yet to be seen. Futures prices have recently taken a breather, but over the same full 5-week period, spot prices have rallied 29-33% depending on the index. As it currently stands, spot prices clearly have room to run higher and mills are continuing to push price announcements with very limited availability and throttled back production. The primary risk to the rally in the spot market at this point would be imports, however, global prices are also increasing (albeit at a slower pace), and those delivery times are also extended well into 1H24.
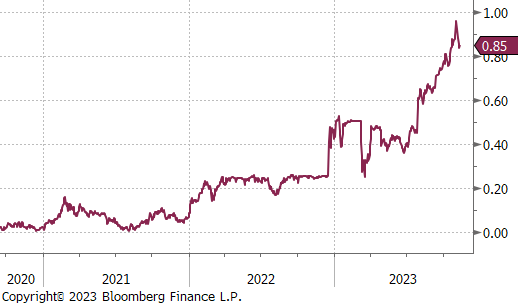
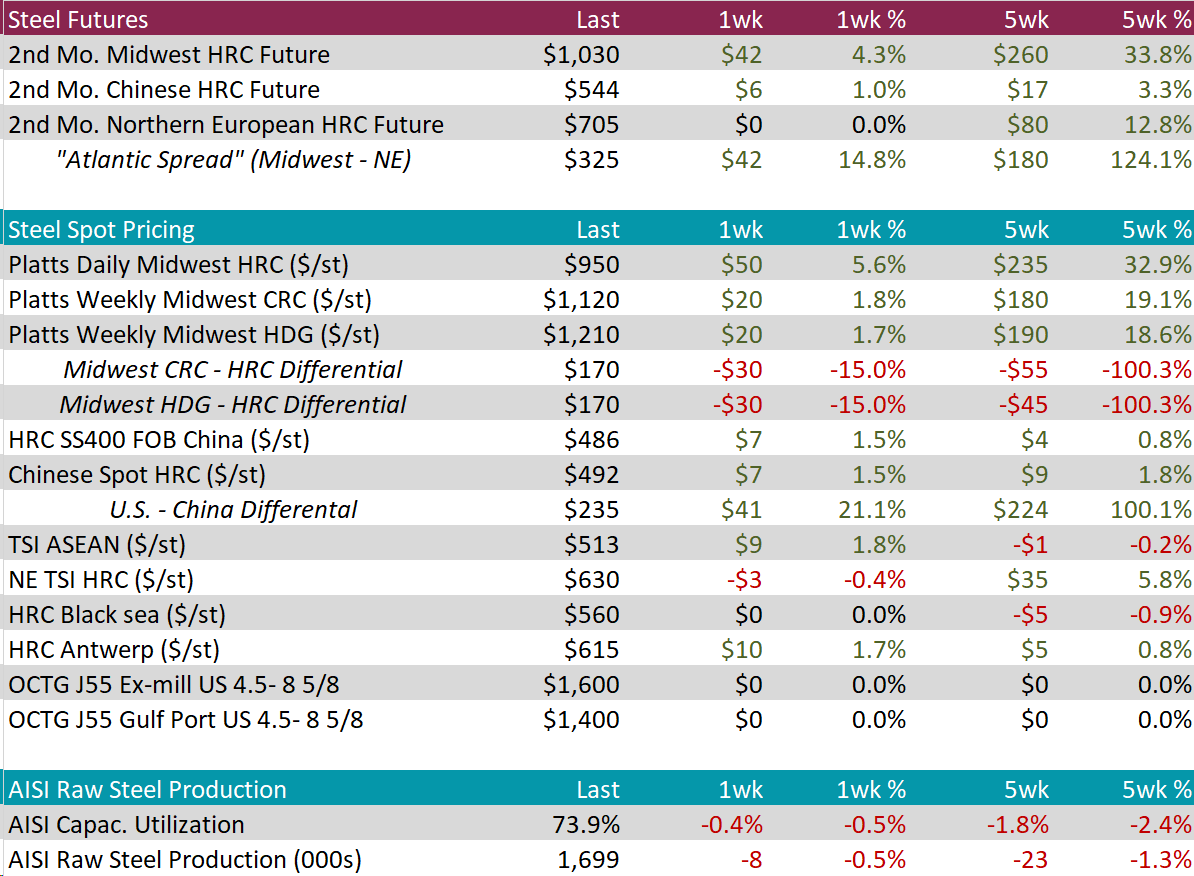
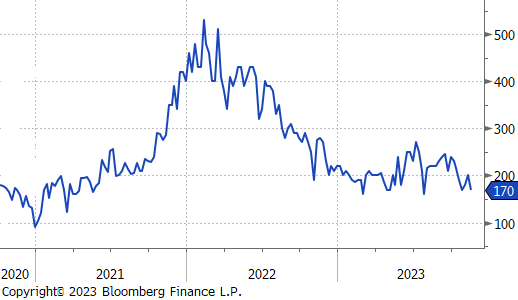
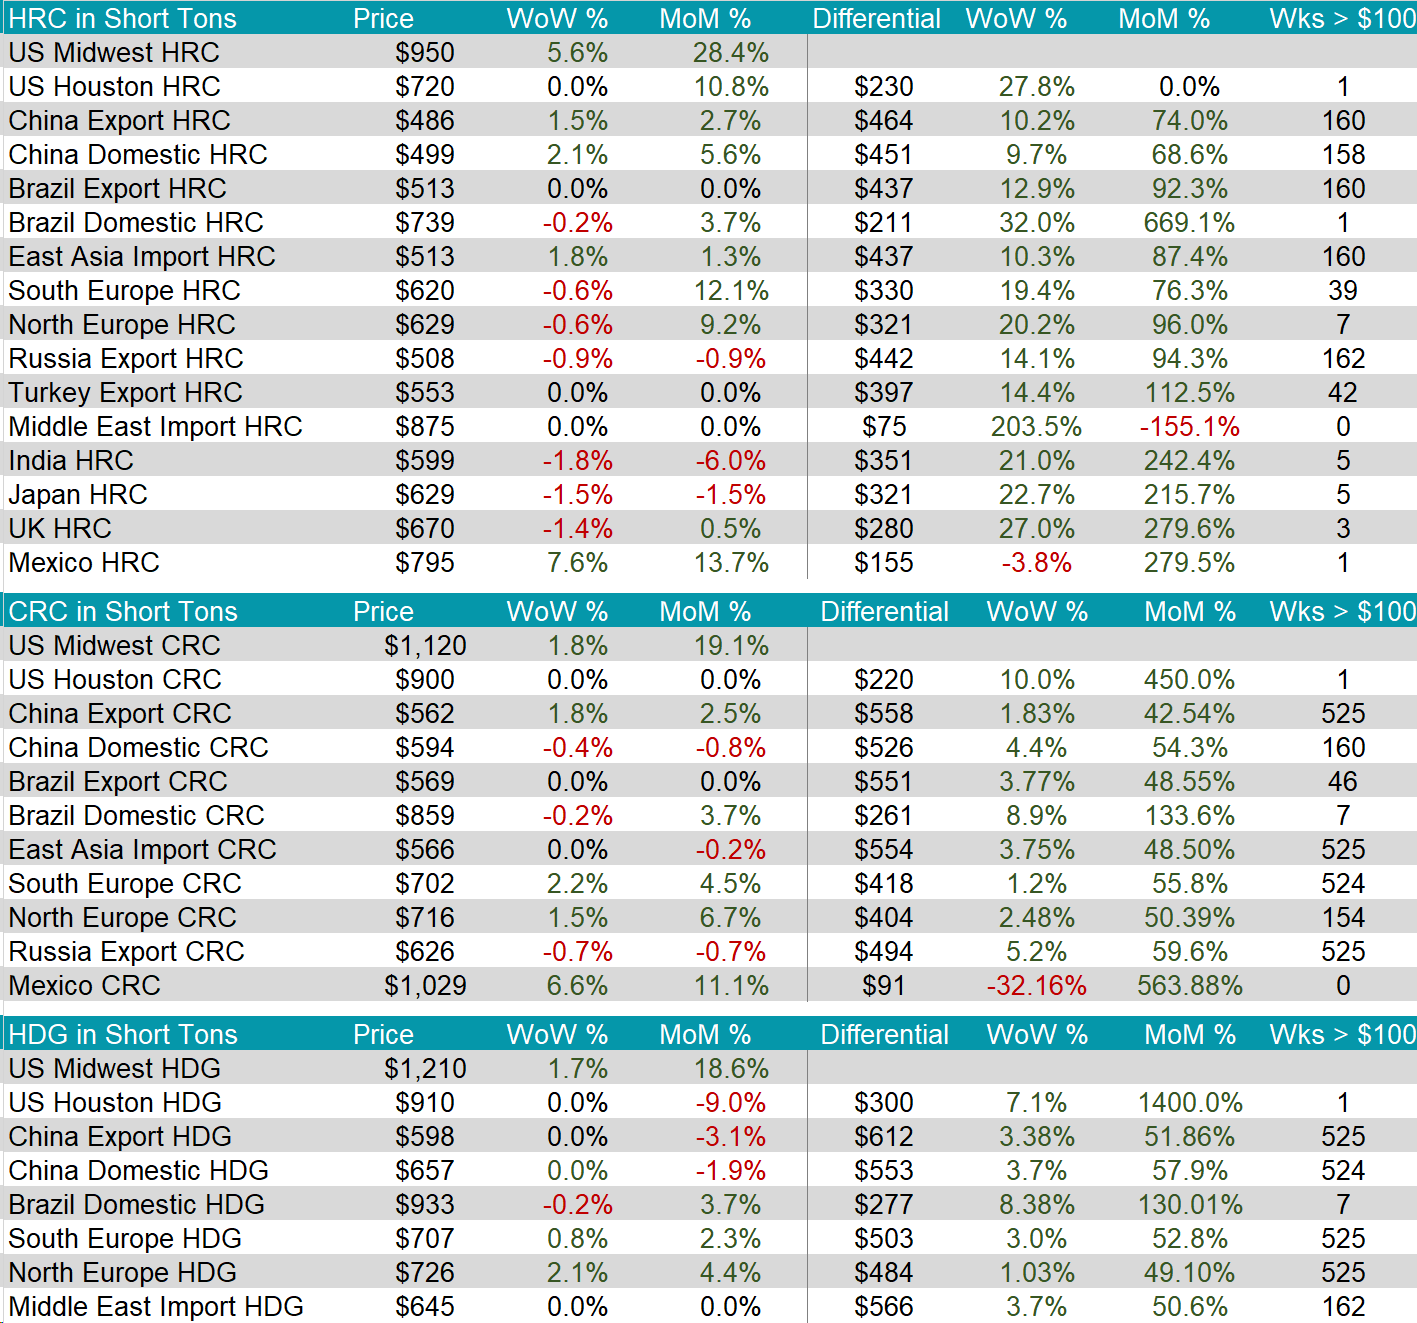
The HRC spot price rose by $50, or 5.6%, bringing the price up to $950. Since this upward trend, which begun seven weeks ago, the spot price has gained $260. The 2nd month future also continued to climb, finally breaking into the $1,000 threshold by rising by $42, or 4.3%, to $1,030, bringing the price up to levels seen in April.
Tandem products both increased by $20, bringing CRC up to $1,120 and HDG up to $1,210, resulting in both the CRC – HRC and HDG – HRC differentials decreasing by $30, or -15%, to $170.
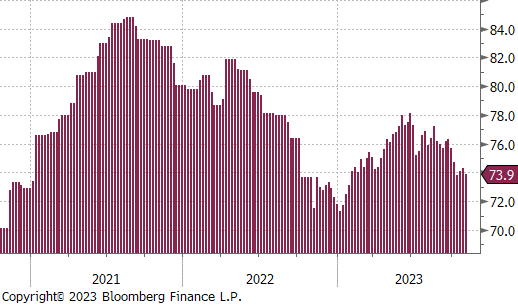
Mill production ticked down, with capacity utilization reducing by -0.4% to 73.9%, bringing raw steel production down to 1.699M tpm. This is the first reduction after three weeks of increases.
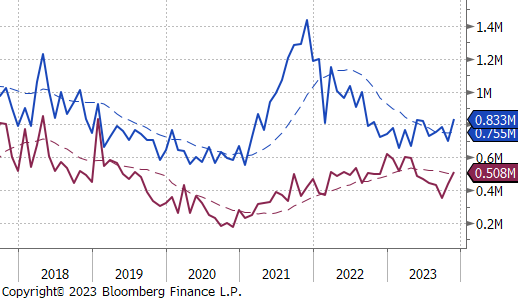
November Projection – Sheet 833k (up 136k MoM); Tube 508k (up 73k MoM)
October Projection – Sheet 697k (down 85k MoM); Tube 435k (up 85k MoM)
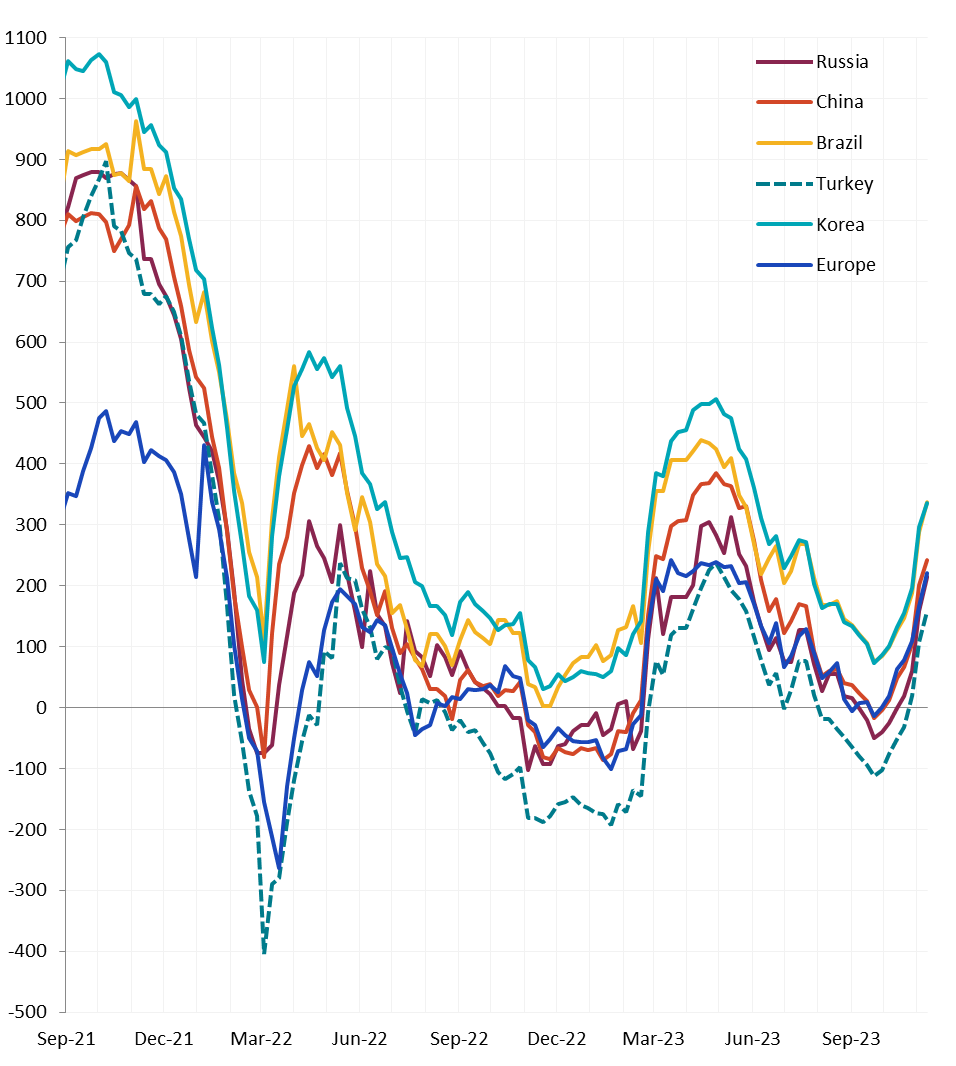
All watched global differentials continued to rise, with the US HRC price continuing to increase at a significant rate, this week by 5.6%, whereas the Europe HRC slowed, increasing by -0.6% week-over-week.
Scrap
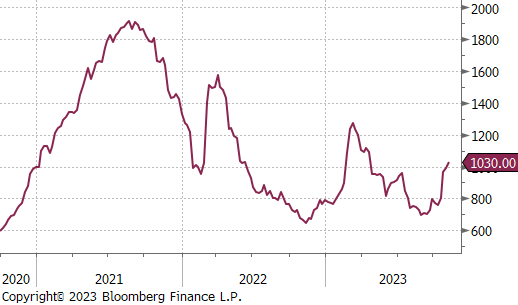
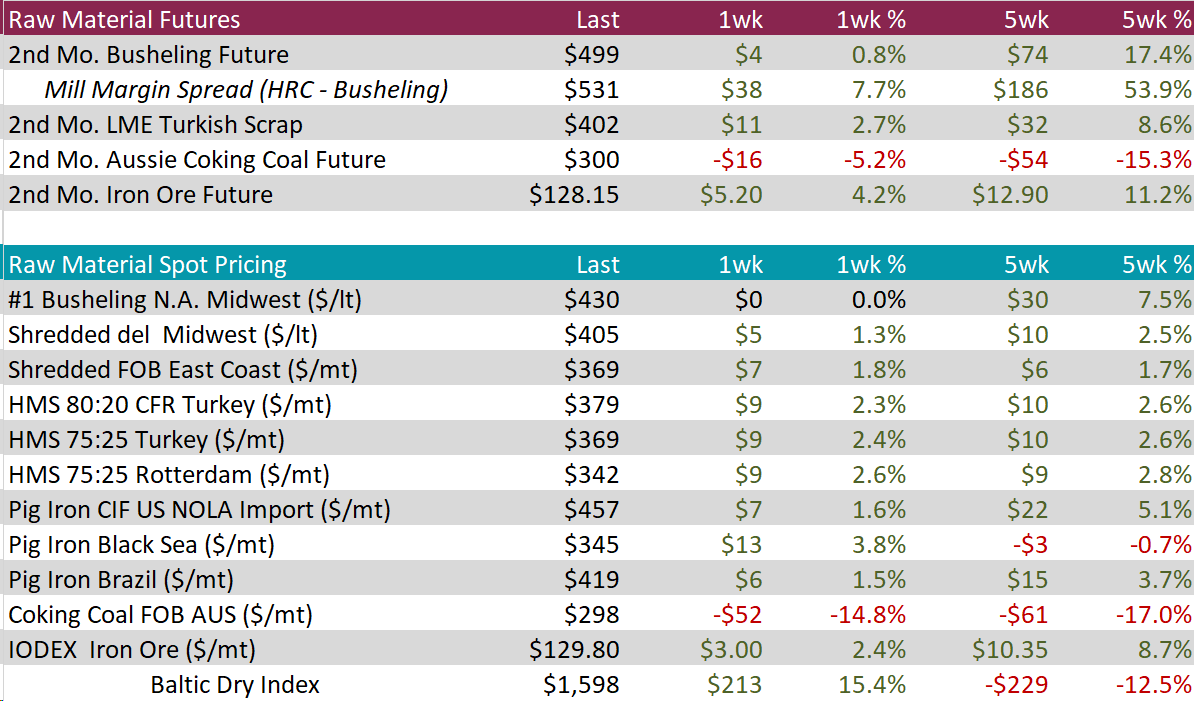
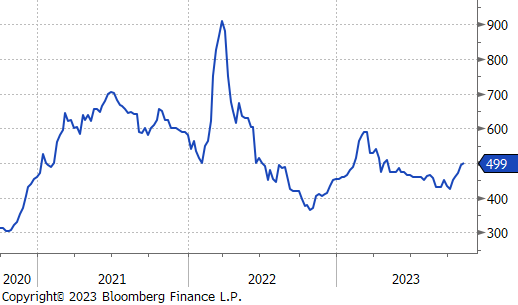
The 2nd month busheling future continued to increase, albeit at a much smaller rate than previously seen on this current upward trend, rising by $4, or 0.8%, to $499.
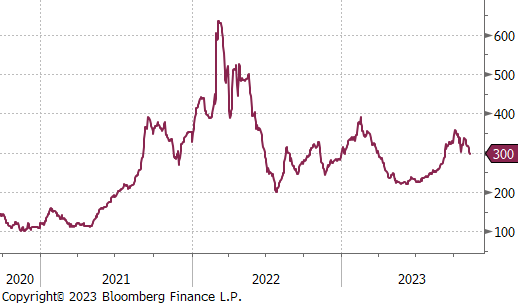
The 2nd month Aussie coking coal future fell by $16, or -5.2%, to $300. This is the lowest it has been since early September.
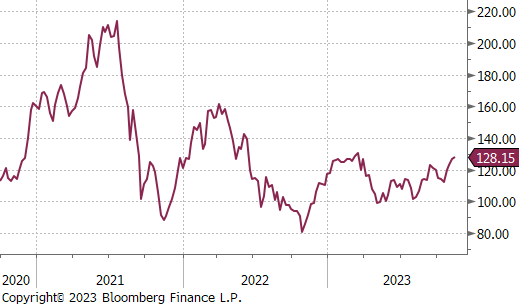
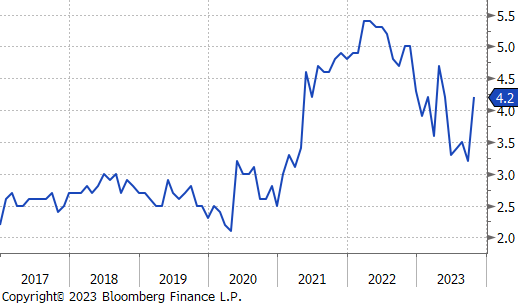
The 2nd month iron ore future went up by $5.20, or 4.2%, to $128.15. It has gained $15 in just three weeks, bringing it up to the highest price seen since March.
Dry Bulk / Freight
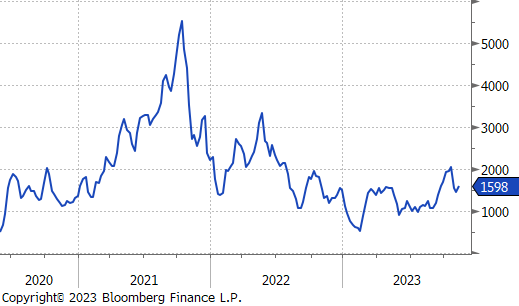
The Baltic Dry Index ticked up by $213, or 15.4%, to $1,598. This movement comes right after two weeks of substantial decreases.
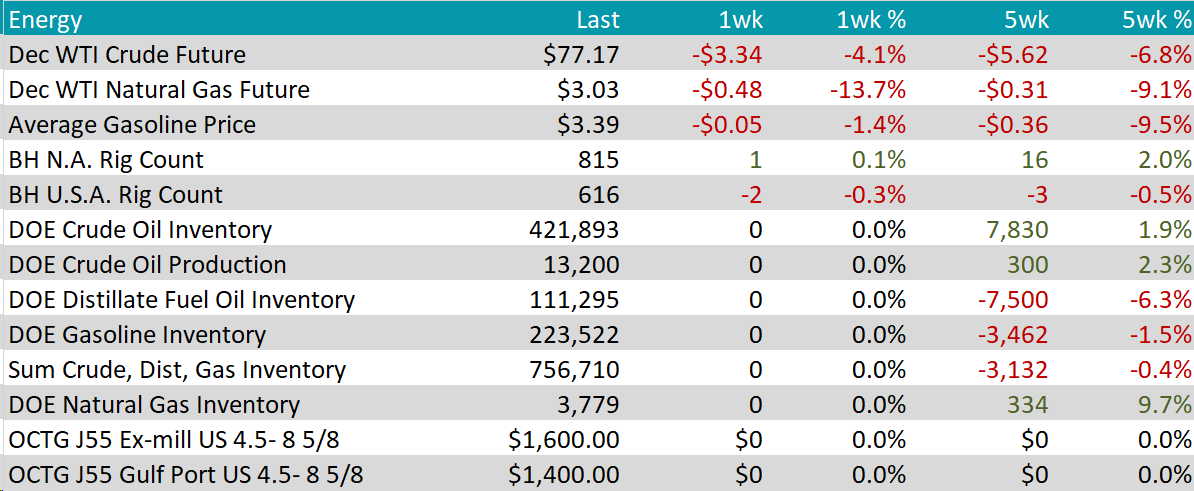
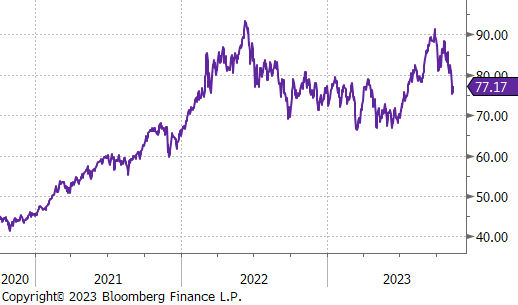
WTI crude oil future lost $3.34 or -4.1% to $77.17/bbl.
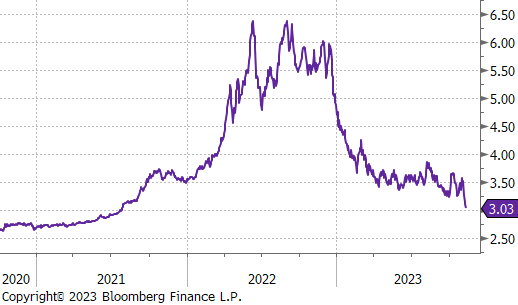
WTI natural gas future lost $0.48 or -13.7% to $3.03/bbl.
The aggregate inventory level remained unchanged.
The Baker Hughes North American rig count increased by 1, whereas the US count decreased by 2 rigs.
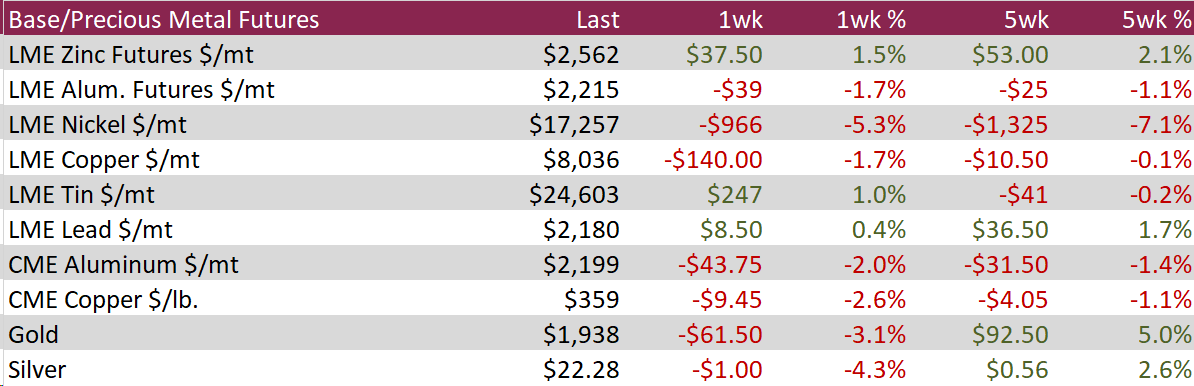
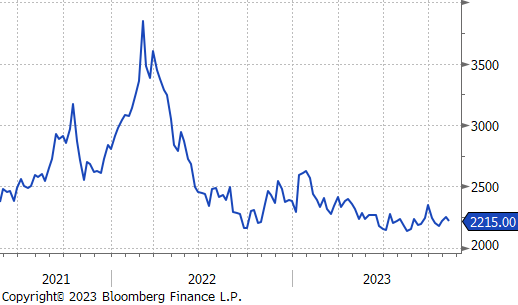
Aluminum dropped to $2,215, a loss of $39, or 1.7%. This came as the US bond market’s poor demand exacerbated the country’s tighter financial conditions and affected the outlook for input materials for important US-based firms. Furthermore, the forecast for China’s demand remains muted, particularly in light of the publication of contractionary manufacturing PMI data and a recent episode of deflation in October.
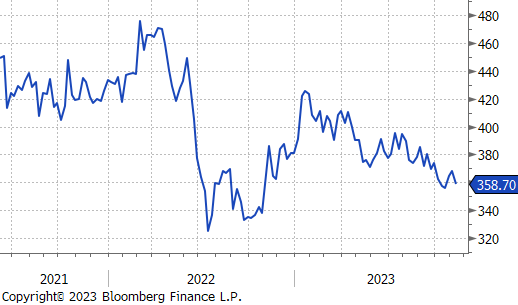
Copper fell by $9.45, or -2.6%, to $359, retreating from one-month high of $368 reached last week due to persistently negative demand outlooks for China. The government’s recent initiatives to increase infrastructure activities including copper are at odds with this trend. In terms of supply, the Shanghai Futures Exchange’s copper stockpiles increased by 11.2% to 40,516 tonnes, providing some cushion after the previous period’s collapse.
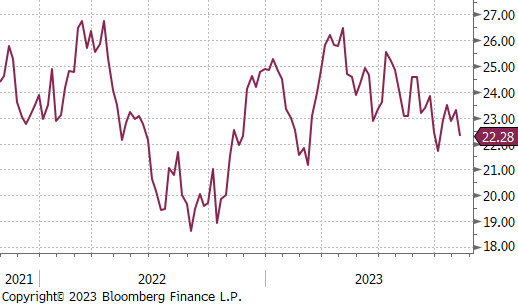
Due to pressure from a stronger dollar and Treasury Yields anticipating the inflation release, silver fell to $22.28, its lowest level in a month. Week data from China, the possibility of additional rate hikes, and hawkish comments from Fed officials all reduced demand for the safe-haven asset. However, the US debt problems brought some respite when Moody’s downgraded the US credit rating outlook from stable to negative due to rising budget deficits and impasses in Washington.
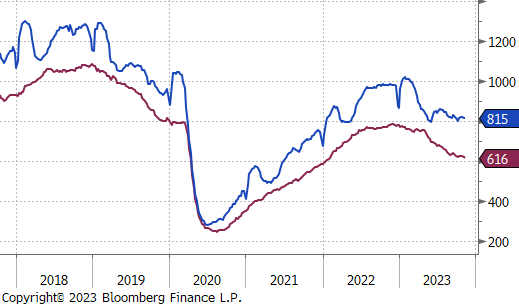
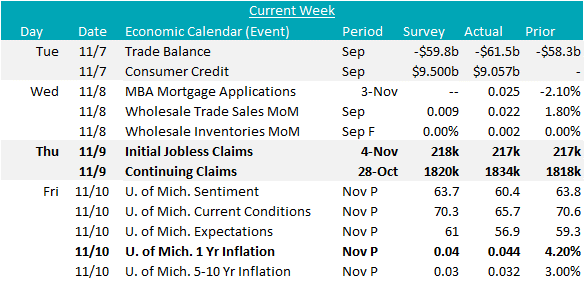
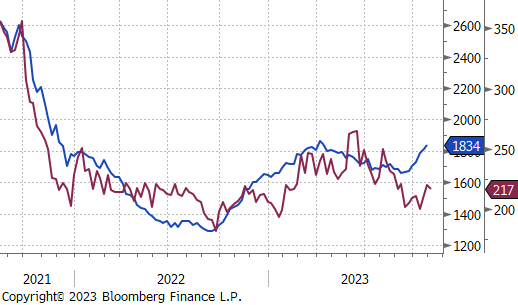
Initial jobless claims eases up around 217k, coming in below expectations of 218k, holding relatively close to seven-week highs from late October. Meanwhile, continuing claims increased for a seventh straight week to 1834k, the highest level since mid-April and above market expectations of 1820k. This signals that those unemployed are having a harder time finding employment. Overall, this indicates that the labor market is going through some softening yet is still at historically tight levels.
November preliminary data for the University of Michigan 1-Year Inflation expectations came in at 4.40%, a surge from 4.20% in October and exceeding expectations of 4.0%. This marks the highest reading since 2011 and is a bit concerning as consumer sentiment continues to wane. This reveals that the lingering effects of inflation are still being felt, and the fight to tame it is still not completely over.
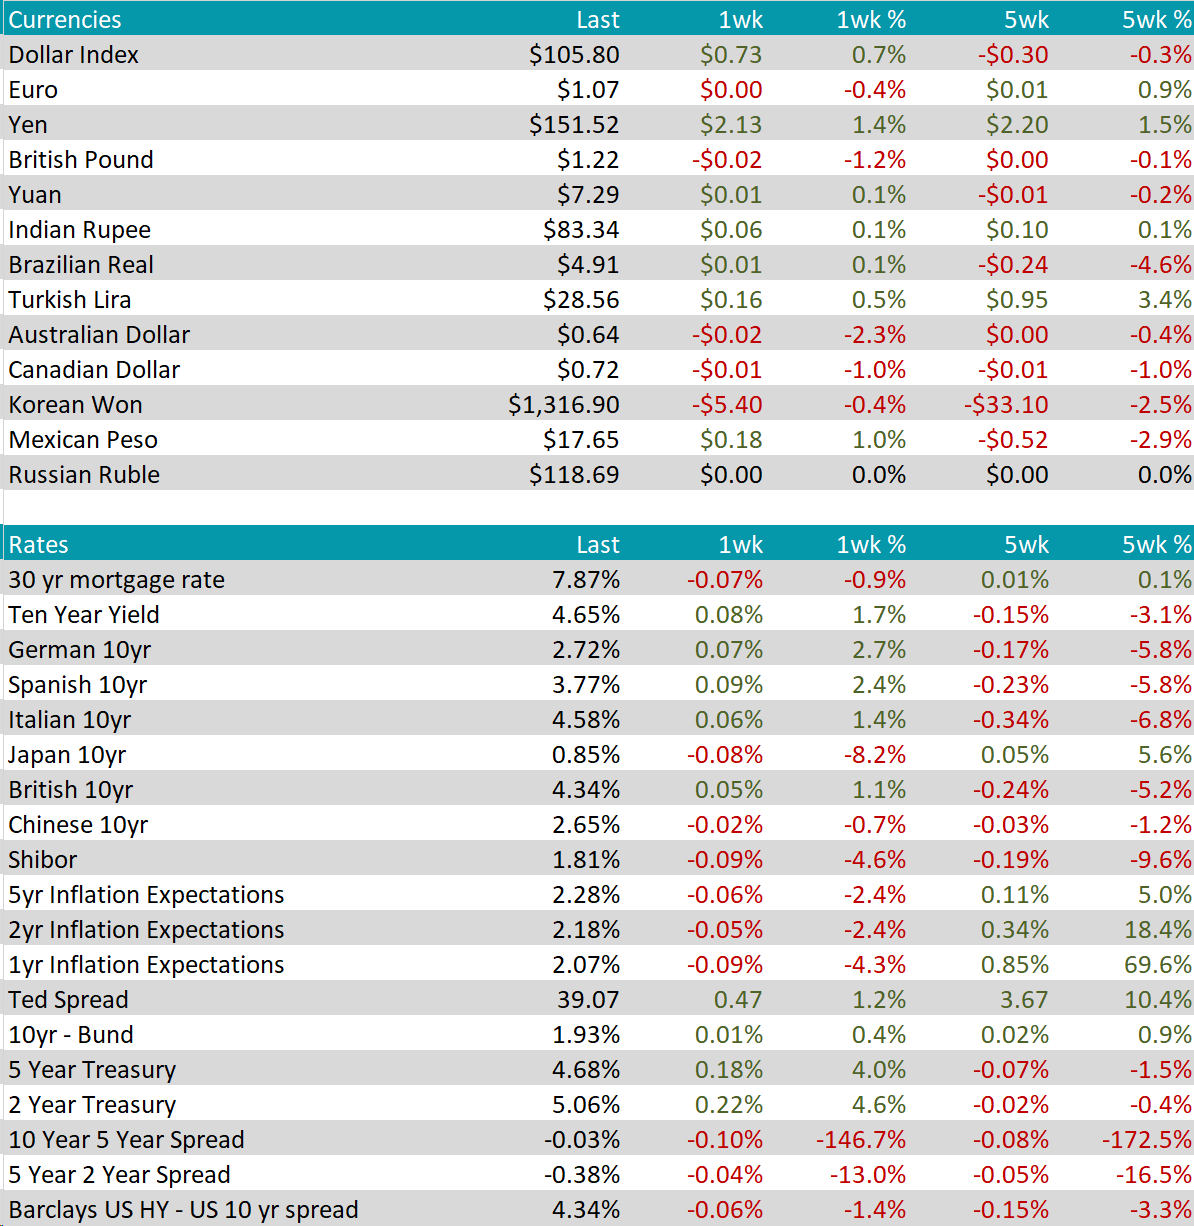
Last week, the British pound experienced a decline, falling by 1.2% against the US dollar, bringing it to a rate of $1.22. This week, the financial markets are keenly awaiting several key data releases from the UK, including figures on inflation, retail sales, and unemployment. Adding to the GGBP’s decline against the USD, the Chief Economist for the Bank of England issued a cautionary note, stating that the projection of a need for prolonged restrictive monetary policy should not be seen as a definitive commitment.
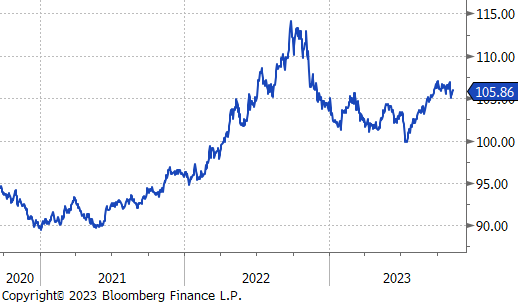
The USD saw an appreciation against the Japanese Yen, reaching a level of $151.52, which signified a one-year low for the yen. This movement comes as investors are gearing up for the release of US inflation data. Influencing market dynamics, hawkish statements from US policymakers have been pivotal, especially from Fed Chair Jerome Powell. Powell highlighted that the central bank is “not confident” it has sufficiently addressed inflation concerns. In stark contrast, the Bank of Japan (BOJ) has committed to maintaining its accommodative monetary settings patiently. BOJ Governor Kazuo Ueda acknowledged the widening policy divergence with other major economies but refrained from making direct statements in support of the yen’s value. Earlier in the month, the BOJ adjusted its policy, loosely setting 1% as an “upper bound” for 10-year Japanese Government Bonds.