Flack Capital Markets | Ferrous Financial Insider
November 24, 2023 – Issue #407
November 24, 2023 – Issue #407
The upward trend continued for steel spot pricing during the holiday week, driven by reduced production and stable demand. It was also a quiet week on the economic data side other than jobless claims reversing the recent trend higher and near-term inflation expectations (University of Michigan consumer sentiment survey).
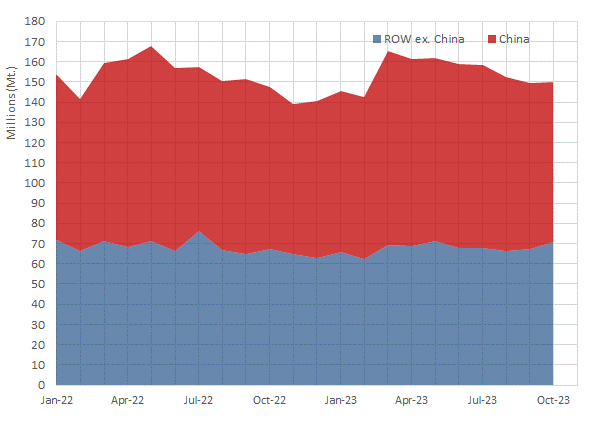
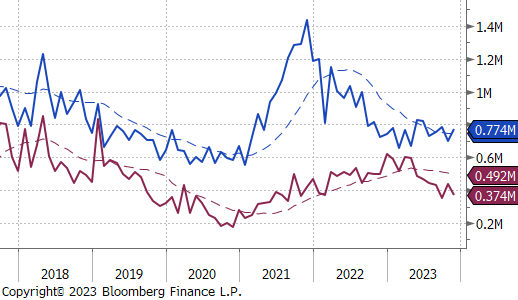
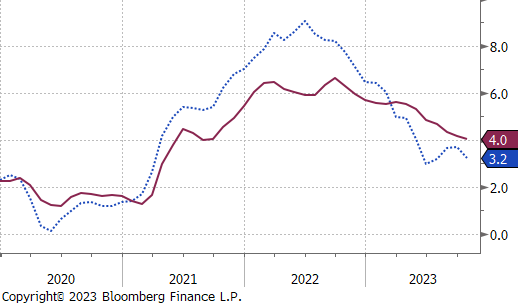
That said, the most notable data released last week for the steel world was a surprising slight increase in global steel production, up 300k in October. The chart on the right shows Global steel production with China (red) versus the rest of the world (blue). As is clearly shown, what happens in China typically drives the global trend, with their production accounting for more than 53% of global steel production over the last 10 years.
Since March, Chinese production is down 17.3%, which is clearly driving the overarching trend lower in global production, but what has been unexpected is the 7.1% ramp up in production from the “Rest of the World” since August.
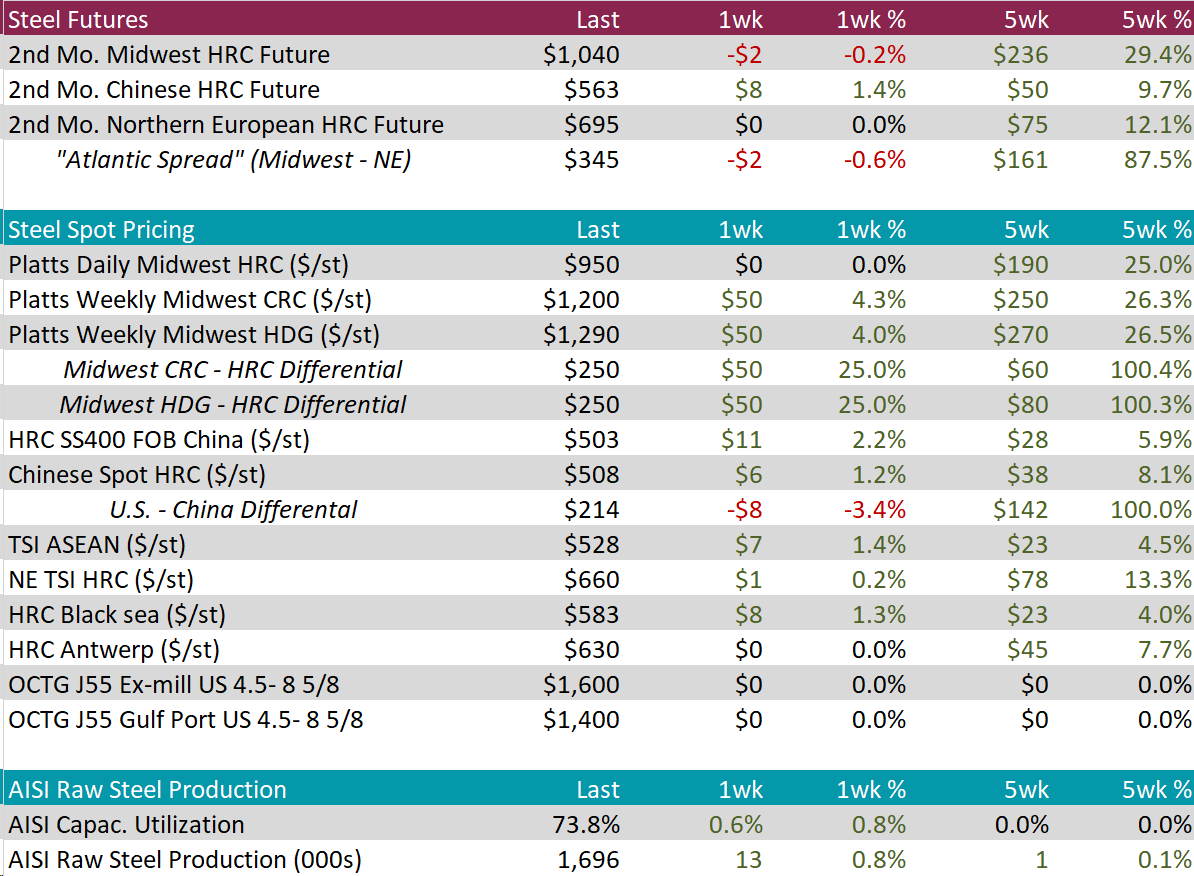
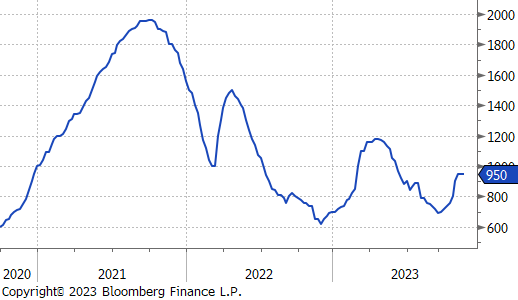
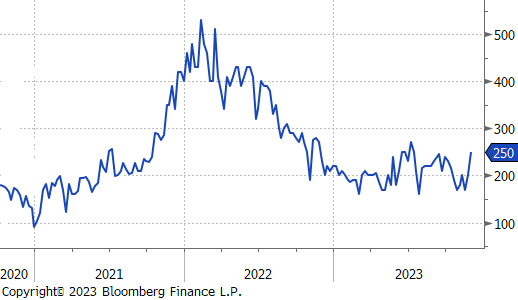
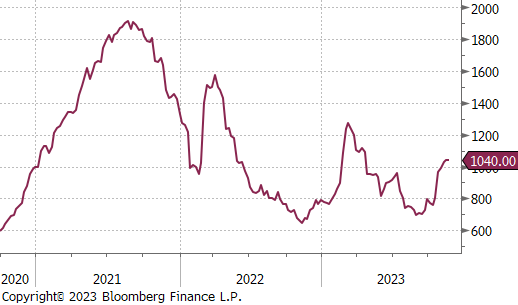
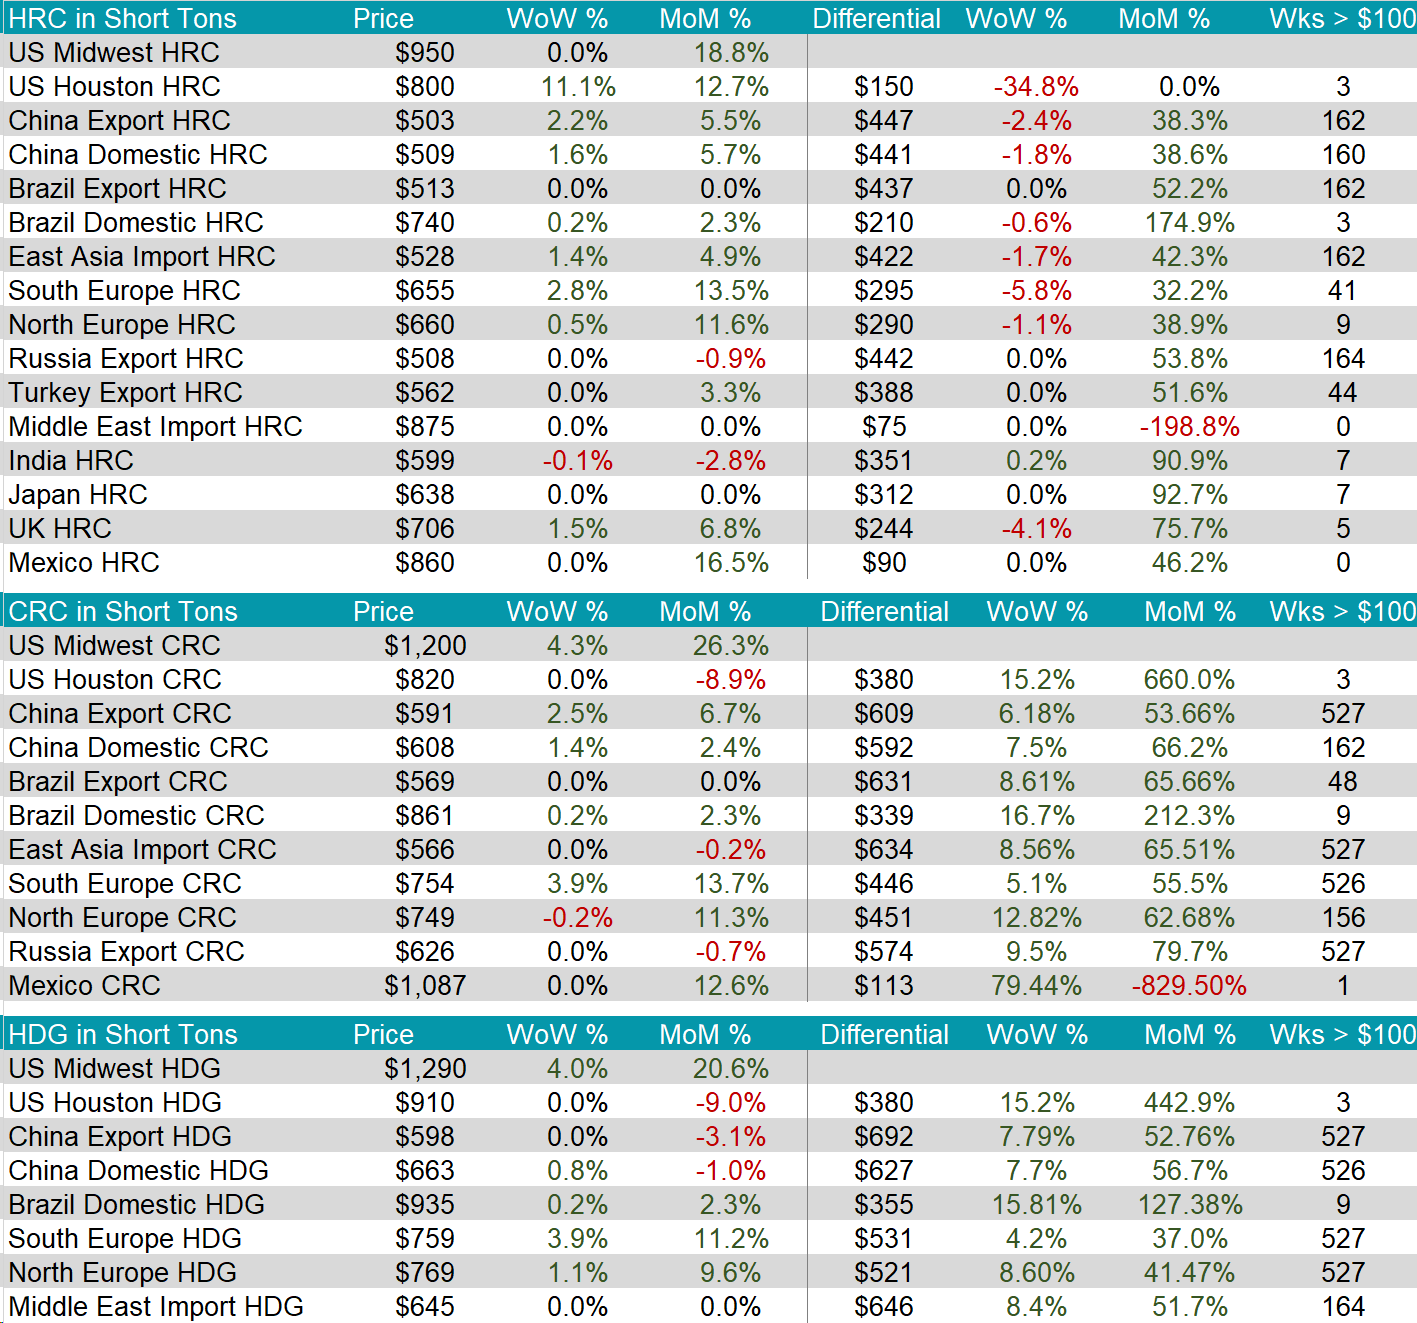
The HRC spot price remained unchanged at $950 for the second week in a row, meanwhile the 2nd month future fell by $2, or -0.2%, to $1,040. This is the first decrease after gaining $272 over two-months.
Tandem products both increased by $50, bringing CRC up $1,200 and HDG to $1,290, resulting in both the CRC – HRC and HDG – HRC differentials increasing to $250.
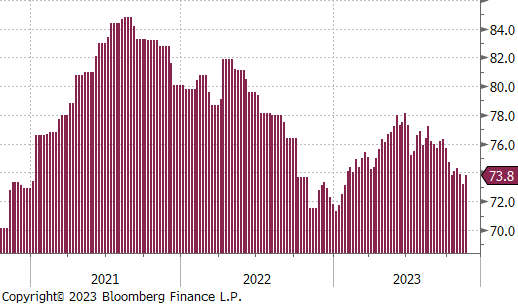
Mill production remains at relatively low levels, with capacity utilization ticking slightly up by 0.6% to 73.8% after cutting back for three weeks.
November Projection – Sheet 774k (up 74k MoM); Tube 374k (down 64k MoM)
October Projection – Sheet 700k (down 81k MoM); Tube 437k (up 87k MoM)
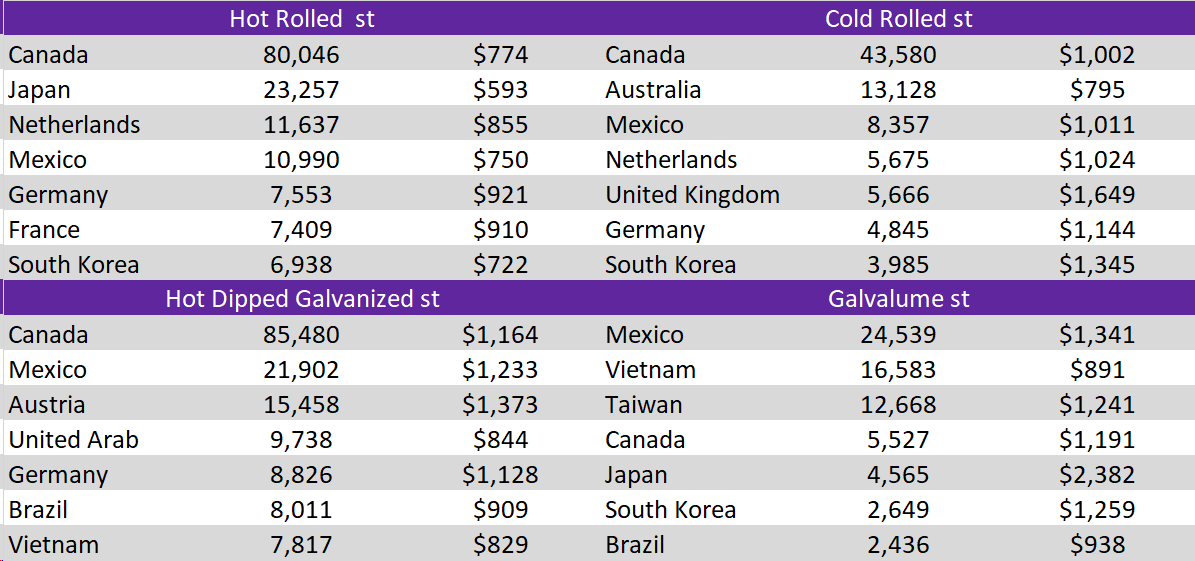
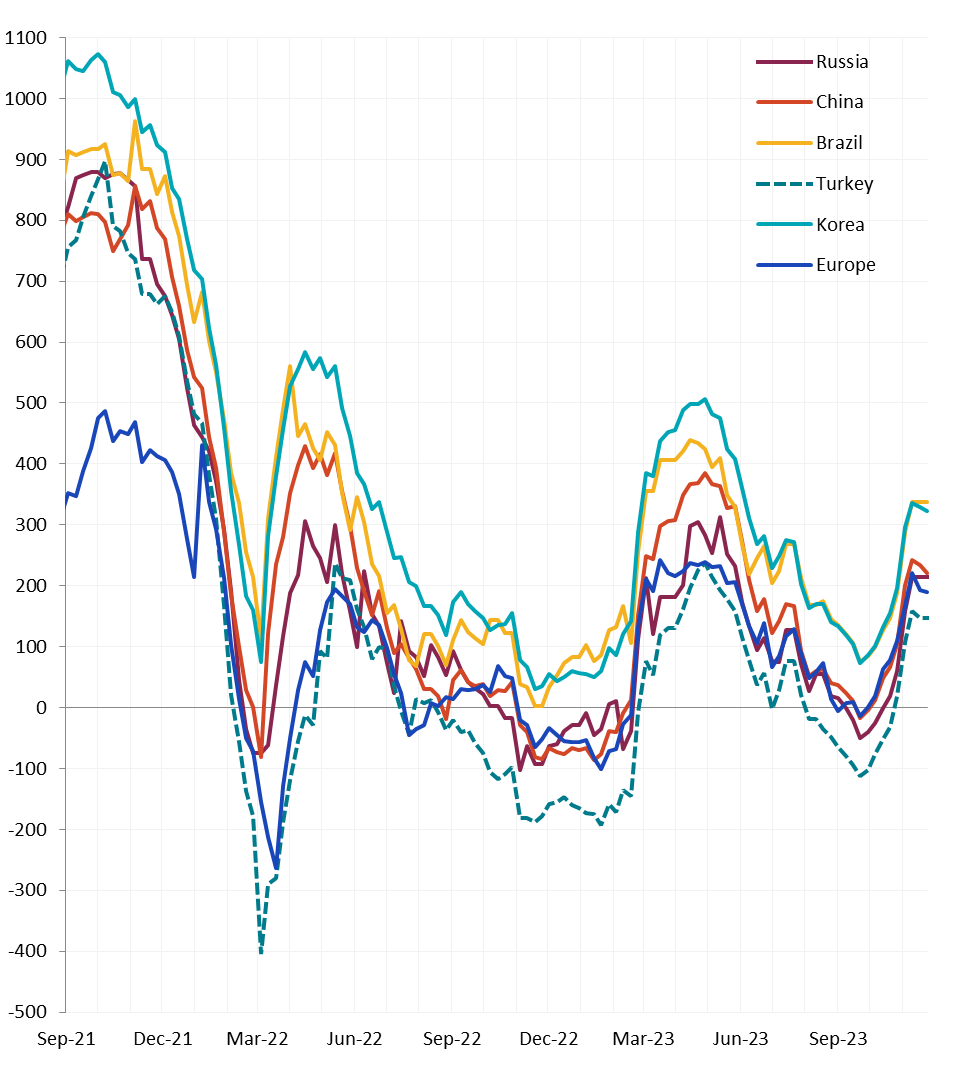
All watched global differentials were slightly lower again this week, with an unchanged U.S. domestic price and increases to China and Southeast Asia seeing the biggest increases in prices of 2.2% and 1.6%. Notably, the Houston HRC price shot up by 11.1% to $800.
Scrap
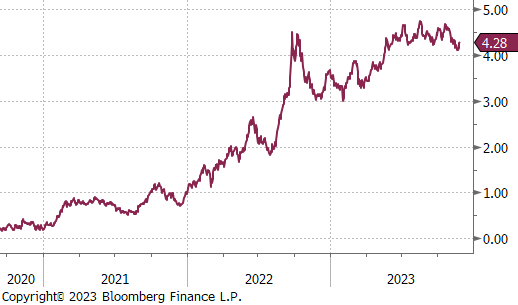
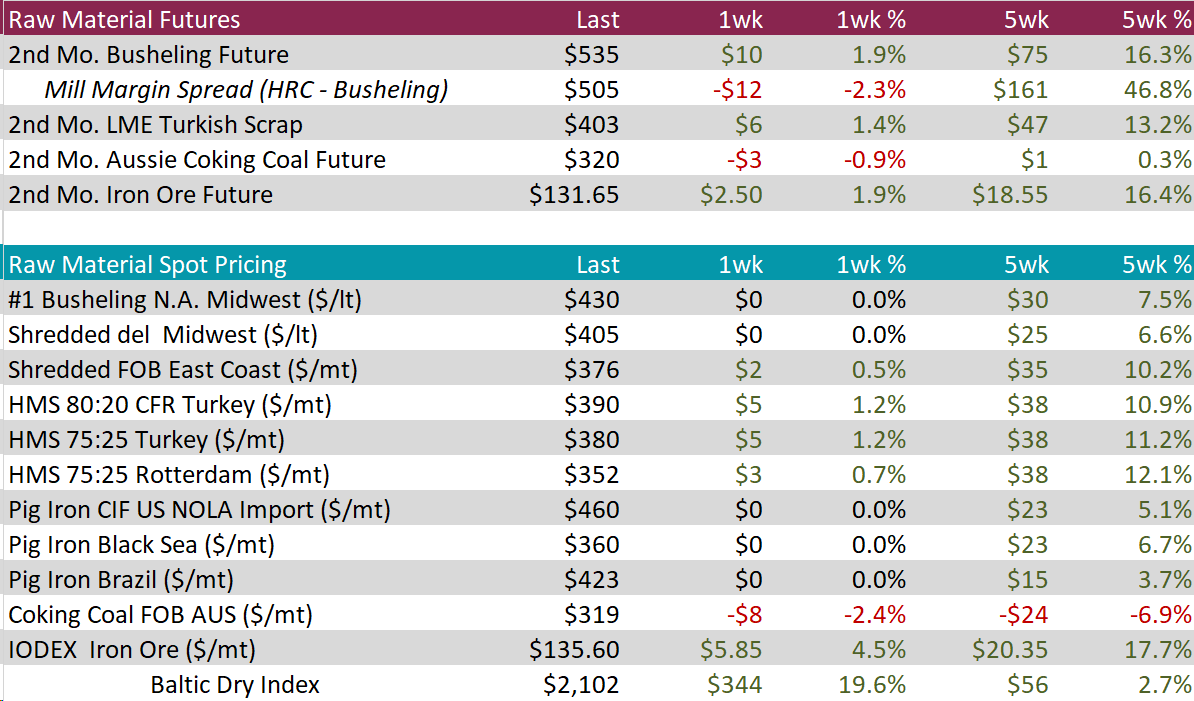
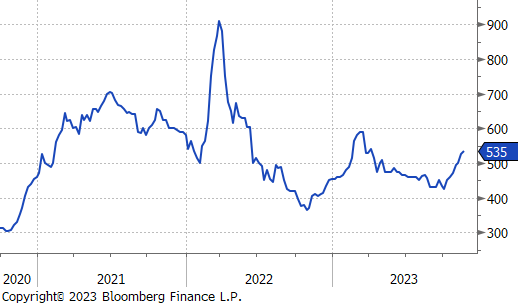
The 2nd month busheling future continues to climb, this time increasing by another $10, or 1.9%, to $535, bringing the total gains of the upward trend so far to $110.
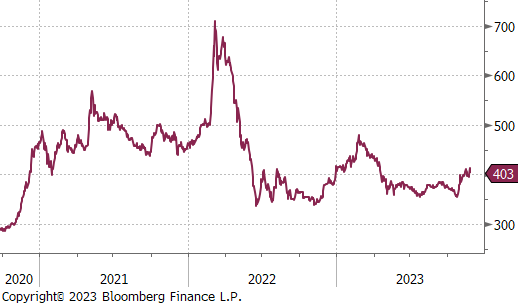
The 2nd month LME Turkish scrap future rose by $6, or 1.4%, to $403, reaching price levels seen in April.
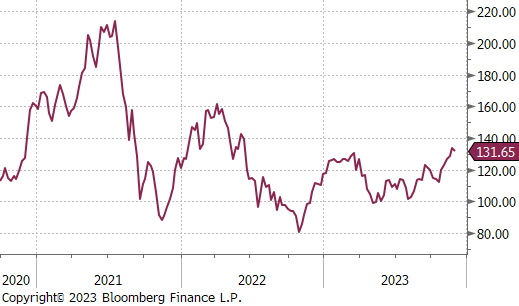
The 2nd month iron ore future gained $2.50, or 1.9%, pushing the price up to $131.65, its highest level since June 2022.
Dry Bulk / Freight
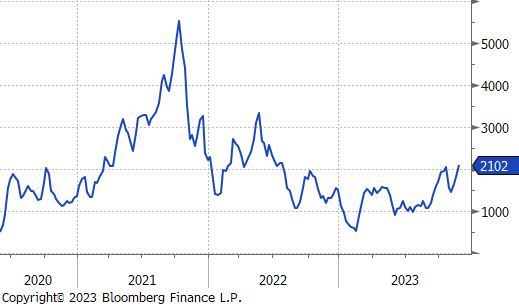
The Baltic Dry Index continued to rebound, rising by 344, or 19.6%, to 2,102 points due to stronger demand. This is the highest level since July 2022.
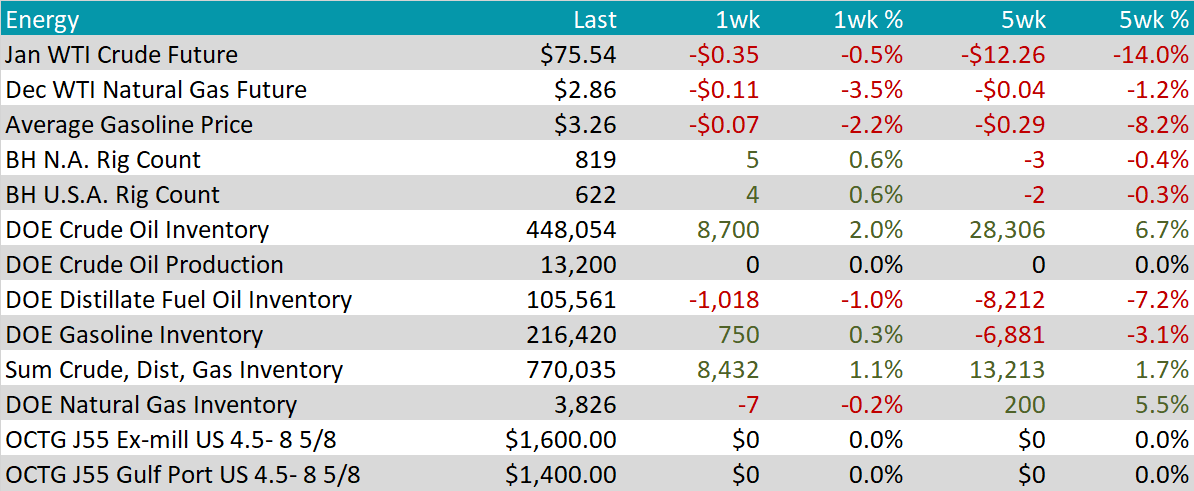
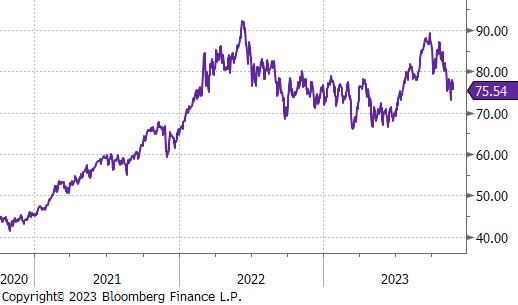
WTI crude oil future lost $0.35 or -0.5% to $75.54/bbl.
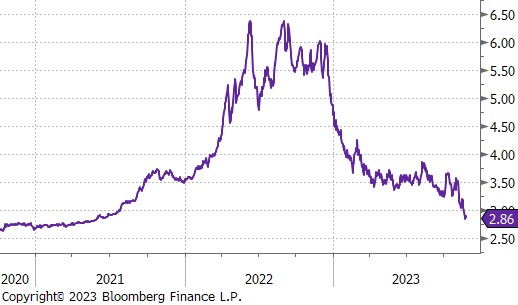
WTI natural gas future lost $0.11 or -3.5% to $2.86/bbl.
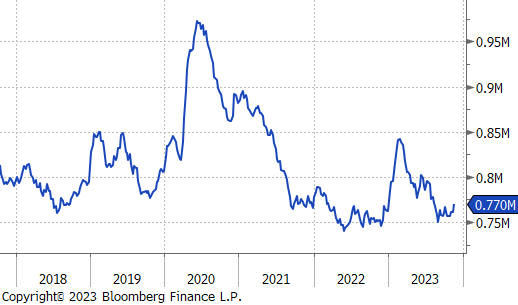
The aggregate inventory level jumped up by 1.1%, bringing the total up to 0.770M.
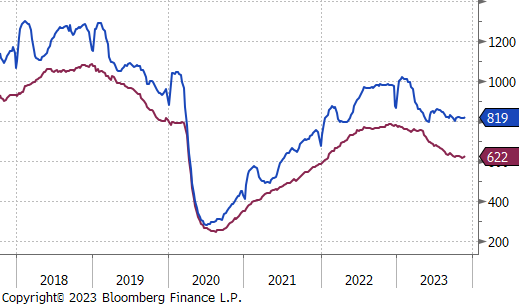
The Baker Hughes North American rig count rose by 5 rigs and the US count increased by 4 rigs, bringing the former up to 819 rigs and the latter up to 622 rigs.
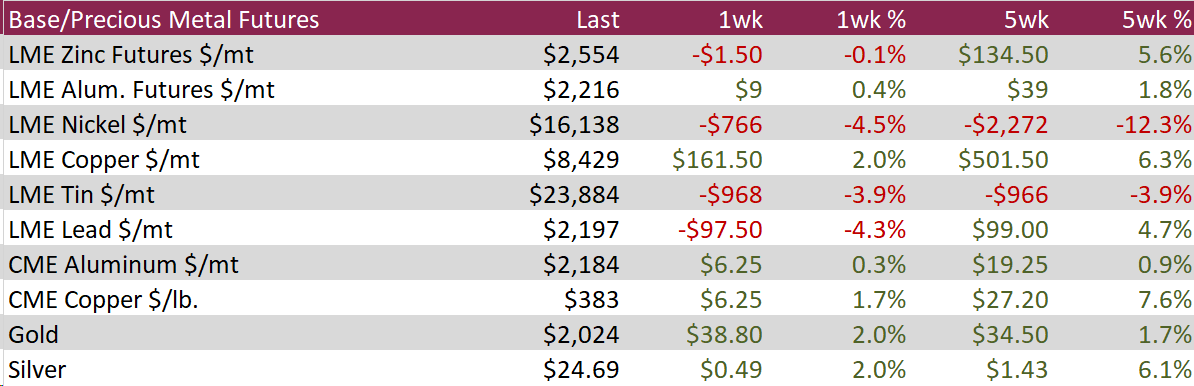
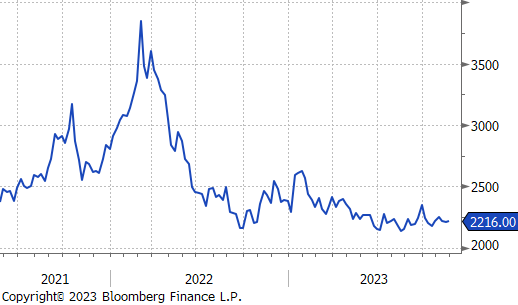
The LME aluminum futures rose by $9, or 0.4%, to $2,216. Aluminum remains above the $2,200 level as supply concerns coincide with rebounding demand. The main element supporting this is the impact of China’s supply bind, with their capacity ceiling and winter power shortage. This along with China’s support for its property sector and an outlook for a weaker dollar, has enabled Goldman Sachs to forecast a global shortage next year.
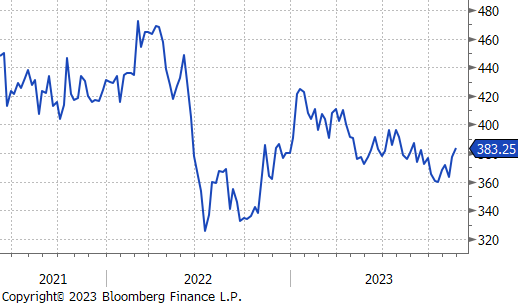
CME Copper gained $6.25, or 1.7%, to $383, edging back to price levels not seen since September 1st, as supply and inventory concerns along with expected demand continue. However, some respite for inventories may be on the way as the latest data pointed to shrinking stocks due to a slight pullback in the Yanshan copper premium suggested that manufacturers may have eased the purchasing activity from recent weeks.
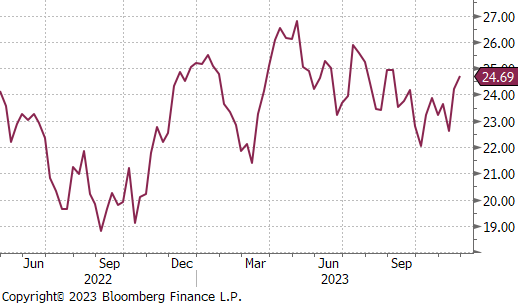
Silver continued to rise, hitting $24.69, a level not see since July, gaining from a weaker dollar and declining US Treasuries amid expectations that the Fed is at the end of its interest rate hikes. Meanwhile, worries over industrial silver availability in light of strong demand also drove up prices. According to the Silver Institute, decreased output from major producers, Mexico and Peru, is mostly to blame for the projected 2% decline in worldwide mined silver production in 2023. At the same time, market participants predicted an 8%–10% increase in silver demand due to increased investments in solar panels, power grids, and 5G networks.
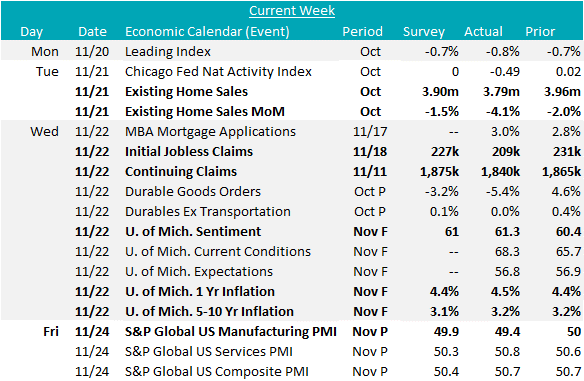
Initial jobless claims fell by 24k to 209k and was well below market expectations of a slighter decrease to 227k, a significant turn-around from the three-month high in the prior week. In a similar fashion, continuing claims dropped 22k to 1,840k and was well below expectations of an increase to 1,875k, pulling back from the two-year high hit in the previous reading. Altogether, this indicates that the softening of the labor market has not yet fully materialized, giving the Fed some leeway to maintain interest rates at restrictive levels.
University of Michigan 1-year Inflation expectations rose to a 7-month high of 4.5% for November, up from the preliminary estimate of 4.4%. This suggests that the lingering impacts of inflations are still weighing heavy on consumers, which will be considered by the Fed as it continues to tame inflation.
Existing Home Sales MoM fell to -4.1% from -2.0% and substantially below market expectations of an increase to -1.5%. This translates to an annualized rate of 3.79m units for October, the lowest level since August 2010, and below forecasts of 3.90m, with offers mainly occurring on starter and mid-priced homes. The housing market continues to be weighed down by a lack of inventory and the highest mortgage rates in over two decades.
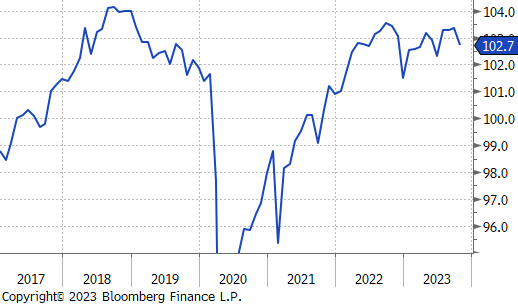
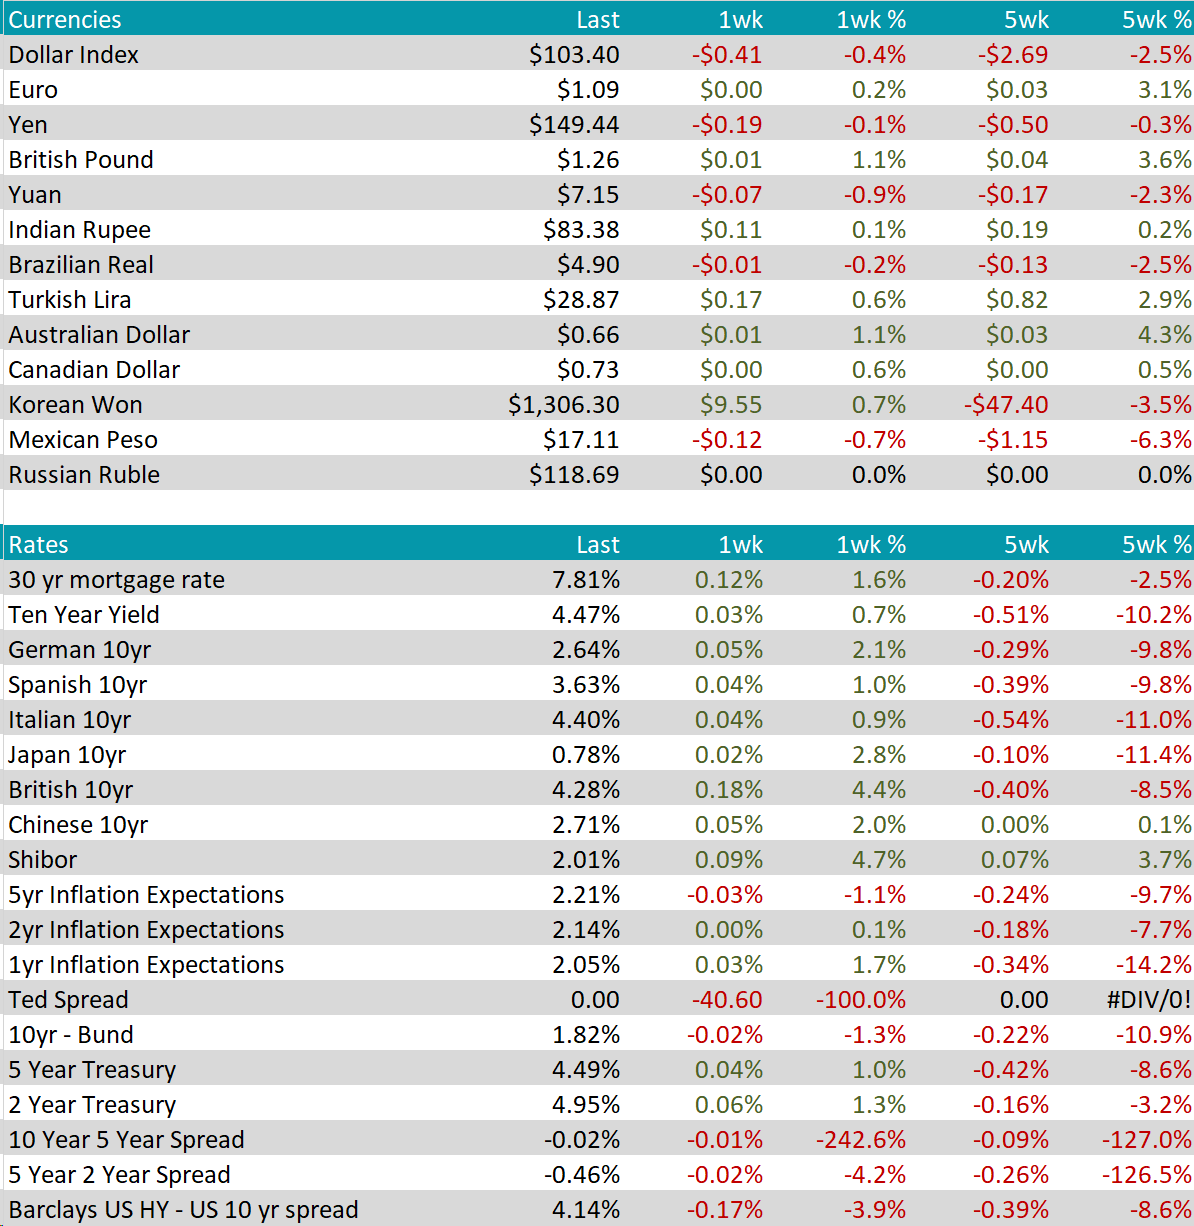
Last week witnessed a notable decline in the Dollar Index (DXY), which dropped to 103.4, marking its lowest levels since August of the previous year. This descent was attributed to diminishing US yields, driven by growing speculation among traders that the Federal Reserve might implement rate cuts sooner than initially anticipated. Market sentiment is leaning towards potential cuts in either March or May of 2024. The dovish sentiments expressed by key central bank figures, such as Fed Governor Christopher Waller and Chicago Fed President Austan Goolsbee, further fueled expectations of imminent interest rate reductions.
The Turkish lira extended its decline against the USD, reaching 28.87 on the USDTRY cross. Despite ongoing interest rate hikes, the Turkish central bank persisted in pursuing ‘intentional devaluation.’ Tightened reserve requirements aimed at absorbing liquidity raised local rates, bringing them closer to the cost of lira borrowing abroad. Over the past three months, the currency consistently hit daily record lows, averaging daily losses just above 0.1%, resulting in a year-to-date decline exceeding 50%. In a surprising move on November 23rd, the central bank increased its benchmark one-week repo rate by 500 basis points to 40%, surpassing market expectations and signaling a commitment to addressing inflation.