Flack Capital Markets | Ferrous Financial Insider
October 6, 2023 – Issue #400
October 6, 2023 – Issue #400
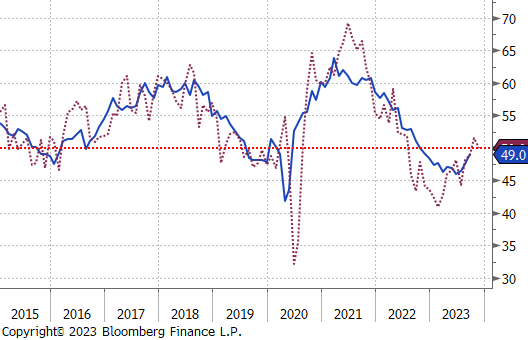
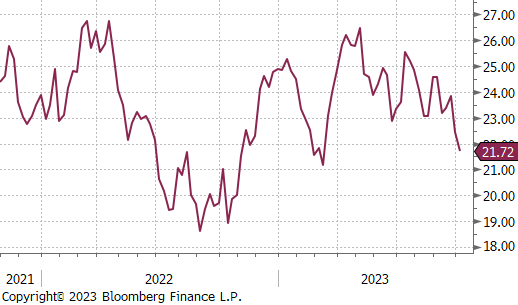
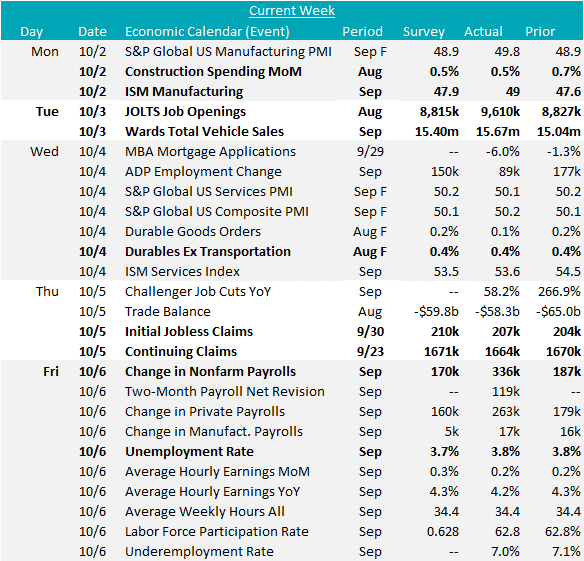
Economic data from the beginning of the month show a stable base of steel consumption despite meaningful headwinds. Manufacturing continues to be the weakest among the sectors with 11 straight months of the ISM Manufacturing PMI in contraction territory, however, green shoots have started to appear. The chart on the right subtracts the inventories subcomponent from a variety of demand variables and provides a reliable forward look for the topline figure. This months forward look eased slightly but continues to suggest that the overall manufacturing sector is trending higher. Furthermore, production and employment subcomponents both moved into expansion territory, the latter confirmed with a better-than-expected increase in Friday’s payroll data (17k jobs added in manufacturing versus expectations of up 5k).
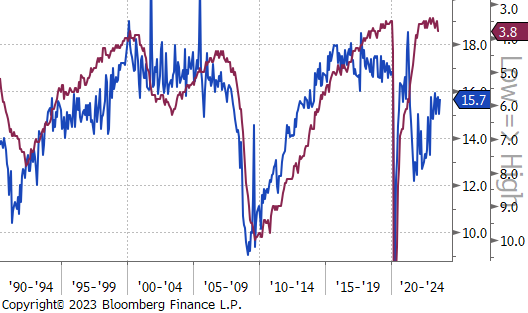
Another closely watched steel consuming sector is transportation, namely autos. Last week, auto sales (seasonally adjusted, annualized) were up to 15.67M units, annualized, this was above expectations of 15.4M. On the second chart we show the historical relationship between the unemployment rate (inverse) and auto sales. This shows that low unemployment drives higher auto sales which has been a fundamental case for a strong backlog in auto production and steel consumption. However, much like in the rest of the economy, higher interest rates are a hurdle to realizing this consumption. Additionally, many have pointed to the auto strike as another constraint. While it is still early, the data was showing a slight inventory build in the first couple of weeks in the strike which only began to reverse late last week. This is because the UAW “stand-up” strike is slowly building and easing out auto production, rather than halting it.
What this means for the steel market is that the preemptive measures by domestic producers to restrain supply ahead of the strike have been exacerbated by the fact that auto consumption has not deteriorated as expected. Stable or improving demand across all sectors have pushed lead times out to the end of the year.
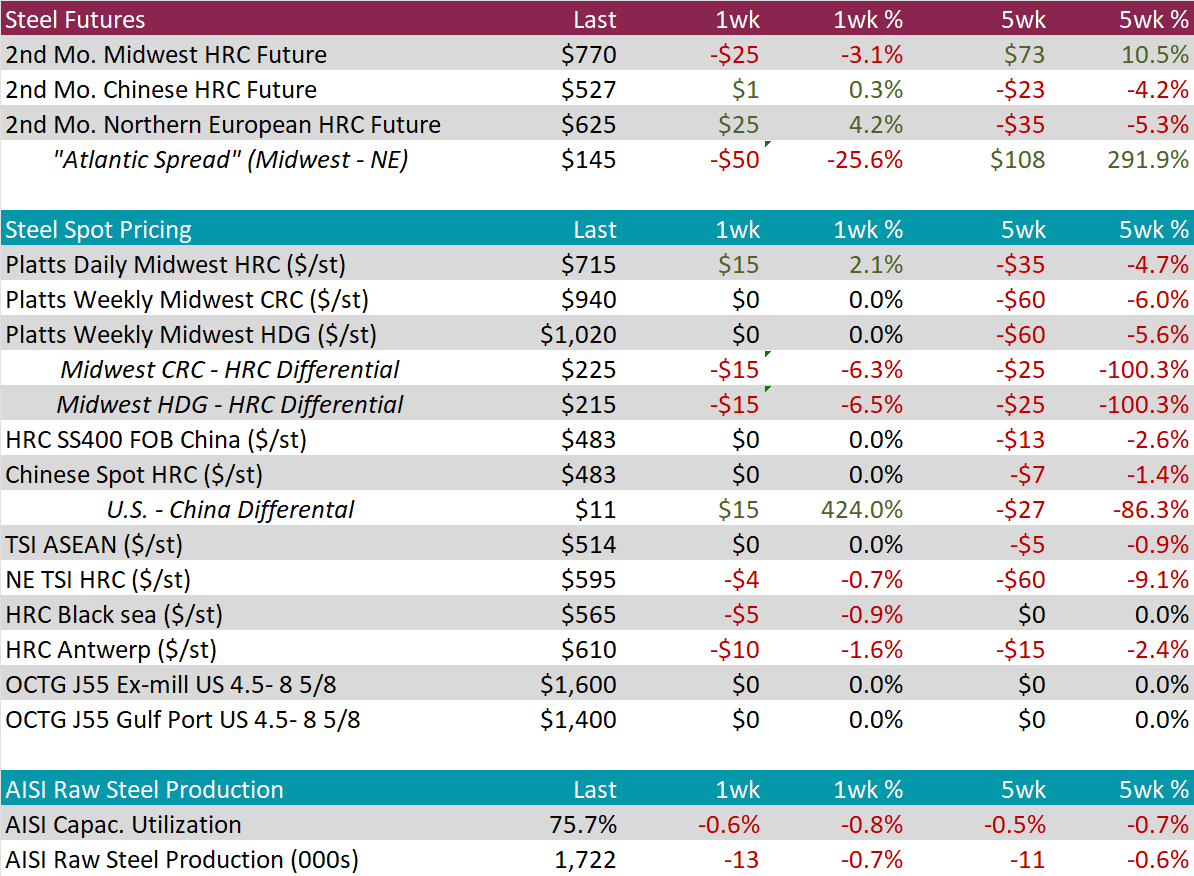
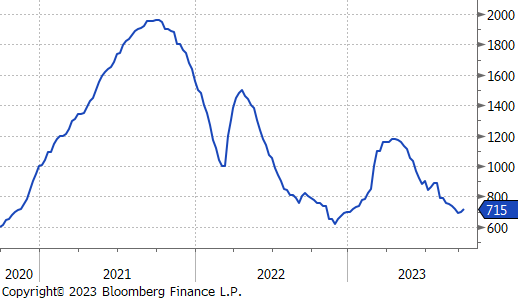
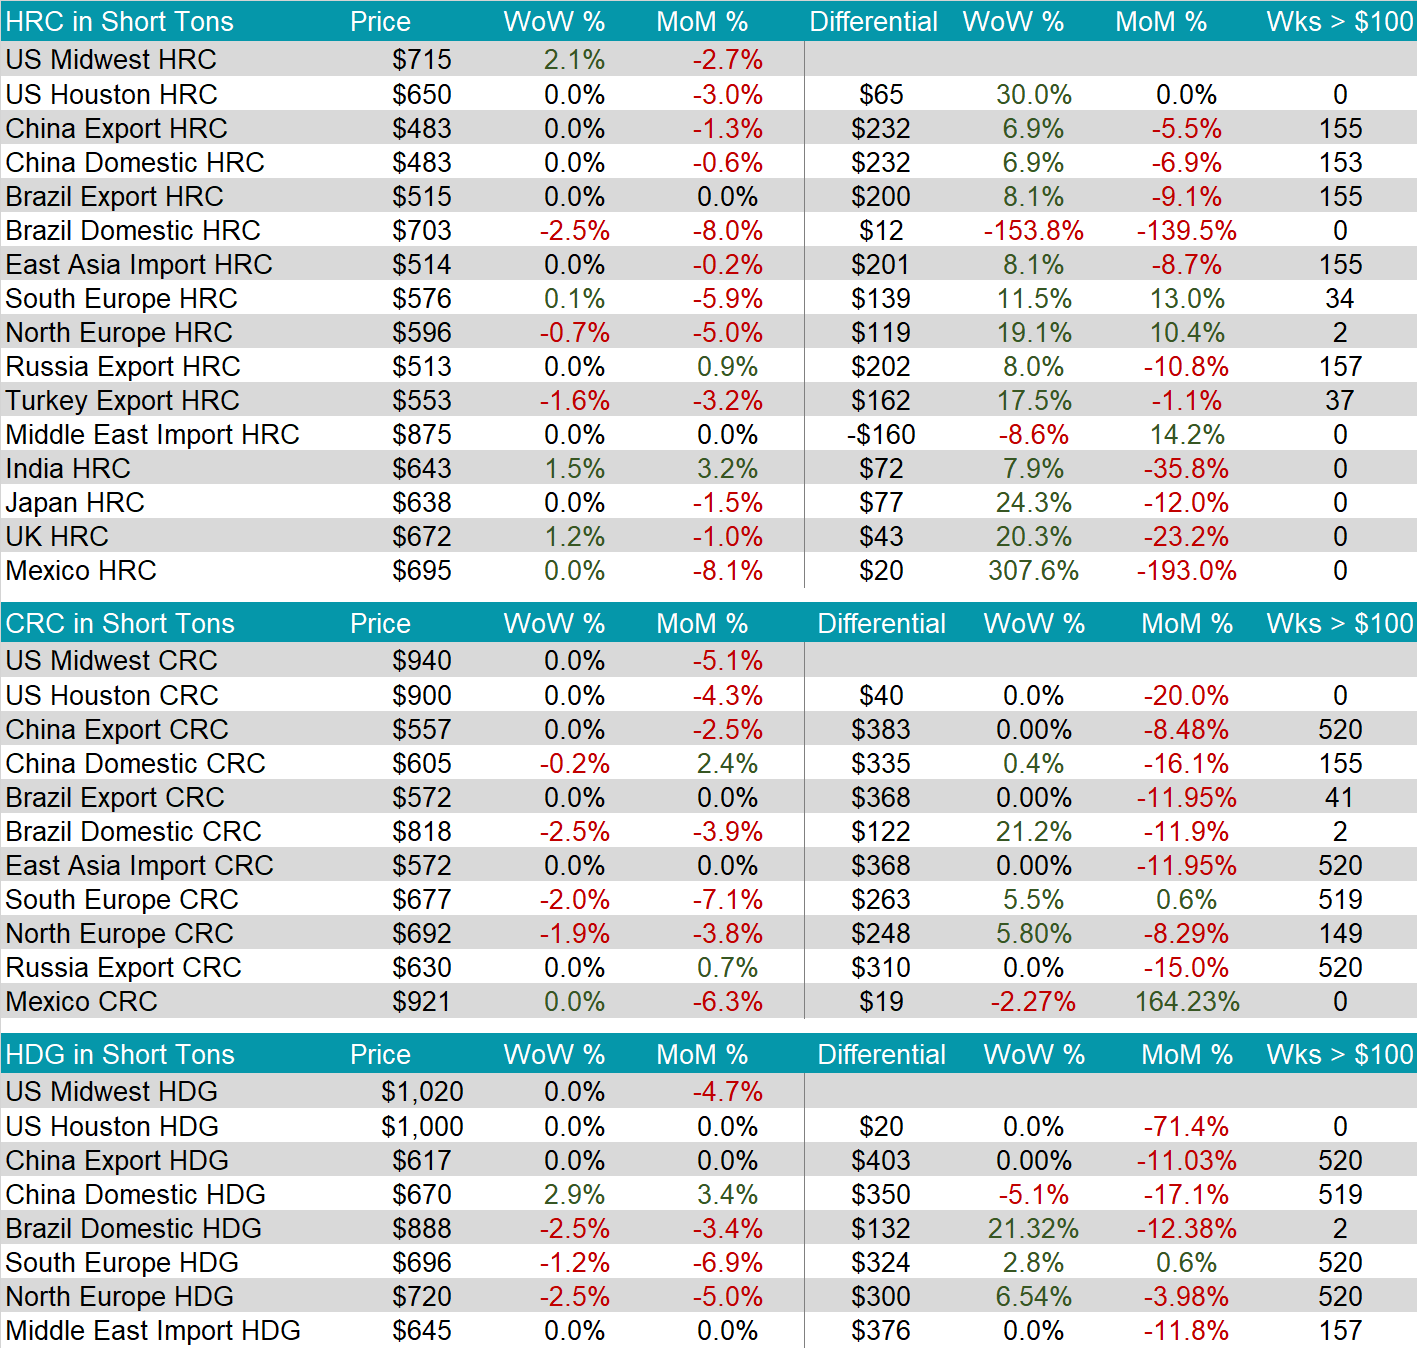
The HRC spot price rose again this week, up $15 or 2.1%, to $715. This further cements that we may be on an upward trend after the spot price hit its lowest level seen in 2023 two weeks ago.
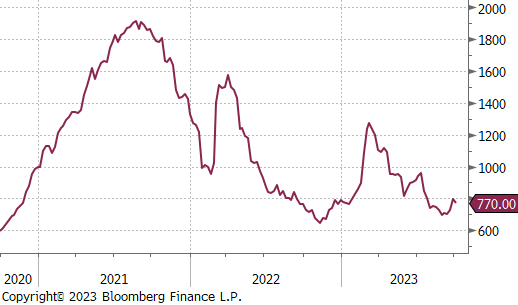
The 2nd month future declined to $770, down $25 or -3.1%. This is the first downward movement since the curve rallied three weeks ago.
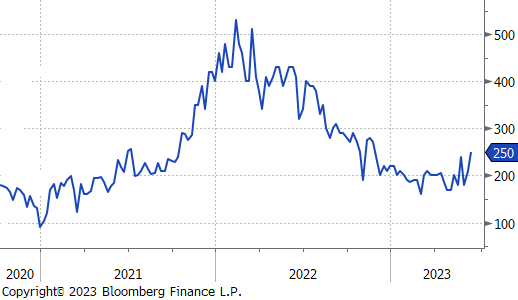
Tandem products were unchanged again last week. This caused the HDG – HRC Differential to decrease by $15.
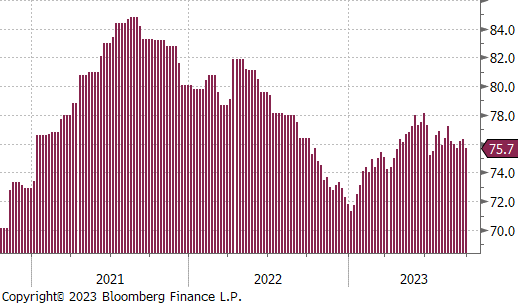
Mill production ticked down a bit, with capacity utilization decreasing by 0.6%, to 75.7%. The current level continues to be in a neutral level, yet this decline may indicate that their demand forecasts are becoming clearer.
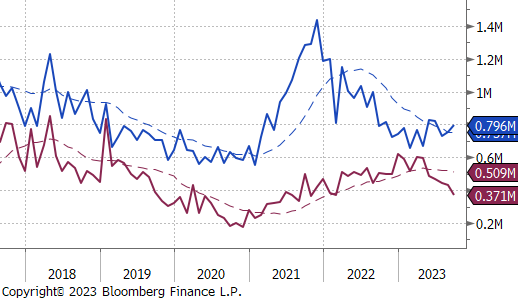
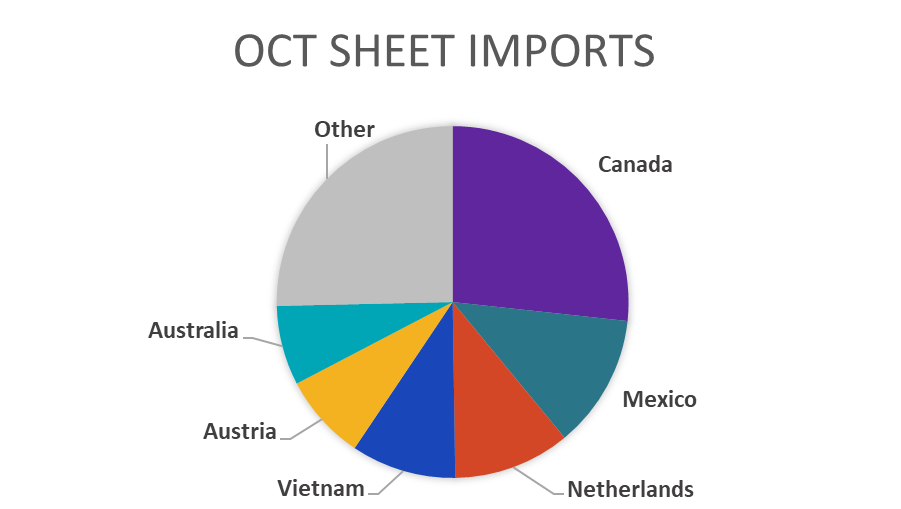
October Projection – Sheet 809k (up 12k MoM); Tube 425k (up 404k MoM)
September Projection – Sheet 765k (up 49k MoM); Tube 426k (down 73k MoM)
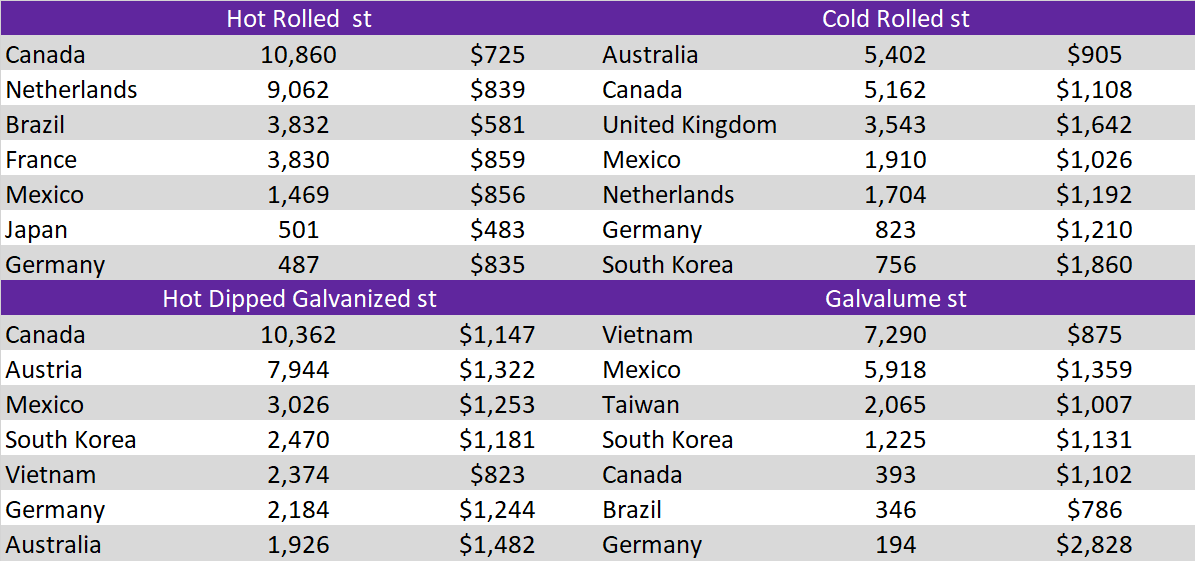
While imports have been grinding higher off the February lows, arrivals are well below expectations given the Q2 differentials. This is exacerbating the mild shortage of material in today’s market.
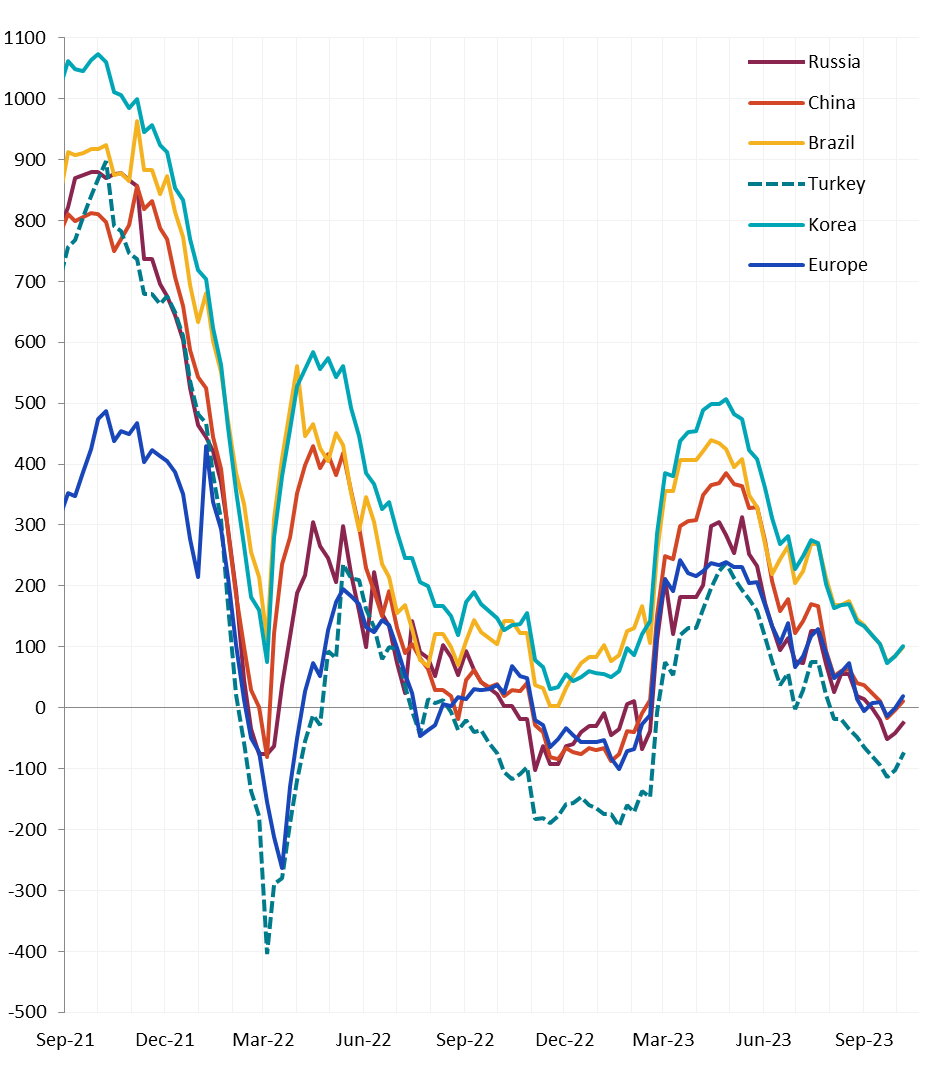
All the watched global differentials were higher again this week. The US domestic HRC price continues to increase from the prior week, after experiencing the biggest decline.
Scrap
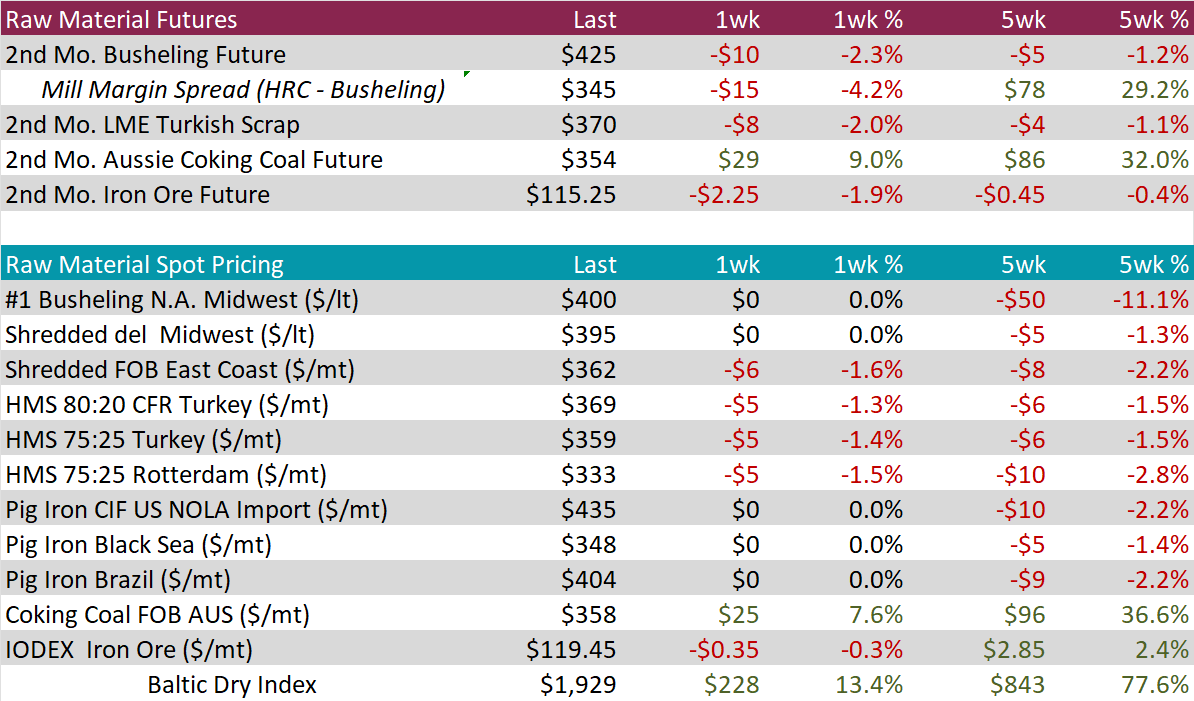
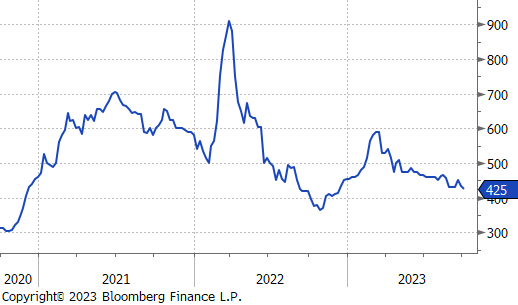
The 2nd month busheling future was down again, this time by $10, or 2.3%, to $425. The mill margin spread, after experiencing a significant increase the previous week, decreased by $15, or 4.2%.
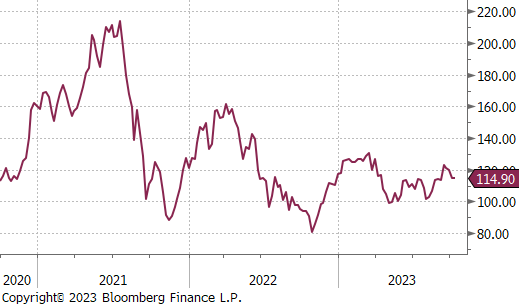
The 2nd month iron ore future declined by $2.25, or -1.9%, to $115.25
Dry Bulk / Freight
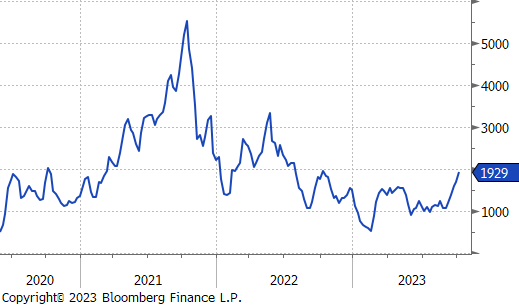
The Baltic Dry Index continued to rise, this time by 13.4%, or $228, up to $1,929, it’s highest level since early October 2022. This upward trend that it is seemingly on indicates that the demand for freight is on the rise.
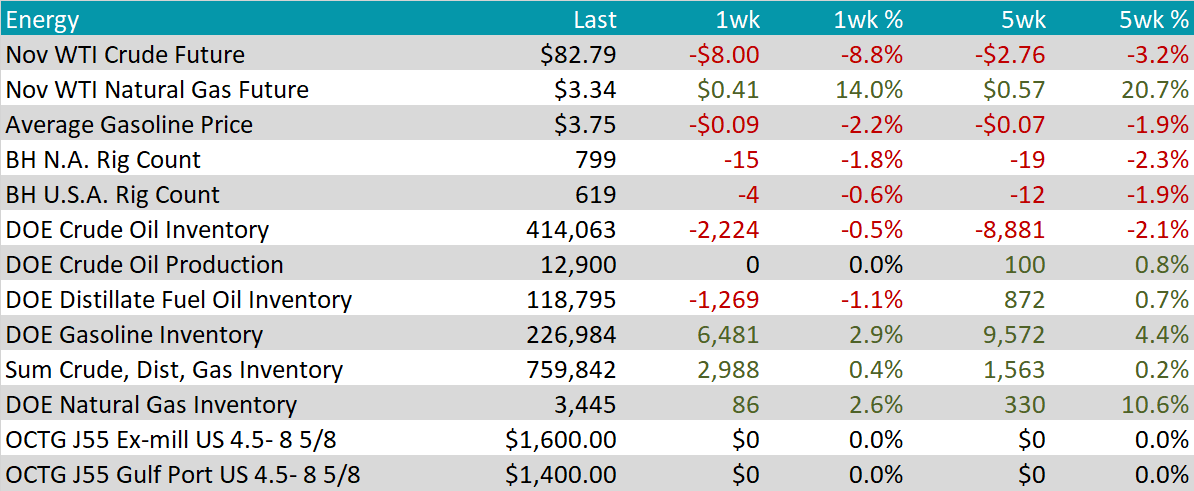
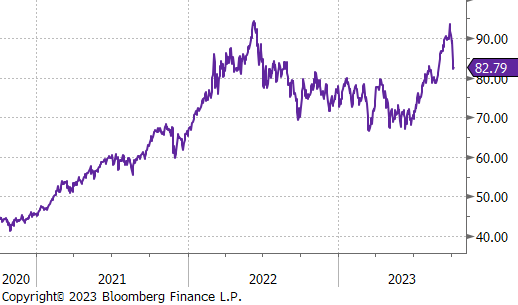
WTI crude oil future lost $8.00 or -8.8% to $82.79/bbl, a steep departure from the prior week, which neared the price high seen in June 2022.
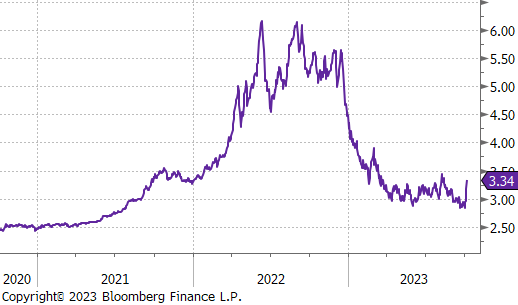
WTI natural gas future gained $0.41 or 14.0% to $3.34/bbl.
The aggregate inventory level was up by 0.4%.
The Baker Hughes North American rig count was down by 15 rigs, and the US count was down by 4 rigs. This marks the 3rd week in a row of reductions.
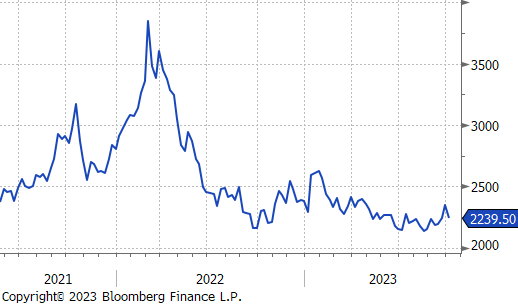
Aluminum futures on the LME retreated, declining by 4.6% to $2,240 per metric ton, reversing the gains from the previous week. As cautioned last week, relying on LME inventory reports to gauge the state of the physical aluminum market may be misleading. Despite historically low levels of available stocks, reports on Tuesday indicated the highest increase in aluminum inventories available for withdrawal in six weeks, contributing to the reversal of the previous week’s positive price trend.
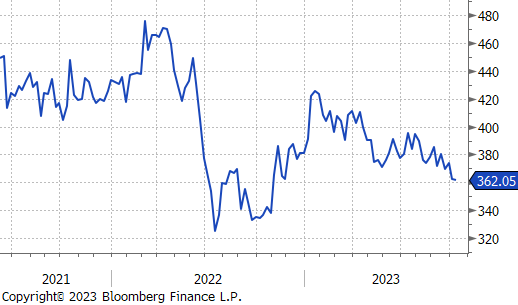
Copper futures close the week with a 2.7% decline, reflecting concerns about additional monetary tightening by the Federal Reserve, which boosted the USD and yields. This scenario diminished the appeal of holding dollar-priced and non-yielding assets such as Copper. Persistent uncertainties surrounding China’s property market and its tightened monetary policy further contributed to the subdued sentiment. The upcoming return of China from the Golden Week on Monday will be closely monitored for potential market impacts.
Silver
Silver extended losses, contracting another 3.2% and bringing 5-week performance to down -11.6%. Silver’s losses are predominantly driven by dollar strength on growing expectations that the Federal Reserve will maintain its hawkish monetary policy stance. Money managers have flipped to bearish from bullish as of Fridays CFTC data, with the net-short position being the most bearish in seven weeks.

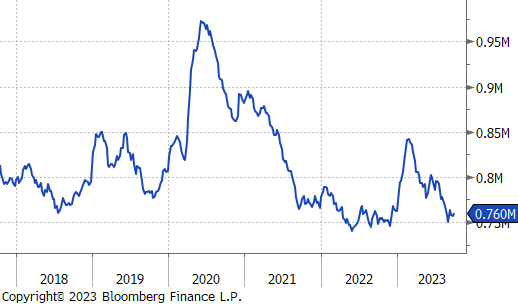
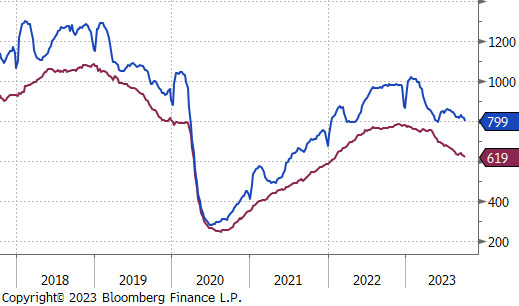
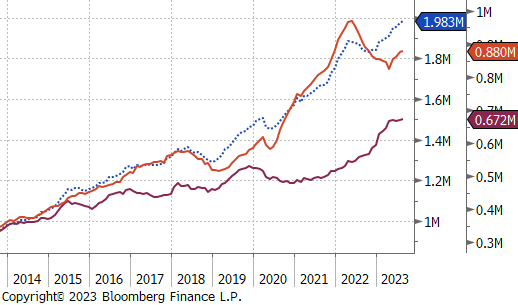
In the face of a challenging high interest rate environment, August seasonally adjusted construction spending has shown noteworthy resiliency. Total spending rose by 0.5% MoM and was in line with market expectations. The primary driver behind this growth was the boost from private residential spending, which was up by 0.6% MoM. Non-residential spending registered it’s increases of 0.4% from July and 17.6% from last year. Longer-term concerns remain in this sector, however, data from the Architectural Billings Index suggests moderation in spending, rather than a meaningful collapse in non-residential spending over the next 9 months.
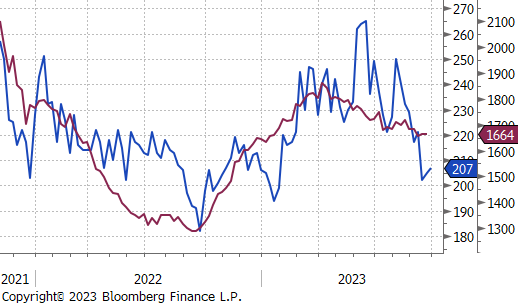
After a significant decrease seen in early September initial jobless claims have been gradually ticking higher. Claims increased to 207k from the prior 204k but were below expectations of 210k. This along with continuing claims declining to 1664k from the prior 1670k reading and being well below expectations of an increase, indicates that the labor market is still at historically tight levels. However, risks are skewed to the upside for claims. Outside of normal seasonal factors and headwinds from higher rates, the ongoing UAW strikes and a potential government shutdown, could put meaningful drags on the economy and increase jobless figures.
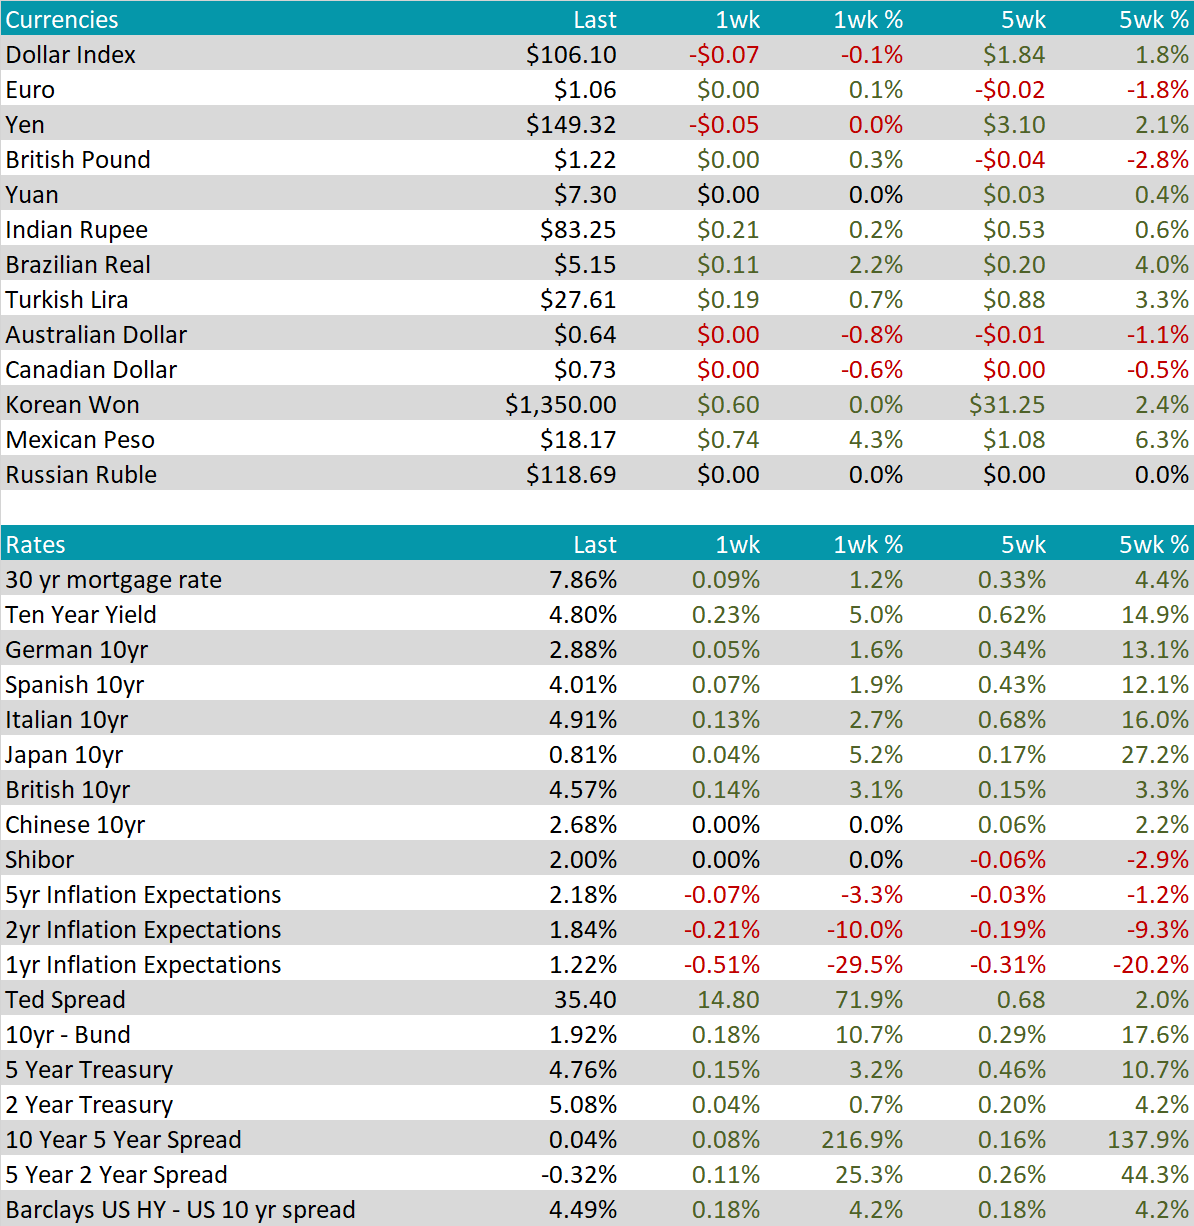
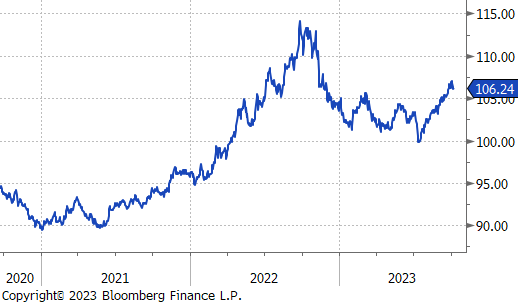
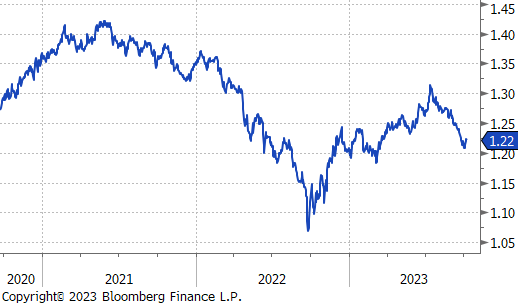
The GBPUSD increased to 1.22 after being on the decline. This is the result of higher for longer interest rate policy in the US due to robust labor market data, while the Bank of England appears to be nearing the end of its tightening cycle. The BoE’s decision to keep interest rates stable and a surprising drop in inflation has suggested that the UK may not be heading into a recession.
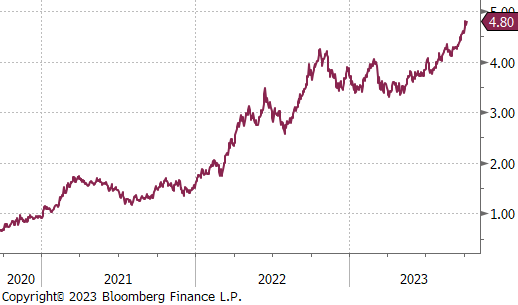
Following the surprising results from non-farm payrolls, confirming earlier evidence of a tight labor market, the yield on the US 10-year Treasury rose to a 16-year high of 4.8%. Evidence continues to highlight the resiliency of the US economy amid high-interest rates and a high-inflationary environment, which is causing some market participants to believe that neutral interest rates have shifted considerably higher since the 2008 recession. Thus, bets that the Fed will refrain from considerably cutting rates in normal conditions triggered a selloff of long-dated government bonds, with the yield on the 10-year Treasury note soaring nearly 30bps this week.
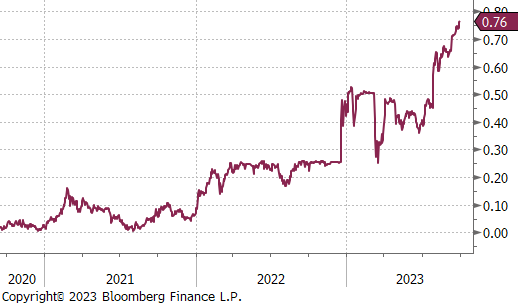
Japan’s 10-year government bond yield hit ten-year highs at roughly 0.8%, despite the Bank of Japan’s (BOJ) efforts to lower it by purchasing 300-billion-yen worth of notes with maturities between 5 and 10 years. This stemmed from the central bank’s decision to allow JGB yields to increase above 0.5% sparking market speculation about Japan’s escape from negative interest rates. In September, the BOJ continued its dovish monetary policy stance, emphasizing Japan’s distinct position globally. While other countries are trying to restrain inflation pressure, Japan is attempting to increase it in a sustained way.
