Flack Capital Markets | Ferrous Financial Insider
October 11, 2024 – Issue #453
October 11, 2024 – Issue #453
Overview:
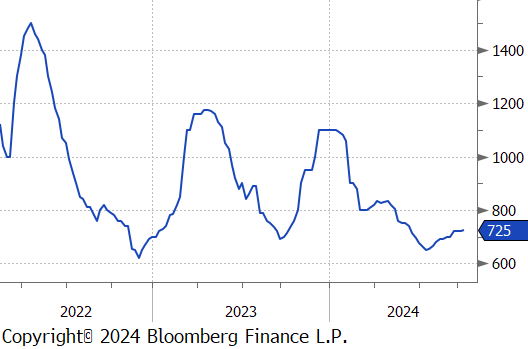
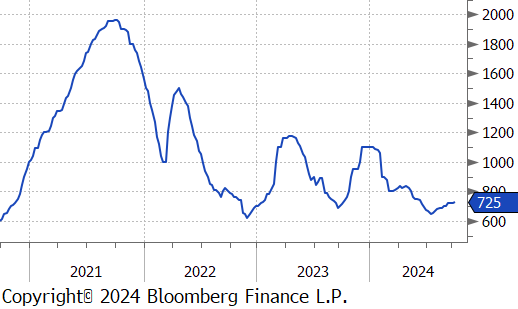
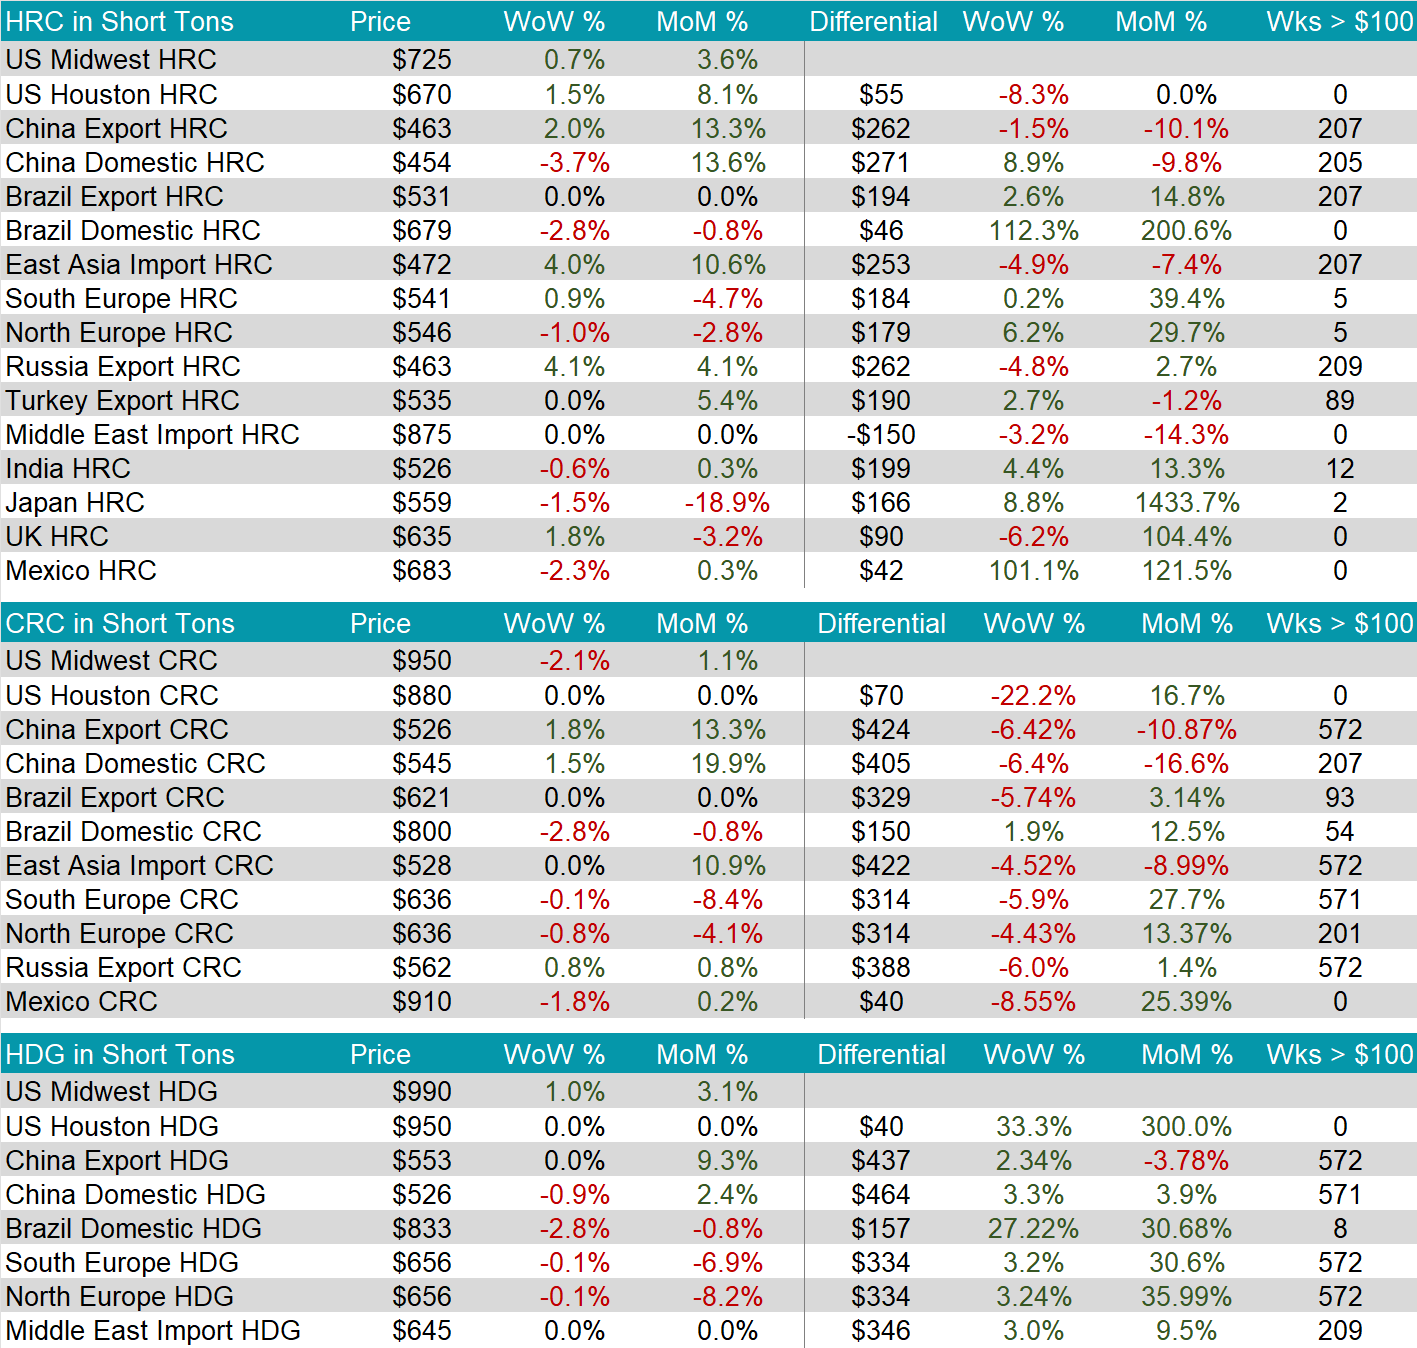
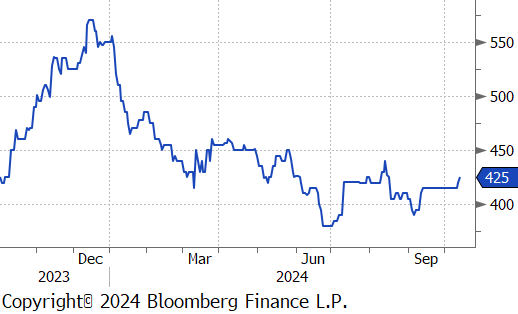
The HRC spot price rose by $5 or 0.7% to $725 after remaining stagnant for three consecutive week. At the same time, the HRC 2nd month future fell by $24 or -3.2% to $725, declining for the second straight week.
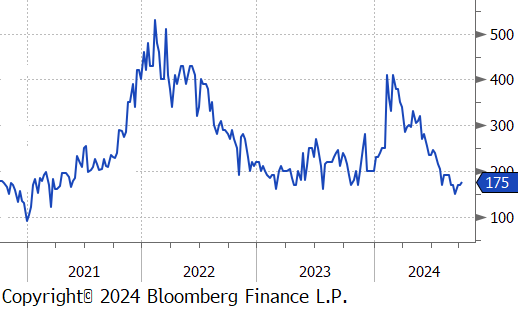
Tandem products were mixed with CRC dropping by $20 while HDG increased by $10, resulting in the HDG – HRC differential rising by $5 to $175.
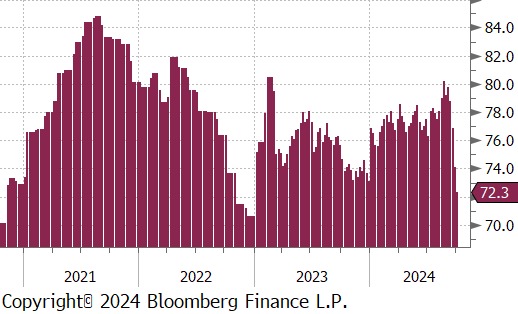
Mill production dropped further, with capacity utilization ticking down by -1.8% to 72.3%, bringing the raw steel production down to 1.606m net tons – the lowest level since December 2022.
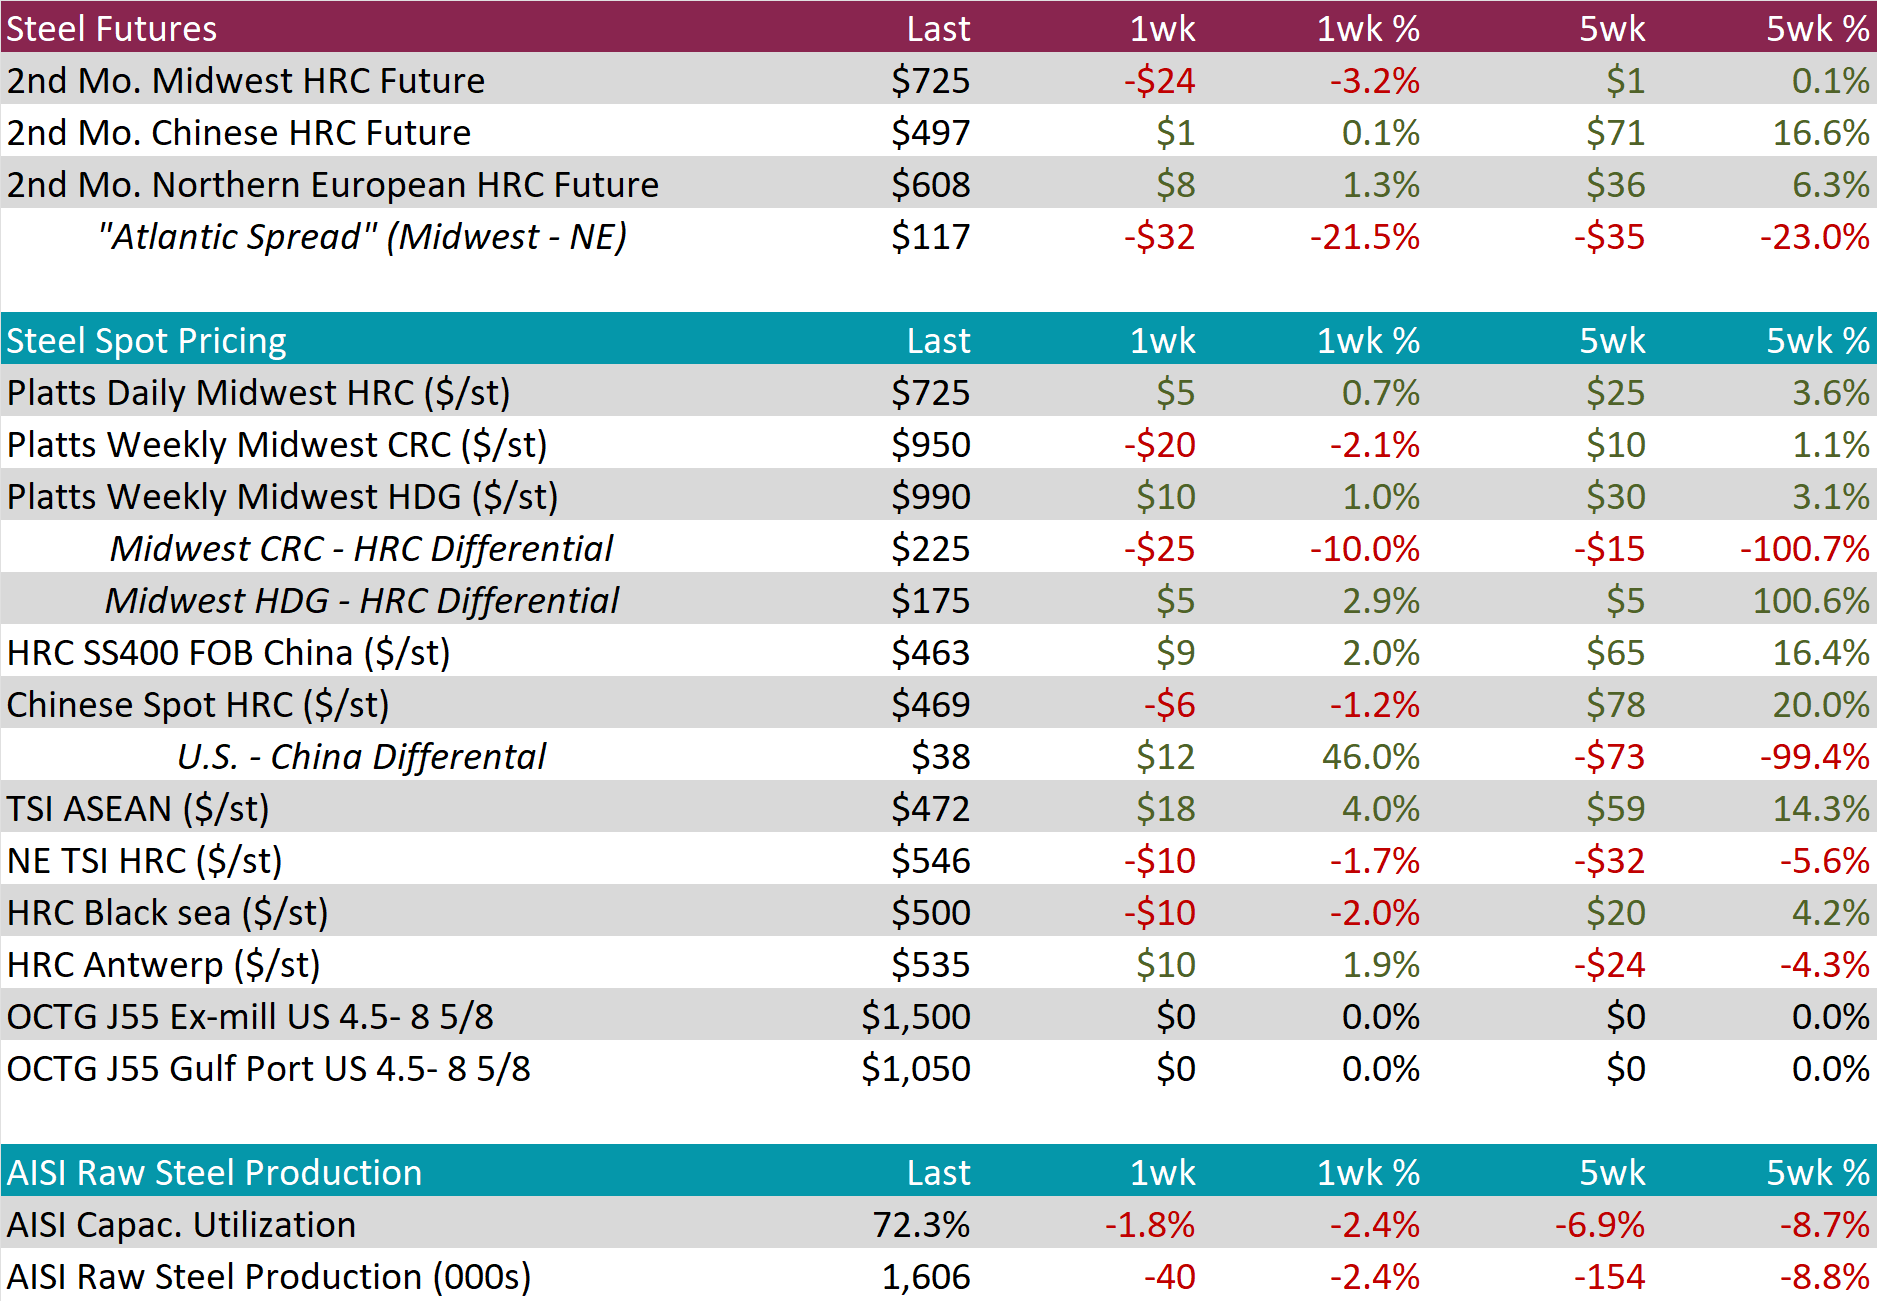
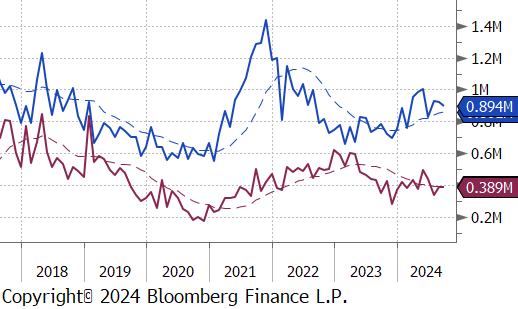
October Projection – Sheet 896k (up 22k MoM); Tube 441k (up 48k MoM)
September Projection – Sheet 874k (down 45k MoM); Tube 393k (up 4k MoM)
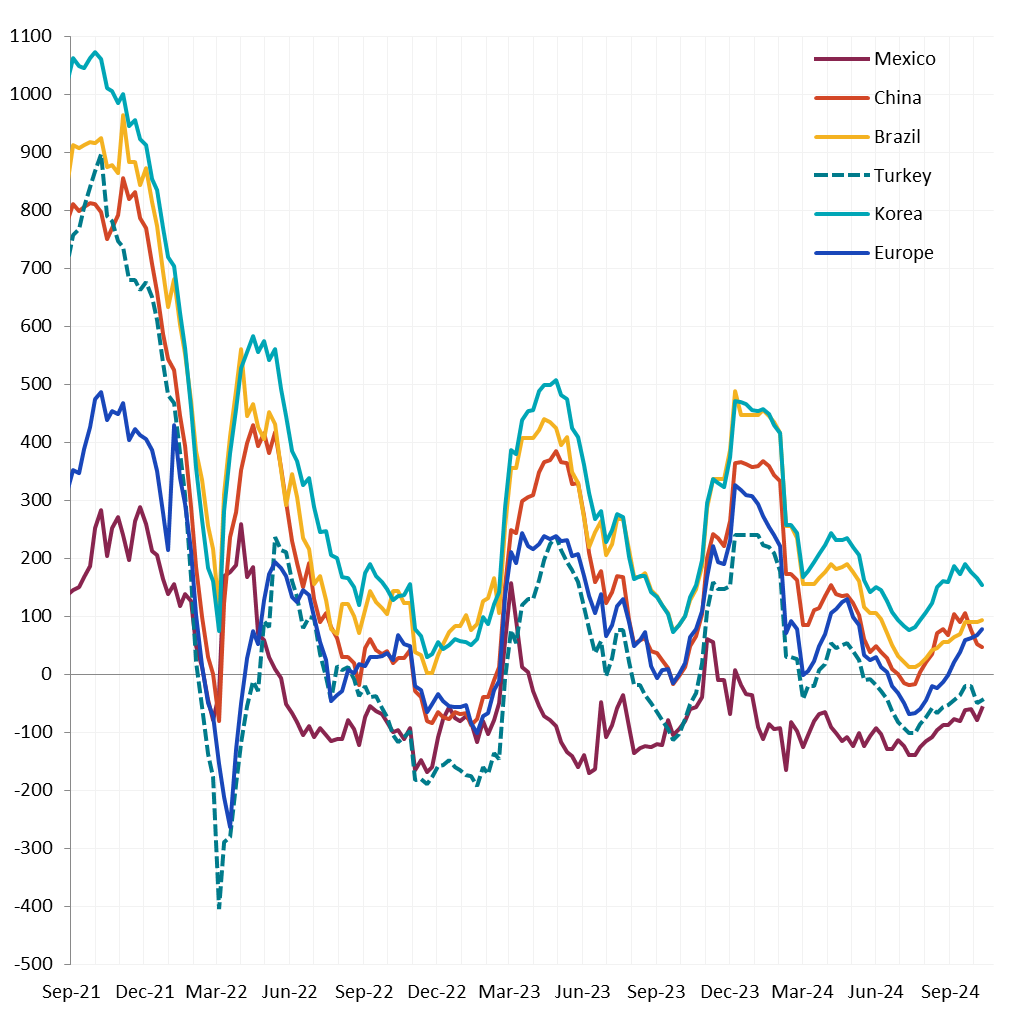
Watched global differentials were mixed this week, with China Export HRC rising by 2.0%, Korea HRC increasing by 4.0% and Russia Export HRC up by 4.1%, whereas N Europe fell by -1.0% and Mexico down by -2.3%.
Scrap
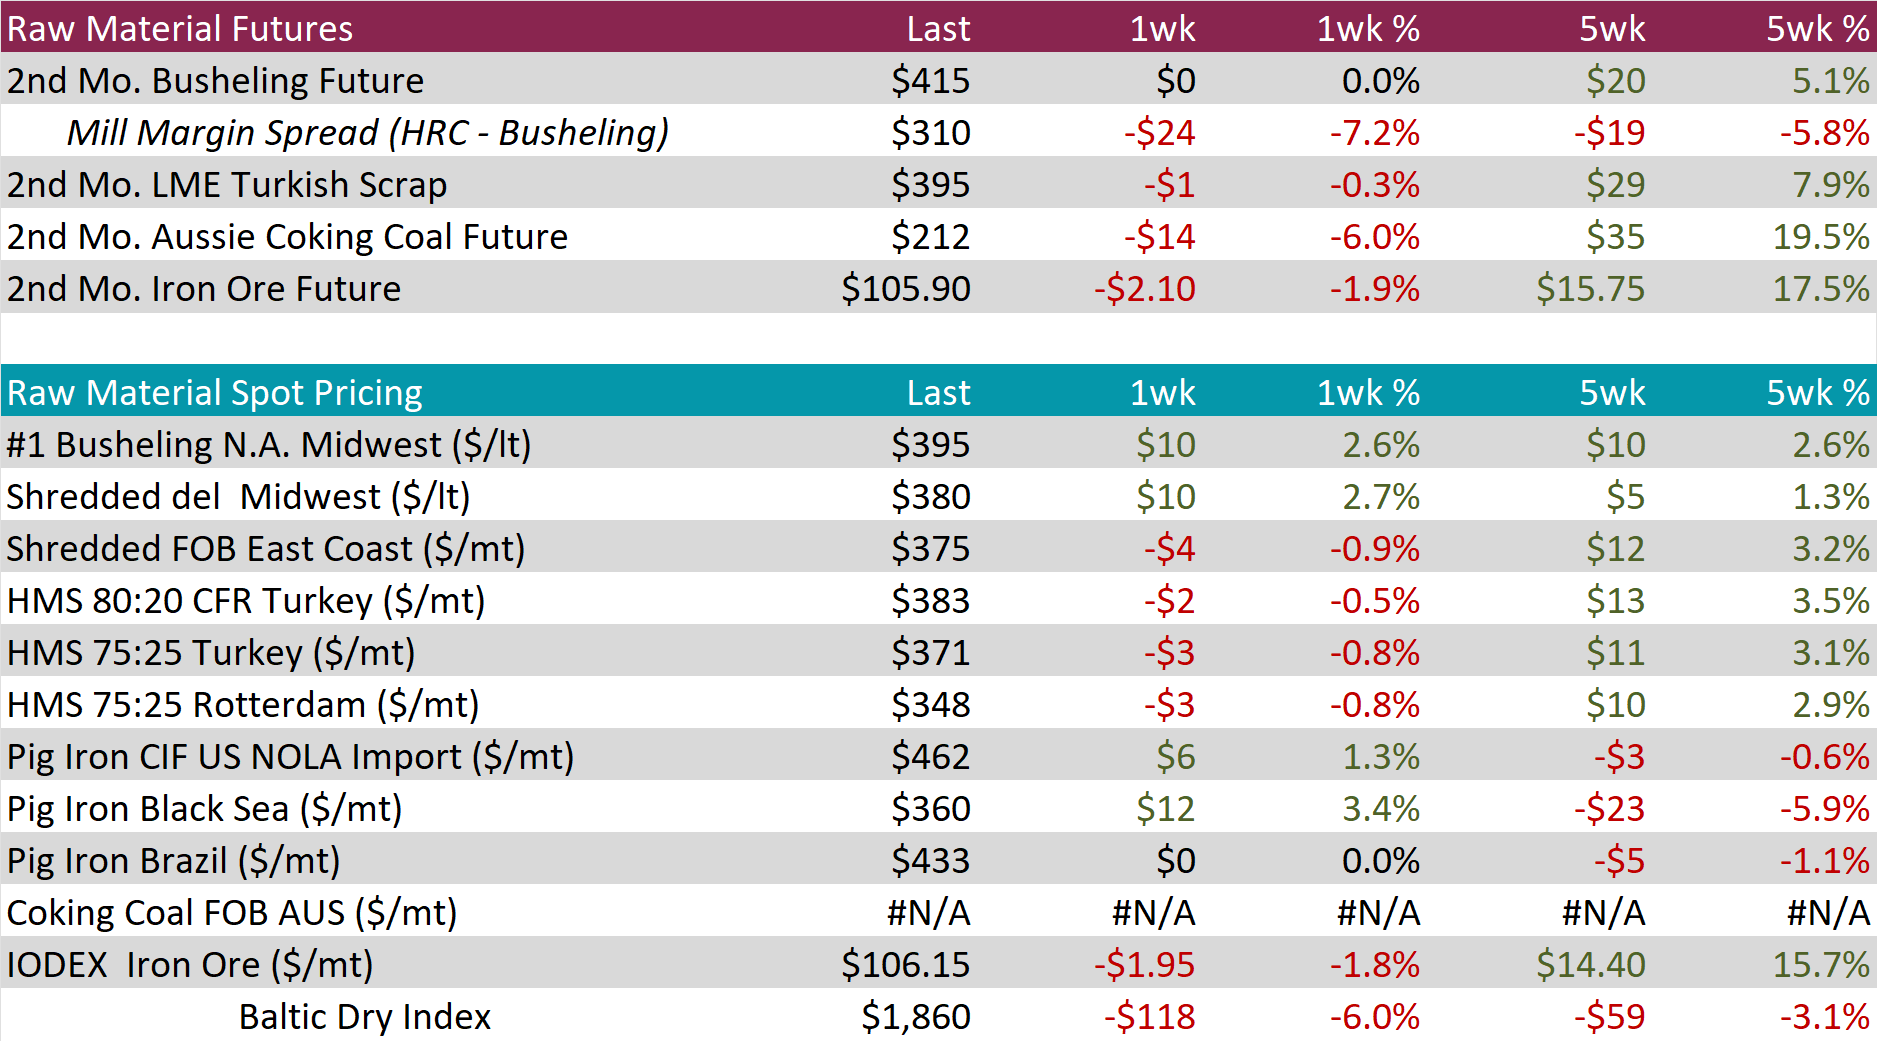
The 2nd month busheling future remained unchanged at $415, marking the fifth consecutive week of holding steady.
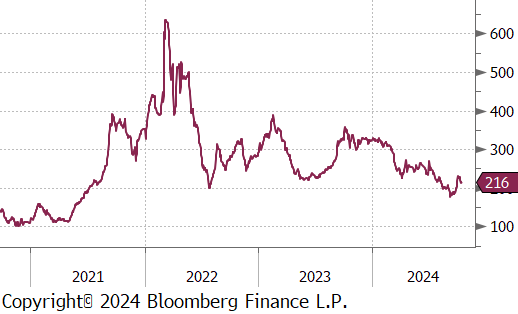
The Aussie coking coal 2nd month future fell by $14 or -6.0% to $212, ending four consecutive weeks of increases.
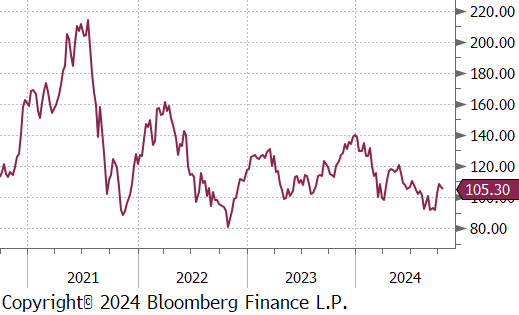
The iron ore 2nd month future declined by $2.10 or -1.9% to $105.90, bringing the five-week price change to be up by $15.75 or 17.5%.
Dry Bulk / Freight
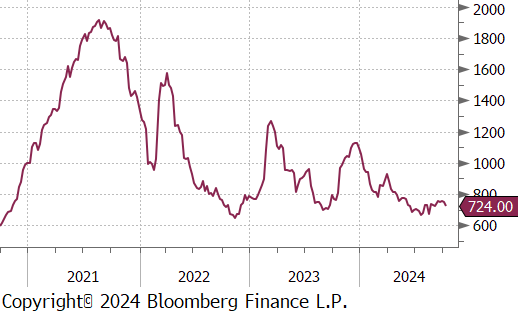
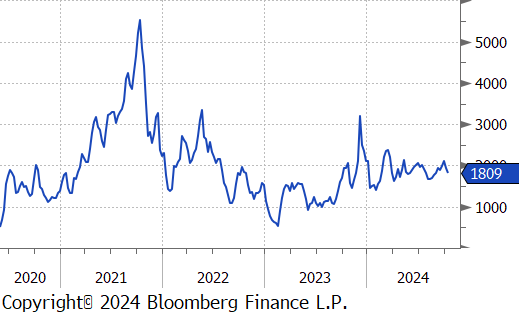
The Baltic Dry Index slipped by $118 or -6.0% to $1,860, marking the second consecutive week of price decreases.
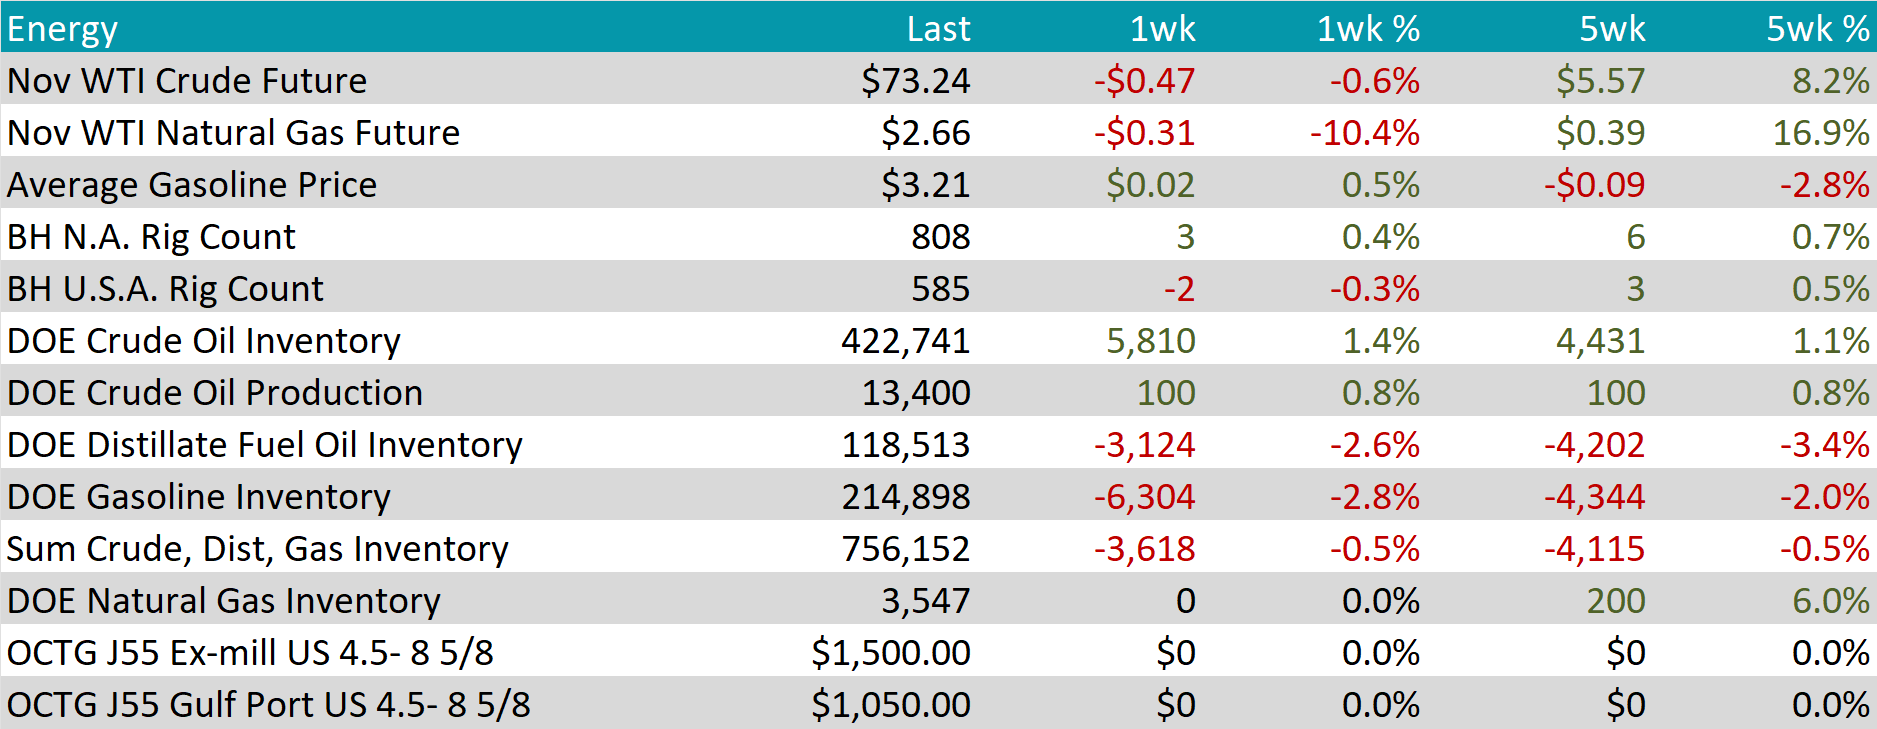
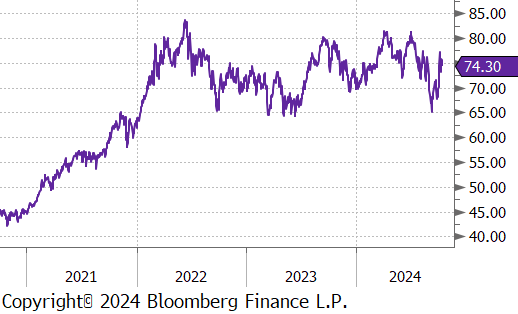
WTI crude oil future lost $0.47 or -0.6% to $73.24/bbl.
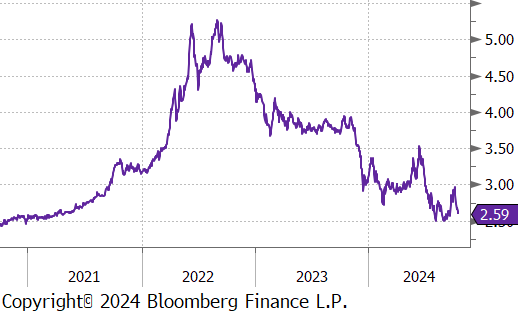
WTI natural gas future lost $0.31 or -10.4% to $2.66/bbl.
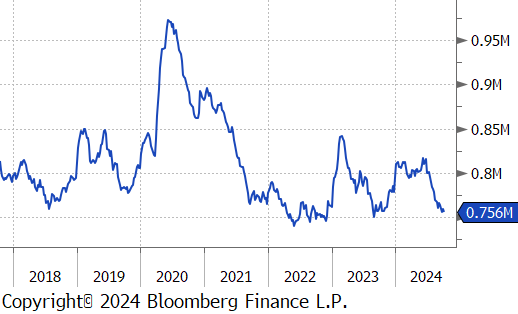
The aggregate inventory level declined, falling by -0.5%.
The Baker Hughes North American rig count added 3 rigs, bringing the total count to 808 rigs, whereas the US rig count reduced by 2 rigs, bringing the total count to 585 rigs.
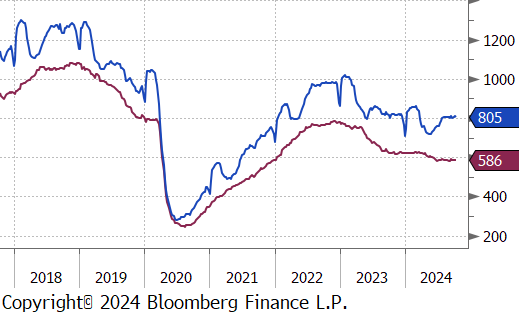
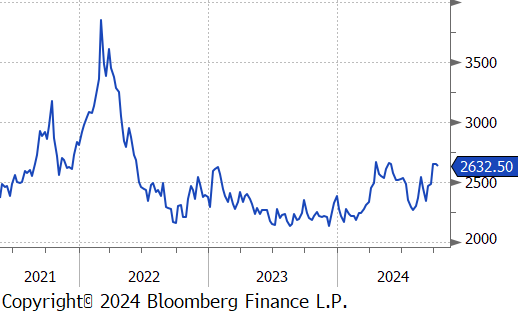
Aluminum futures declined by $88 or -3.3% to $2,541. This occurred as Emirates Global Aluminium (EGA) announced a suspension of bauxite exports from its operations in Guinea. This halt in bauxite, a key raw material for aluminum production, has led to concerns about supply disruptions, with alumina futures in Shanghai also rising to their highest levels since the contracts began in 2023. Although EGA’s alumina refinery in Abu Dhabi continues to operate normally, the broader market has been affected by supply constraints, including previous curtailments from Alcoa and Rio Tinto due to gas shortages and environmental inspections in China. The ongoing supply challenges are adding upward pressure on aluminum prices, with global demand, particularly from Chinese smelters, continuing to grow.
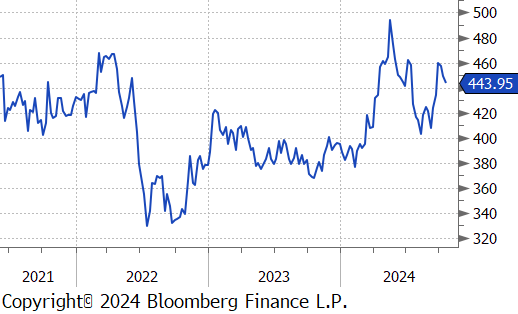
Copper futures decreased by $15.35 or -3.4% to $440 nearing the two-week low as weak economic signals from China weighed on demand expectations for the world’s largest copper consumer. In a briefing, China’s Ministry of Finance reiterated plans to issue more debt to support the struggling housing market, but the lack of specific figures left investors skeptical about the scale of the stimulus. Additionally, a slew of economic data added to concerns about China’s manufacturing sector. Chinese exports in September fell short of expectations, raising doubts about factories’ ability to compensate for weak domestic demand through foreign sales. Furthermore, new yuan loans and inflation figures also came in below forecasts. The continued stagnation of Chinese copper smelters’ processing fees, hovering near zero, further reflected the oversupplied market for refined copper, signaling poor demand.
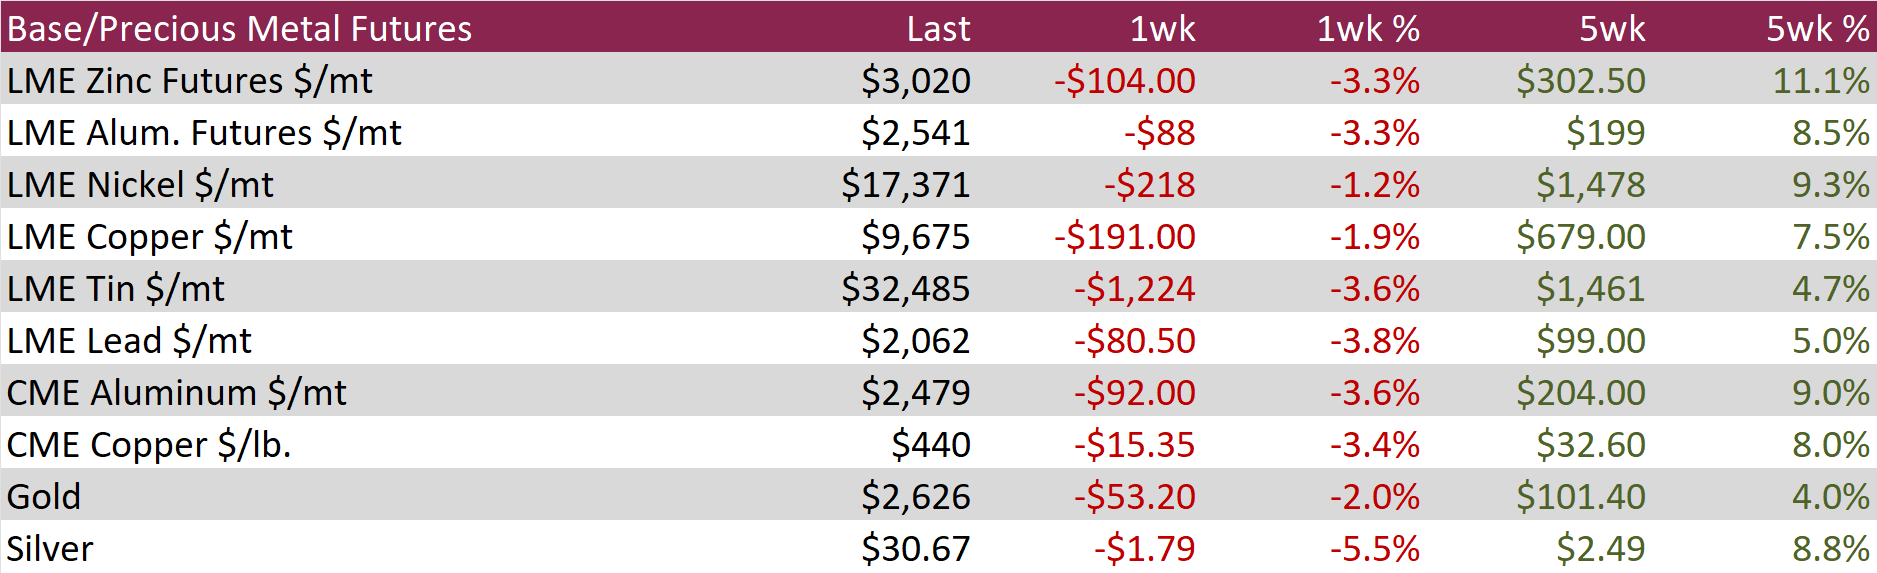
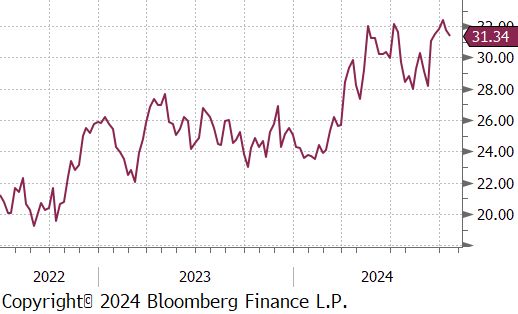
Silver fell by $1.79 or -5.5% to $30.67 as volatility increased amid investor reactions to China’s latest stimulus announcements and uncertainty over the trajectory of US interest rate cuts. During a Saturday briefing led by Finance Minister Lan Foan, the Chinese government pledged to boost borrowing to support the property market, provide subsidies for low-income households, and strengthen state banks’ capital, but did not disclose the size of the package. Markets had been anticipating a significant fiscal stimulus in the range of 2 to 10 trillion yuan. Meanwhile, commodities faced additional pressure as investors speculated that the US Federal Reserve may hold off on further large-scale rate cuts in its remaining meetings this year.
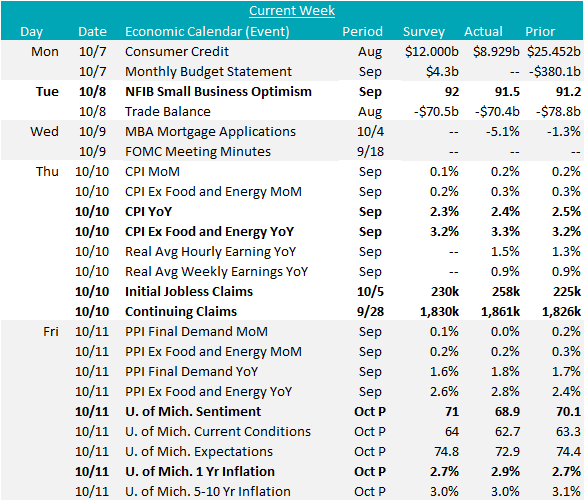
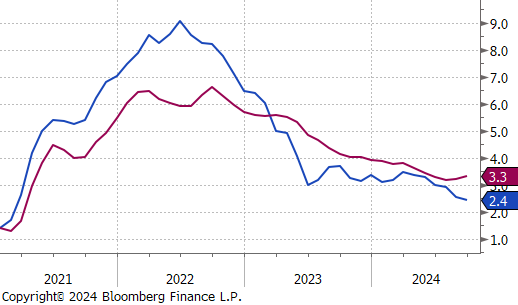
September’s MoM CPI and Core CPI both came in slightly elevated, up 0.2% vs 0.1% and 0.3% vs 0.2%, respectively. The YoY CPI Core which excludes food & energy rose for the second consecutive month, now up to 3.3% from August’s 3.1%. The clear overarching trend is that disinflation will continue, with current YoY levels 0.8% below where we were in Sept 2023 (4.1%). However, if recent stickiness in YoY price pressure proves to be more than a blip, will need to reevaluate the pace of the cutting cycle.
Another datapoint to flag came from the University of Michigan Consumer Sentiment Survey. The preliminary topline figure for Oct came in below expectations of 71 and last month’s 70.1, moving down to 68.9 but the most applicable signal for the FED was the unexpected rise in 1yr Inflation Expectations up to 2.9% from 2.7%. On the other hand, the Sept Topline MoM PPI was below expectations and unchanged, as energy prices kept the index stable, while Core PPI rose. Overall, price pressure from producers does not currently suggest that there has been much cost push pressure on consumers.
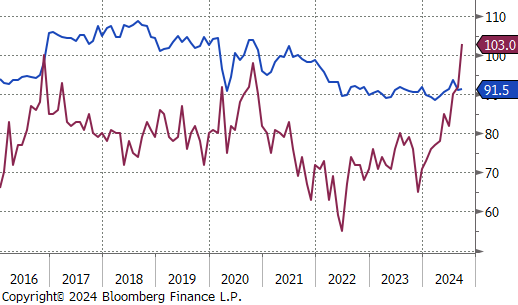
The NFIB Small Business Optimism index rose to 91.5 in Sept, a tick up from 91.2 but below the expected 92.0. This marks the 33rd consecutive month the index has remained below the 50-yr average of 98. Additionally, the Uncertainty Index surged to 103, the highest level on record. While the uncertainty component typically surges heading into a presidential election, the “record level” shows the compounded impact of elevated borrowing costs.
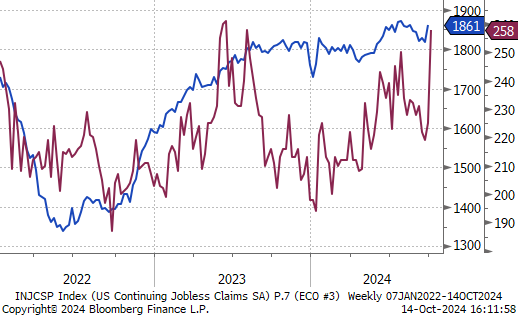
Finally, initial jobless (258k vs 230k) and continuing claims (1,861k vs 1,830k) both surged, providing a contradictory signal from the impressive payroll additions from the week prior. However, upon further inspection, this can be almost entirely explained away by Hurricane Helene and the ongoing strike from Boeing and thus the surprise does not signal a fundamental shift in the labor market. We anticipate these will be temporarily elevated (especially as the impact of Milton works through the labor market). From a policy perspective, the FOMC will likely look through the surge in claims and potentially lower than expected payrolls number at their next meeting.