Flack Capital Markets | Ferrous Financial Insider
October 13, 2023 – Issue #401
October 13, 2023 – Issue #401
Over the last couple of weeks, we have been focused on highlighting the upside risks in the steel market, as we viewed sentiment to be overly sour. Our outlook was supported by the fact that:
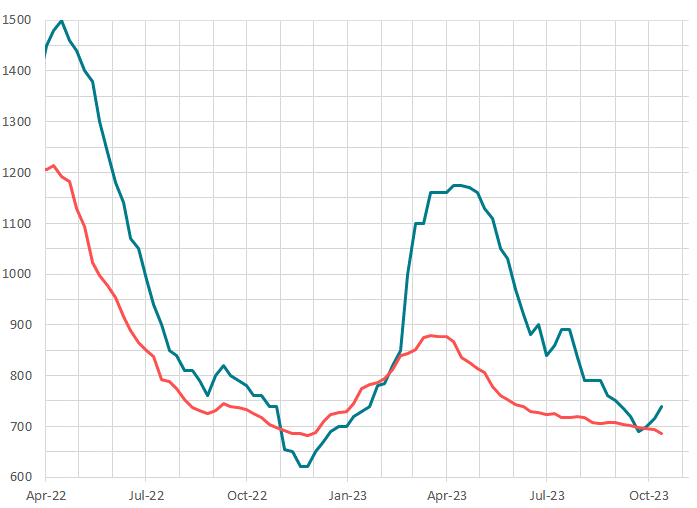
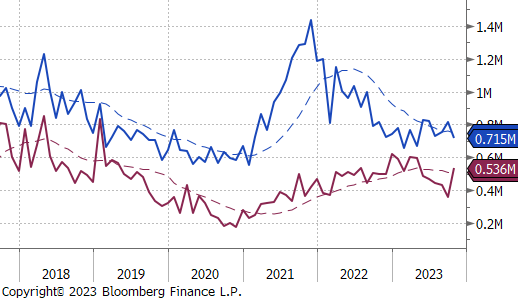
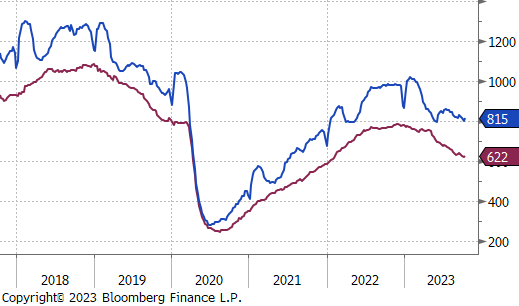
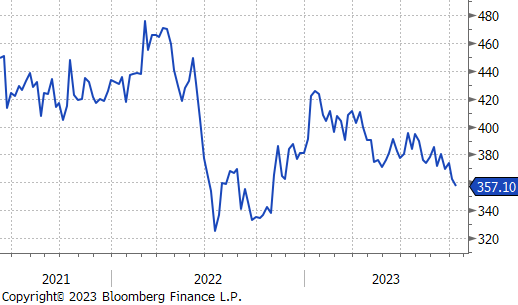
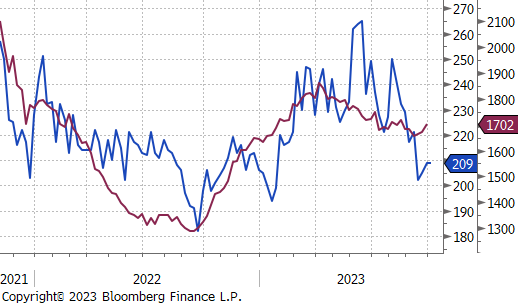
Now that spot price assessments are starting to support this theory, it is a good time to highlight one of the last remaining near-term downside risks which could put a ceiling on the upcoming rally. The chart on the right shows the U.S. domestic (blue) and global (tariff adjusted, including transportation, orange) HRC prices going back to April 2022.
The takeaway from the chart is that the U.S. price is pushing higher, while global prices continue to retreat. Over the last ten years, whenever this happened (2014, 2015, & 2019), the U.S. rally lost steam and fizzled out. If this divergence continues, historical data suggest that higher domestic prices are not sustainable over the long-term. With that said, there are also solid reasons to believe that either this time is different, or global prices may be near their own respective bottom. The case for why this time might be different is that this is the first time we are testing this dynamic in the post pandemic environment – current supply (import arrivals + domestic production) was meaningfully higher in those instances than they are today. As for the potential for higher global prices, vital data will be available in the coming days, when World Steel releases global production figures. Through August, we observe a 6.7% cut in global production since the March peak. The market expectation for September is additional cuts, however, the scale is not yet clear. Consumption coming out of Europe remains poor, however we may be in the early stages of the long-awaited Chinese recovery, with economic data surprising to the upside over the last month.
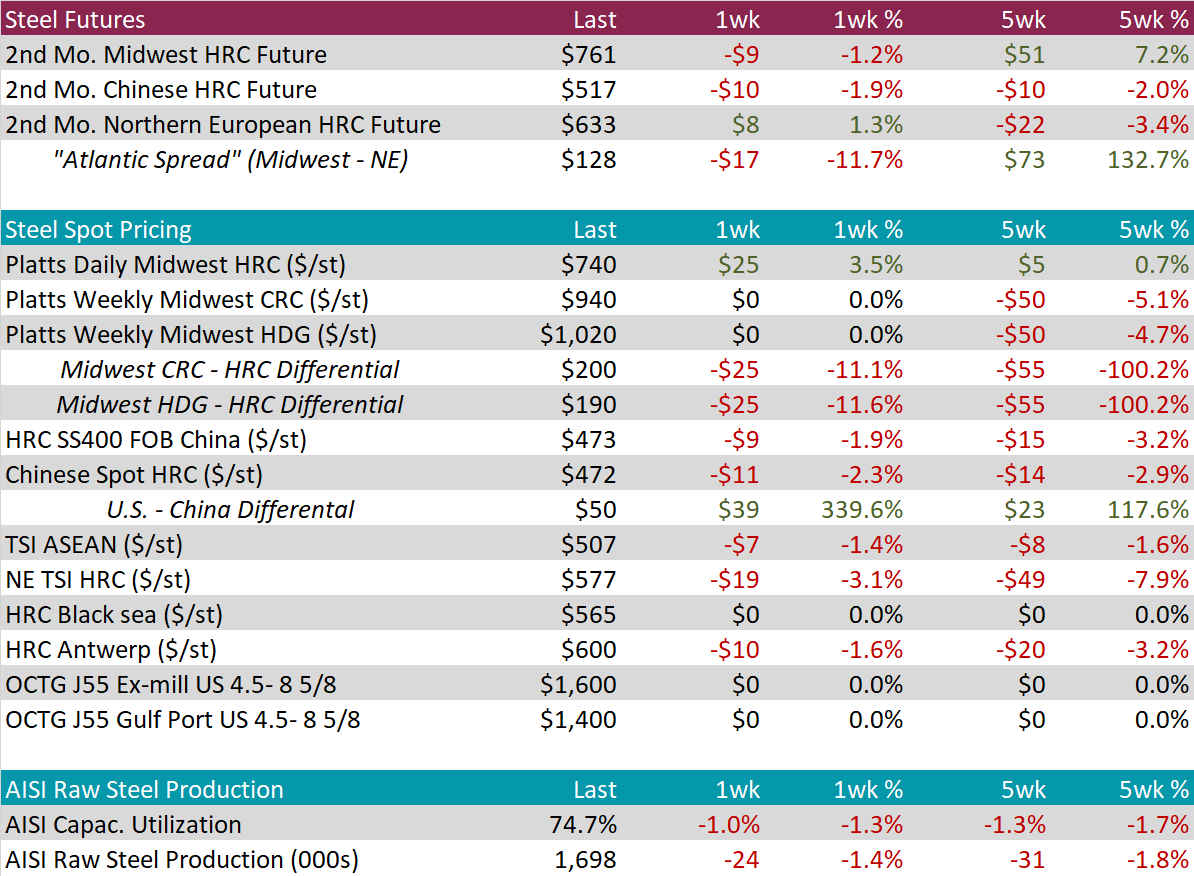
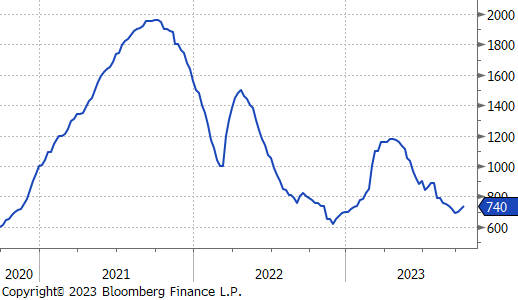
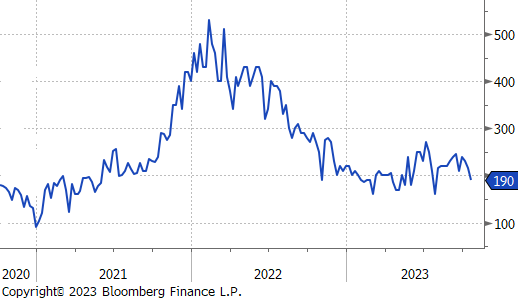
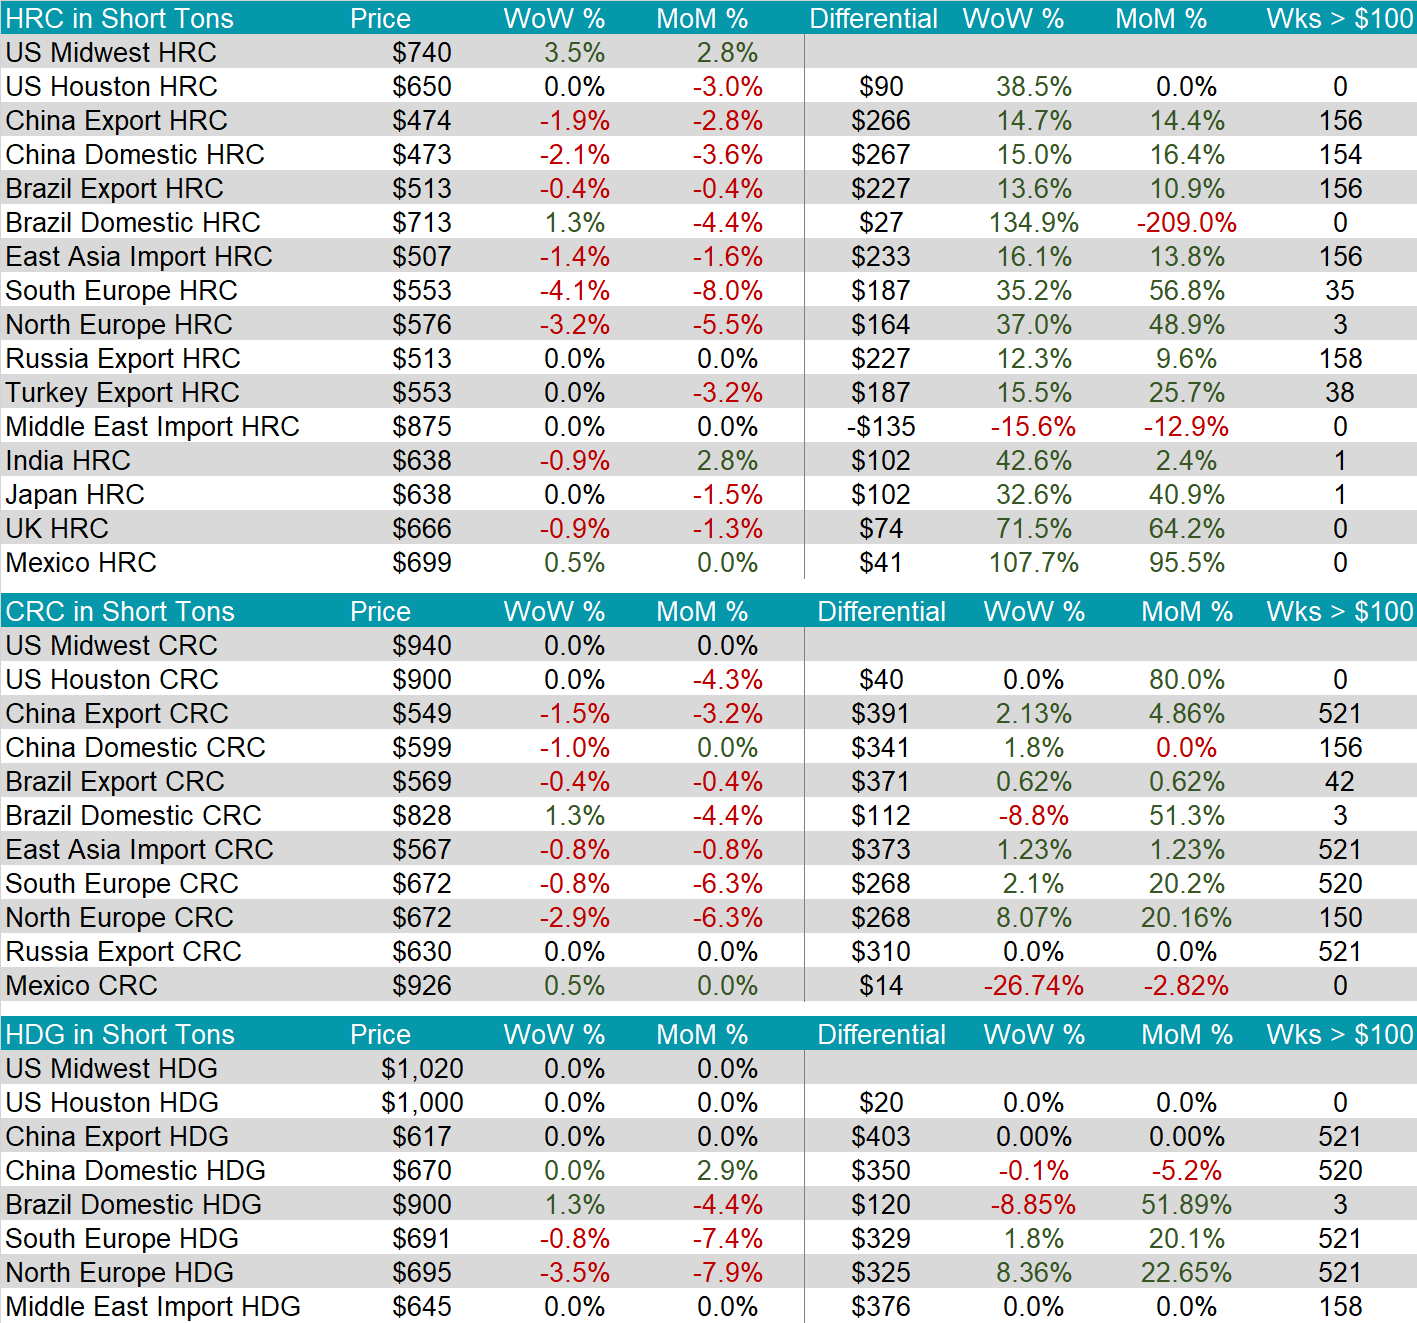
The HRC spot price continued its upward trend. This time increasing by $25 or 3.5%, to $740. This marks the third week of higher prices.
The 2nd month future declined to $761, down $9 or -1.2%. This is the second week in a row of a slightly lower forward curve, as the market waits to see the full follow through from the physical market. Uncertainty also remains around the resolution of the UAW/Big 3 strike.
Tandem products were unchanged again this week. Causing the HDG – HRC differential to decrease by $25 or -11.6% to $190.
Mill production moved sharply lower this week, with capacity utilization decreasing by -1.0% to 74.7%. This move breaks it out of the recent range where it has been dancing since June.
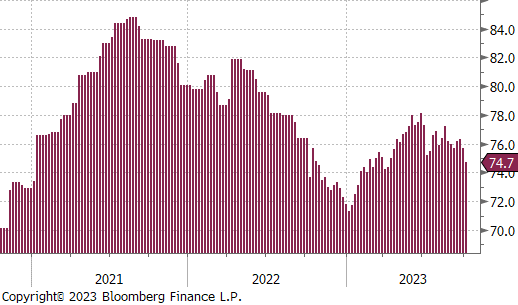
October Projection – Sheet 809k (down 99k MoM); Tube 425k (up 176k MoM)
September Projection – Sheet 765k (up 60k MoM); Tube 426k (down 70k MoM)
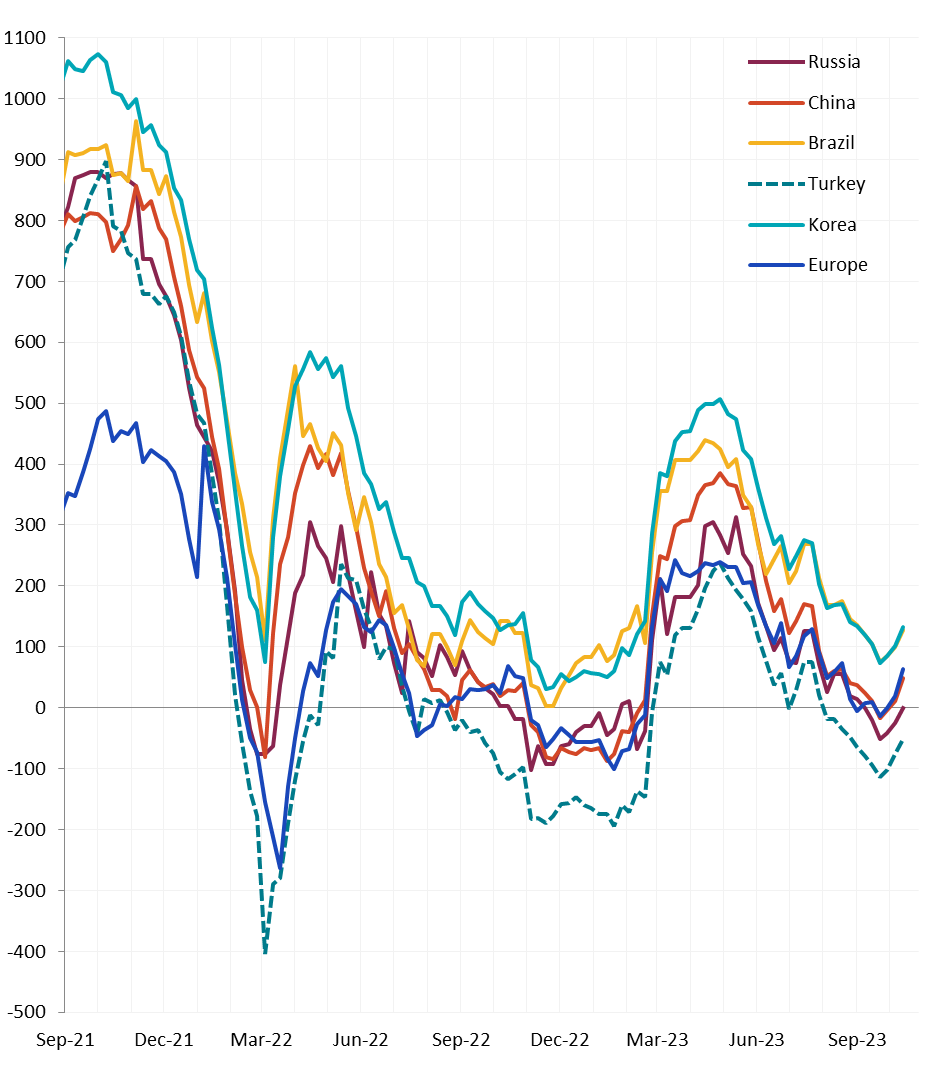
All the watched global differentials continued to increase. The US domestic HRC price saw the highest percentage increase, while the South Europe HRC saw the highest percentage decrease.
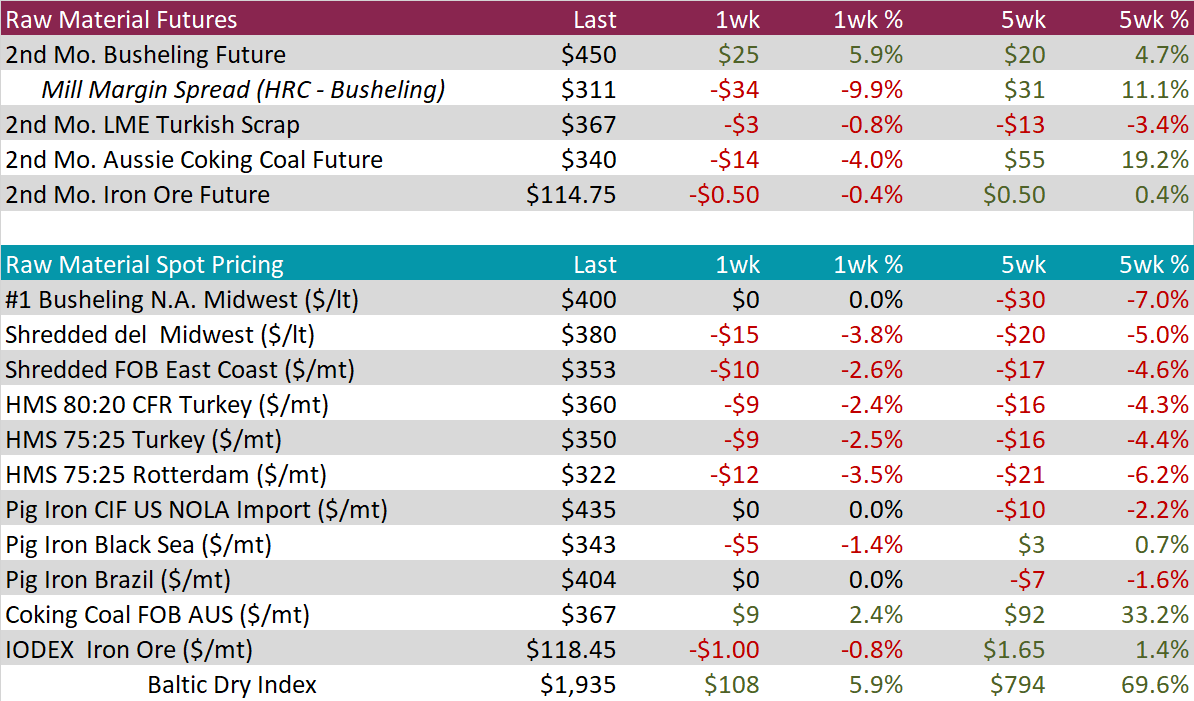
Scrap
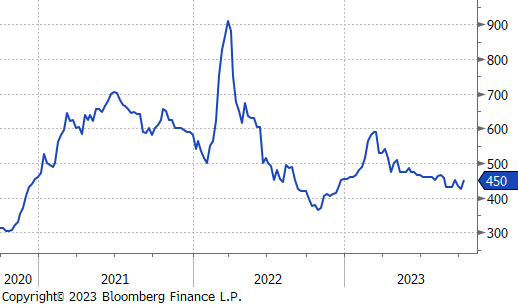
The 2nd month busheling future increased by $25 or 5.9% to $450. This movement bounced the price back to the level seen right before the recent decreases.
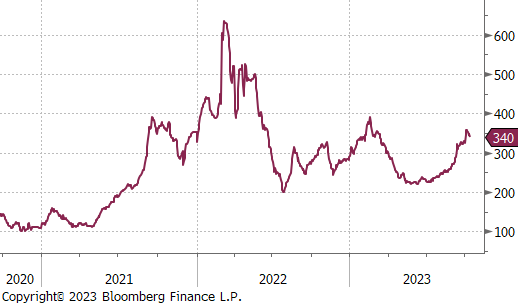
The 2nd month coking coal future decreased by $14 or -4.0% to $340. This is the first big movement that seemingly breaks away from its upward trend that it has been on since July.
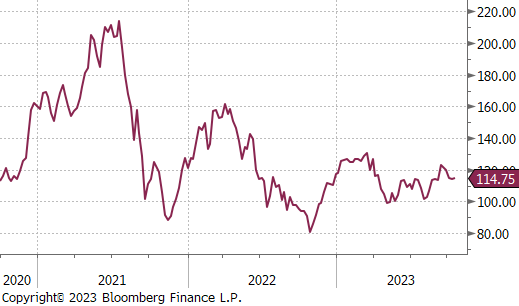
The 2nd month iron ore future declined again, although not as substantial as seen in previous weeks. It decreased by $0.50 or -0.4% to $114.75.
Dry Bulk / Freight
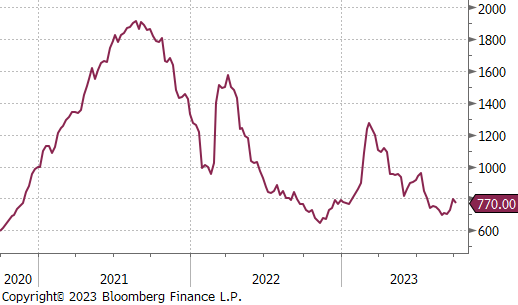
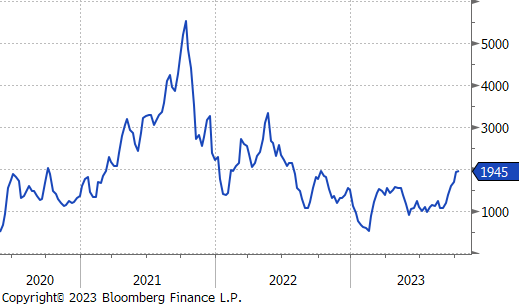
The Baltic Dry Index continued its upward trend, this time increasing by $108 or 5.9% to $1,935. We are now approaching levels not seen since July 2022.
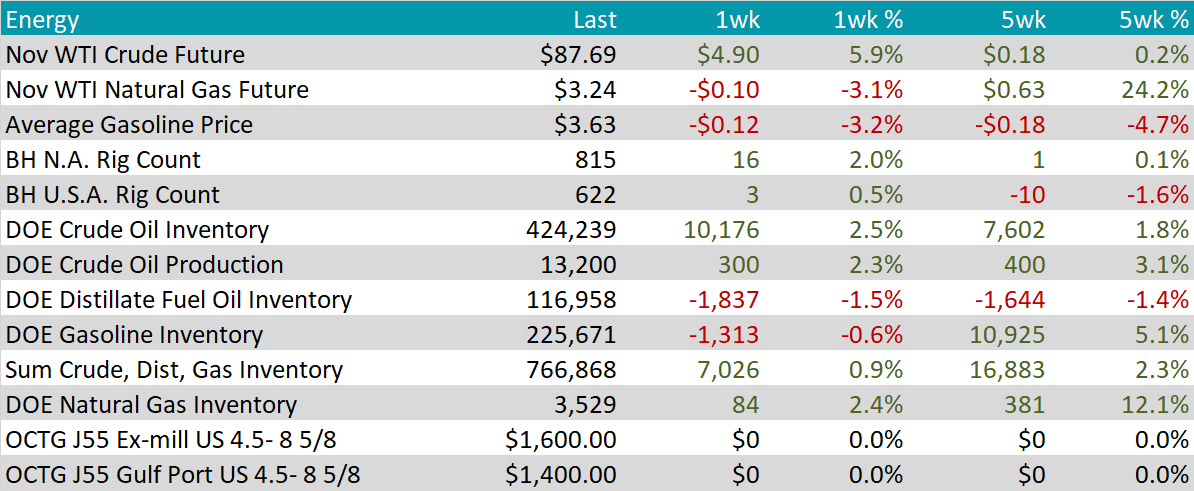
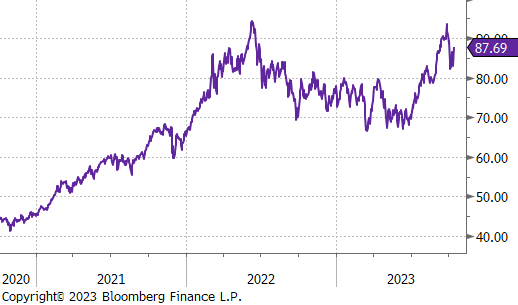
WTI crude oil future gained $4.90 or 5.9% to $87.69/bbl.
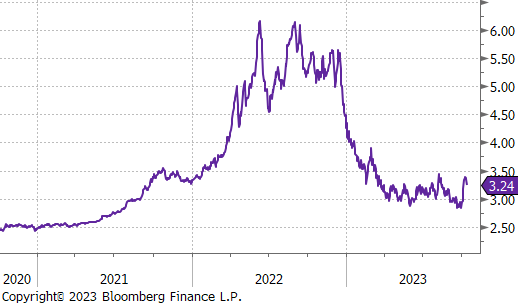
WTI natural gas future lost $0.10 or -3.1% to $3.24/bbl.
The aggregate inventory level was up 0.9%.
The Baker Hughes North American rig count was up by 16 rigs, and the US count was up by 3 rigs. This is the first increase in rigs for both after three weeks of reductions.
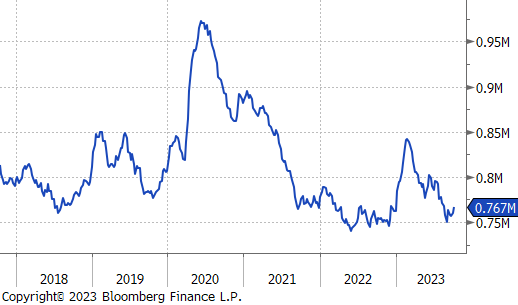
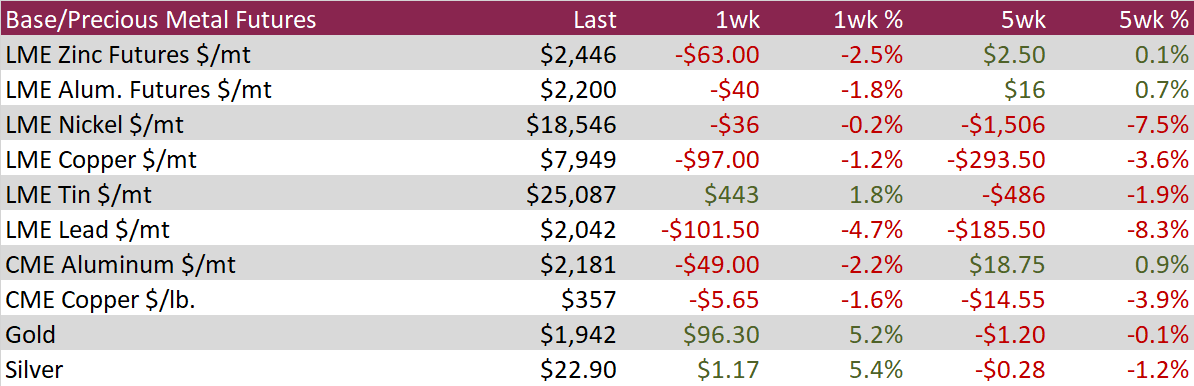
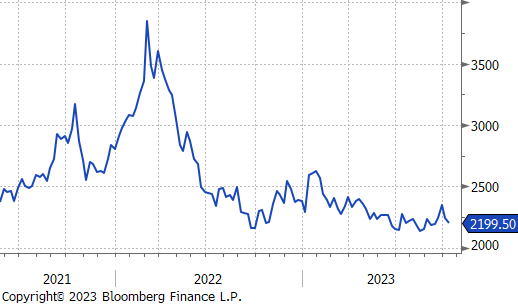
Aluminum futures experienced a second consecutive weekly decline, attributed to a widespread downturn in the construction and industrial sectors, putting pressure on demand amid increasing supply. The extent of losses was mitigated by a shift in the Federal Reserve’s rhetoric towards a less hawkish stance and supportive measure taken by China to strengthen its economy.
Copper futures fell along with other base metals for the second consecutive week as material continues to be stockpiled in LME-tracked warehouses. Visible stocks in the LME-tracked warehouses have expanded for 13 straight weeks and now sits at the highest level in two years. Nearby spreads on the forward curve are in steep contango, reflecting the well-supplied physical market.
Silver futures rebounded over 5% for the week, reversing weeks of losses influenced by a robust dollar and hawkish remarks from the Fed. The shift to less hawkish language and a weakening US dollar contributed to the upswing in precious metals prices. However, it’s noteworthy that hedge funds are intensifying their short positions, reaching the highest level in seven weeks.
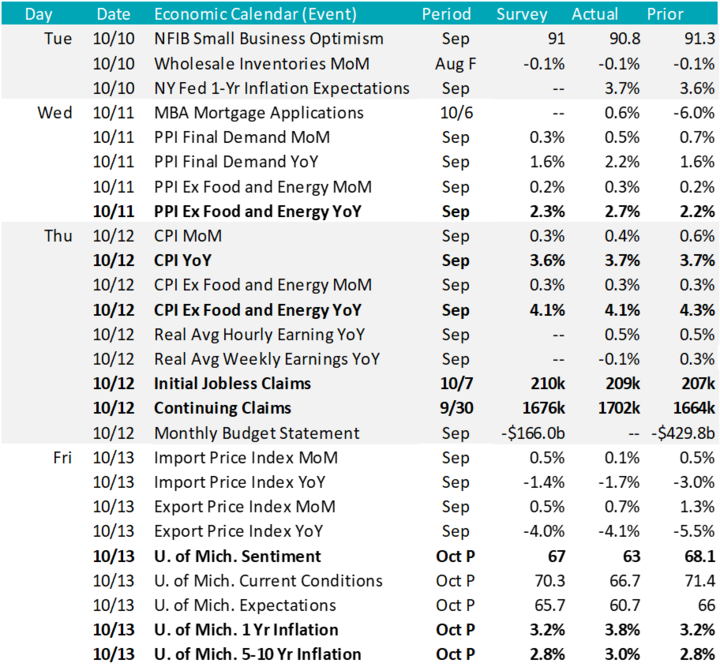
The overall takeaway from this week’s data is that inflationary pressures continue to slowly ease up, while the labor market remains stable.
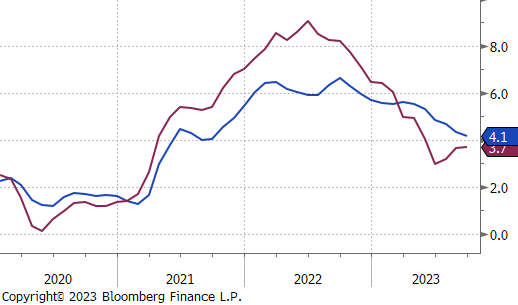
Core CPI (ex food & energy) matched market expectations by rising to 4.1% over the past year, a decrease from 4.3% the month prior. This is the lowest it has been since September 2021. The shelter subcomponent increased 7.2% over the last year, which accounts for over 70% of the total increase. Meanwhile, the used cars and trucks index decreased -8.0% year-over-year. Additionally, Core PPI (ex food & energy) YoY came in above expectations, increasing to 2.7% from 2.2% the month prior.
Meanwhile, continuing claims ticked up higher than market expectations, increasing to 1702k from 1664k. Initial jobless claims also ticked up, but came in below market expectations, at 209k from the previous week of 207k, this suggests that the labor market continues to be at tight levels and that the UAW strike has yet to have a major impact on the labor market. Overall, there seems to be no signal that the labor market is cooling to a degree that should cause any significant concern.
The U. of Mich. 5–10-year inflation rose to 3.0%, up from a one-year low of 2.8% in the previous month. This movement stays within the range of 2.9-3.1% seen in 25 of the last 27 months but remains elevated relative to the 2.2-2.6% range seen in the two years pre-pandemic. The indication here is that consumers continue to be concerned over inflation. More than anything else, we believe the FED will have a bias to keep rates restrictive until it is clear that expectations for long-term inflation have subsided.
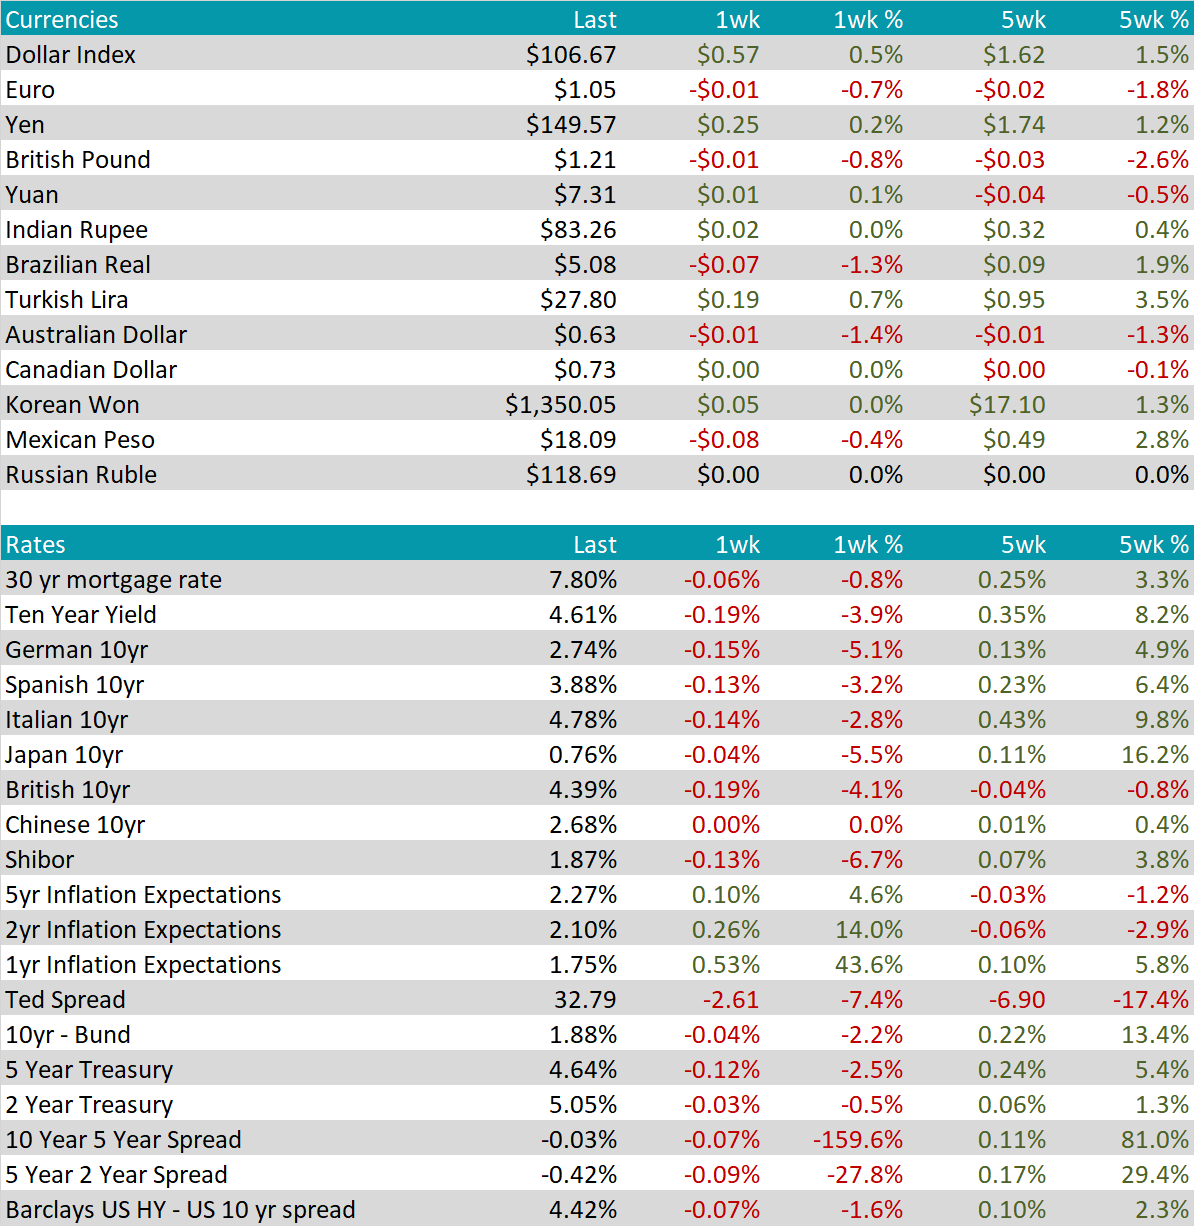
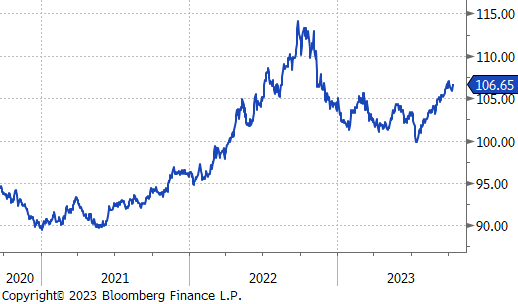
The Australian Dollar (AUD) faced a tough week, falling by 1.4% against the US Dollar (AUDUSD at $0.63). Geopolitical tensions in the Middle East due to the Israel-Hamas war spurred a rush to the safety of the US dollar and gold, keeping the Aussie close to one-year lows. Investors eagerly awaited the Reserve Bank of Australia’s October meeting minutes to decipher the reasons behind keeping rates steady at 4.1% for the fourth consecutive month. Additionally, the Chinese GDP data release will be a significant influence, as the Australian economy is closely linked to the Chinese recovery.
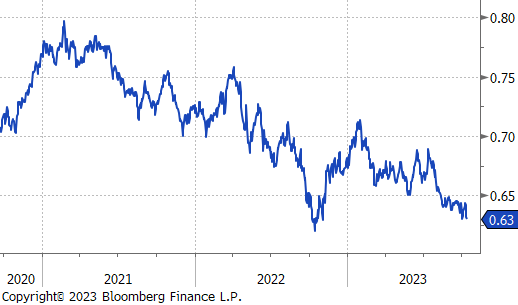
The British Pound (GBP) struggled, dropping to $1.21 against the US Dollar as investors continued to favor the greenback, driven by stronger-than-expected US inflation data. The UK’s latest GDP report revealed sluggish growth of just 0.2% in August, aligning with market expectations. Unfortunately, the manufacturing sector in the UK continued to decline. Looking ahead, the Bank of England is set to meet in November, with expectations of maintaining the base rate at 5.25%.
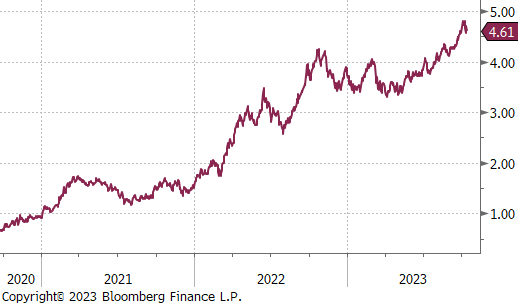
The U.S. 10-Year Treasury Yield fell to 4.61% over the week, with traders closely monitoring the impact of the Israel-Hamas conflict on monetary policy. Many Federal Reserve officials are scheduled to speak publicly this week. However, market sentiment shifted, with just a 7% probability of a rate hike at the upcoming FOMC meeting on November 1st, significantly down from the 44% probability a few weeks ago.