Flack Capital Markets | Ferrous Financial Insider
October 18, 2024 – Issue #454
October 18, 2024 – Issue #454
Overview:

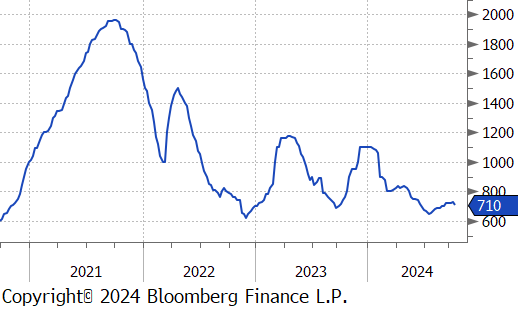
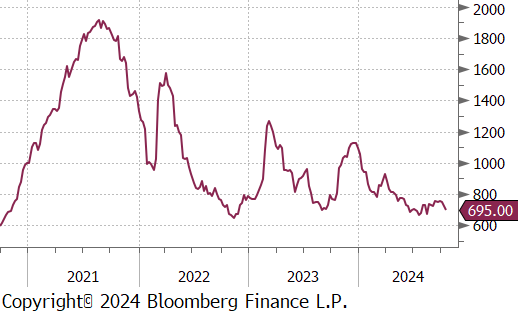
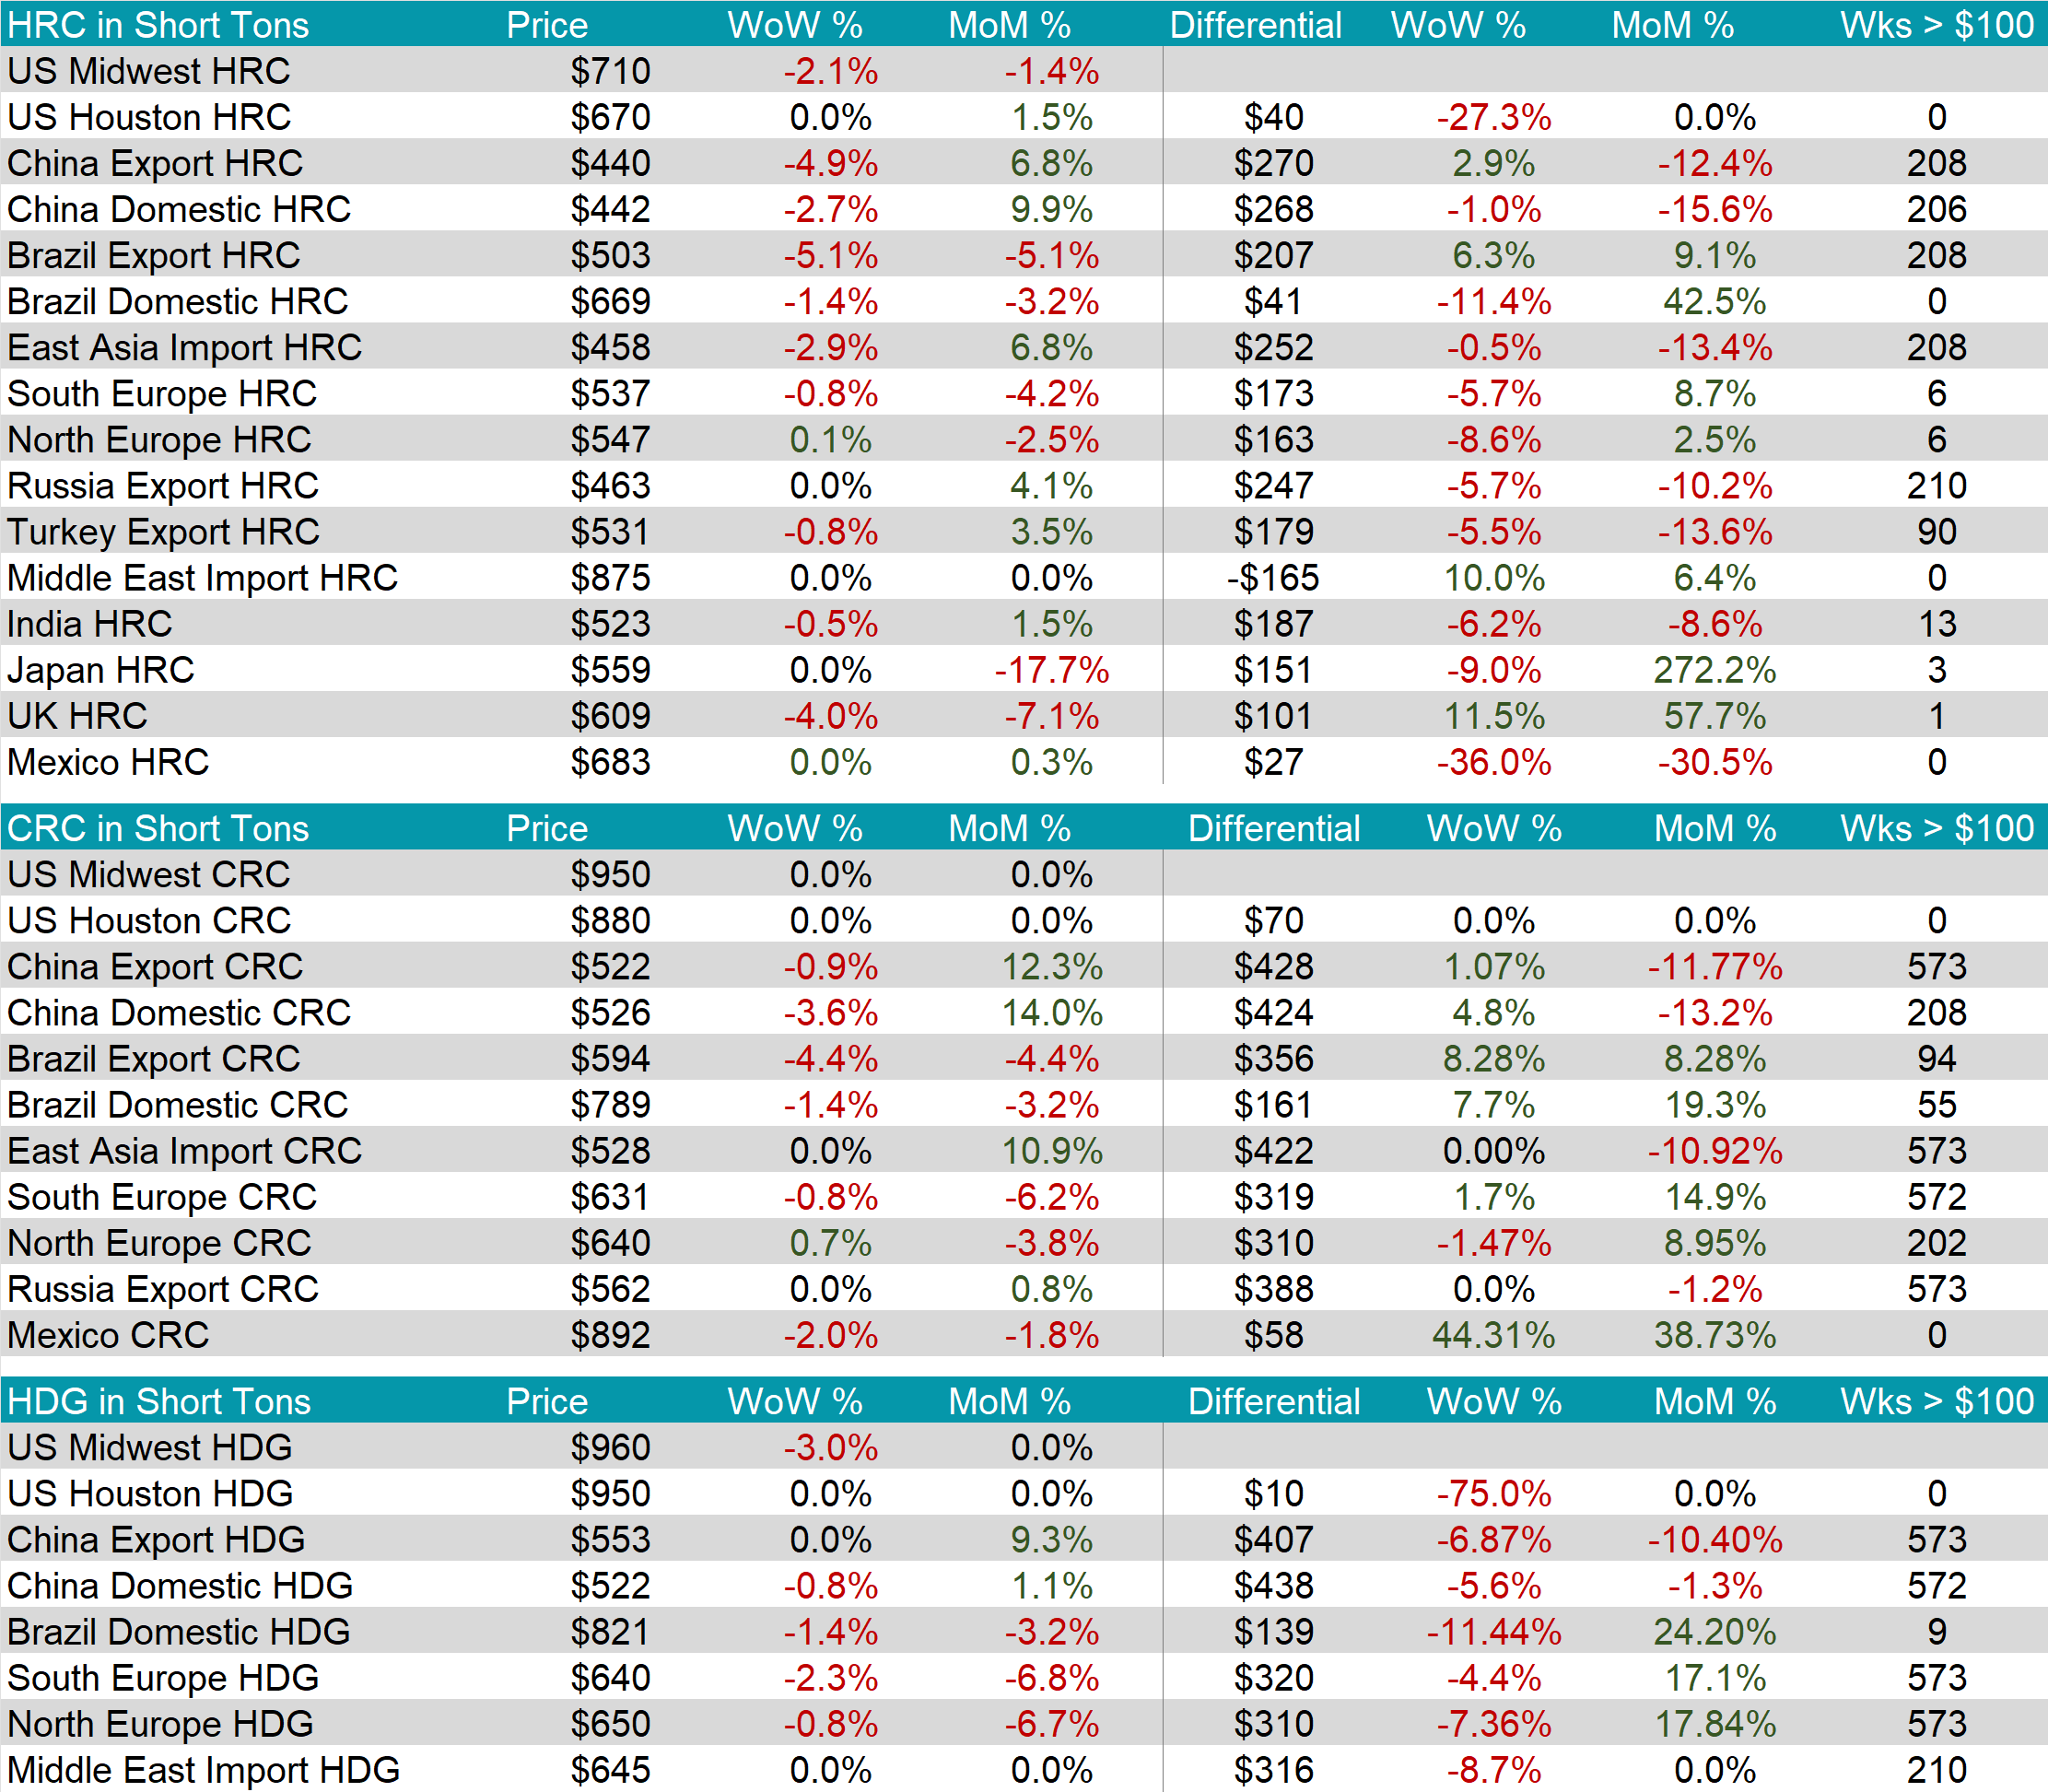
The HRC spot price declined by $15 or -2.1% to $710, decreasing for the first time since July. At the same time, the HRC 2nd month future fell by $23 or -3.2% to $702, reaching the lowest price since August.
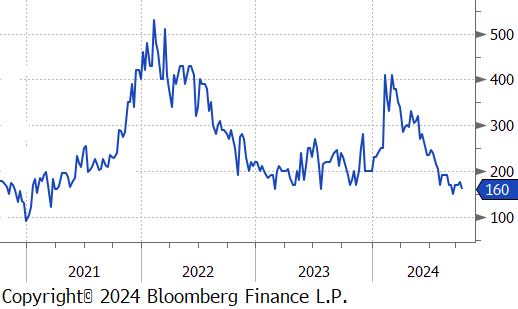
Tandem products were mixed, with CRC holding steady while HDG dropped by $30, resulting in the HDG – HRC differential to decline by $15 or -8.6% to $160.
Mill production remains low despite capacity utilization ticking up by 0.6% to 72.9%, bringing raw steel production up to 1.620m net tons.


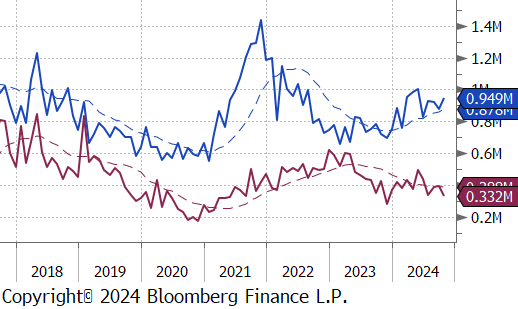
October Projection – Sheet 949k (up 74k MoM); Tube 332k (down 62k MoM)
September Projection – Sheet 875k (down 44k MoM); Tube 394k (up 6k MoM)

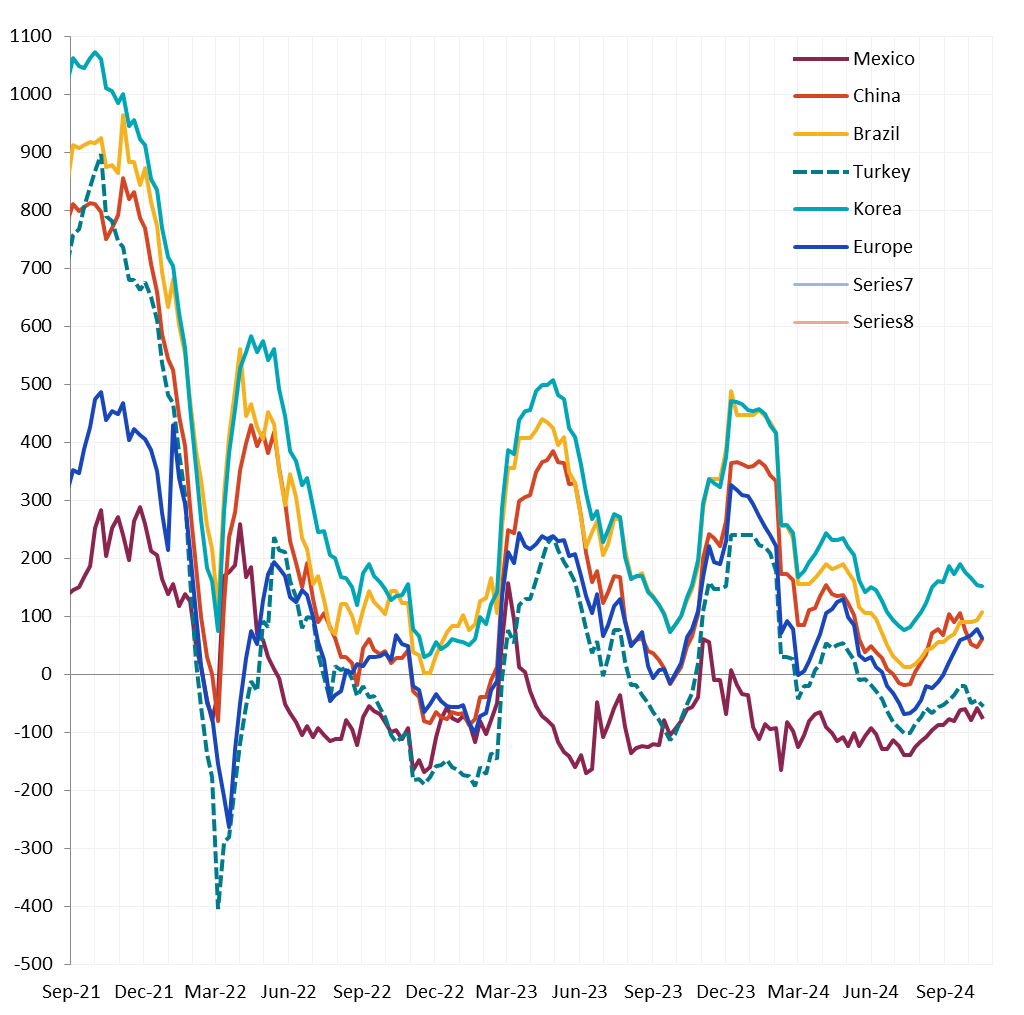
Watched global differentials were mixed this week, with China Export HRC dropping by -4.9%, Brazil Export HRC down by -5.1%, Turkey Export HRC falling by -0.8%, and N Europe HRC rising by 0.1%.
Scrap
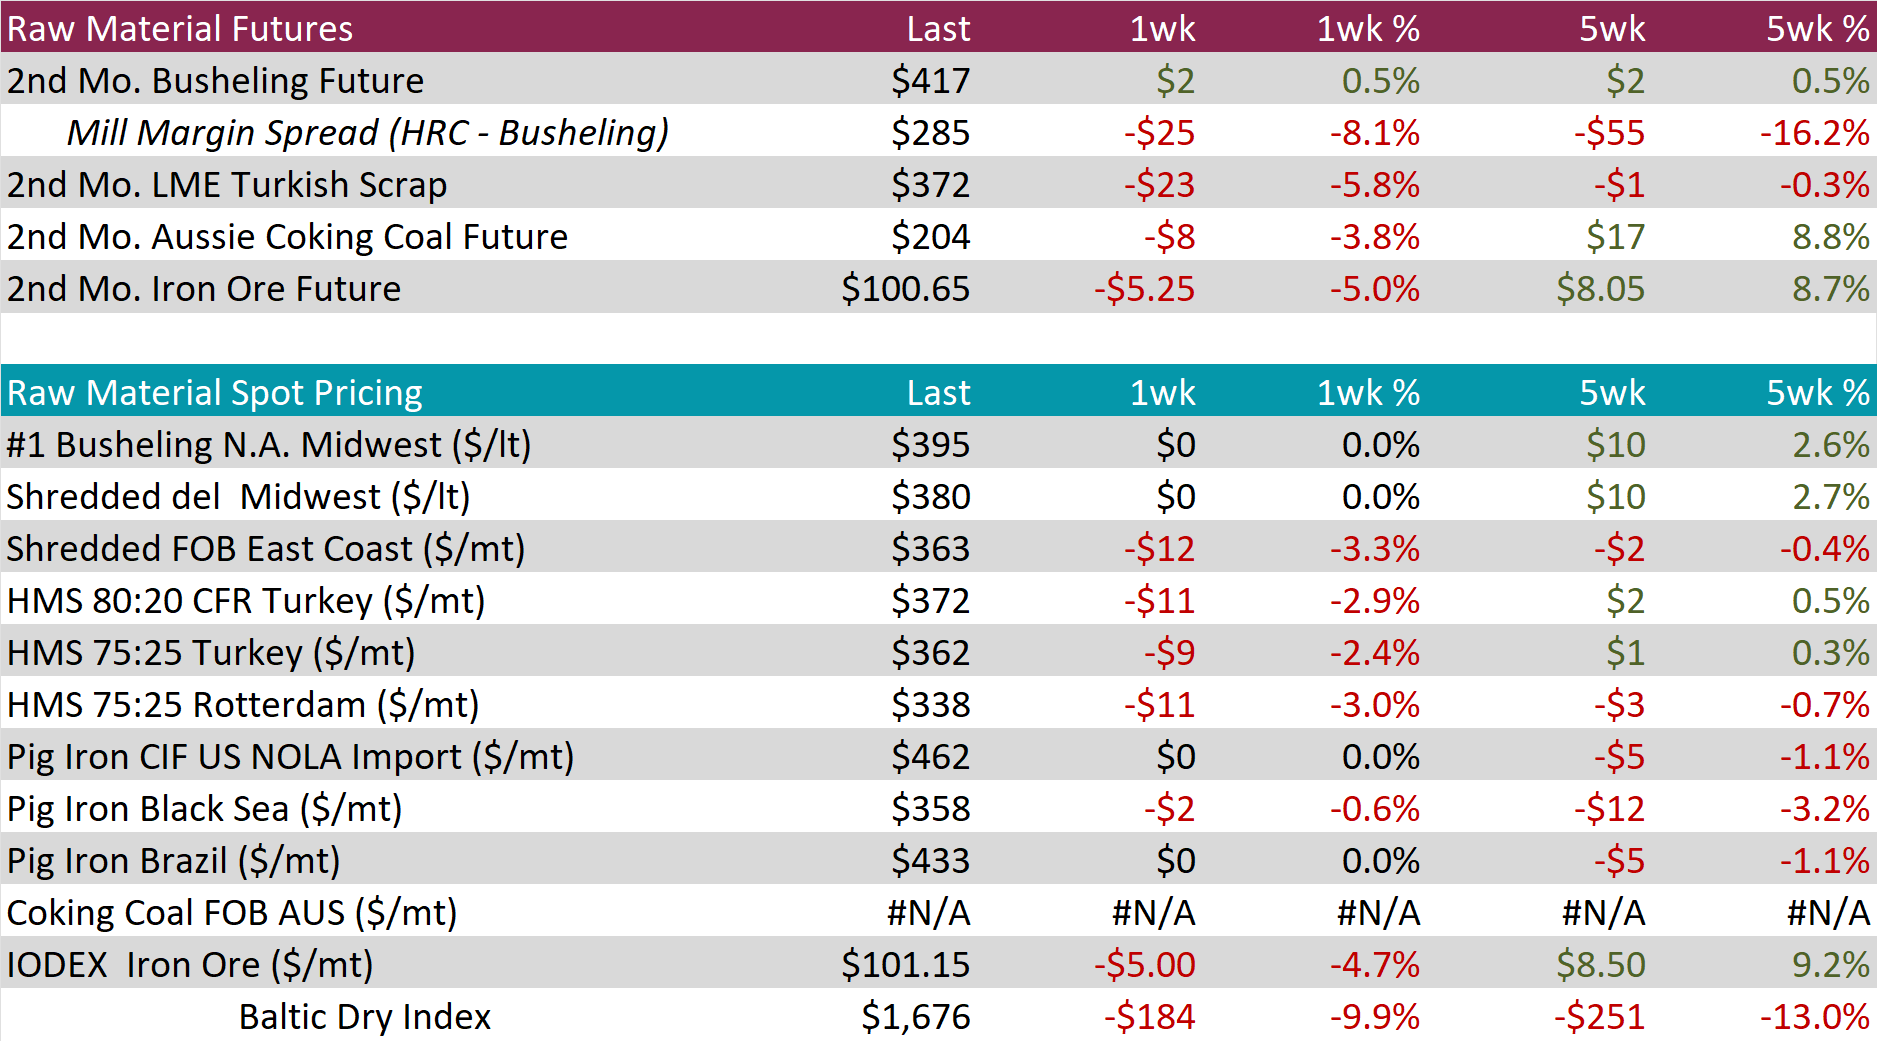
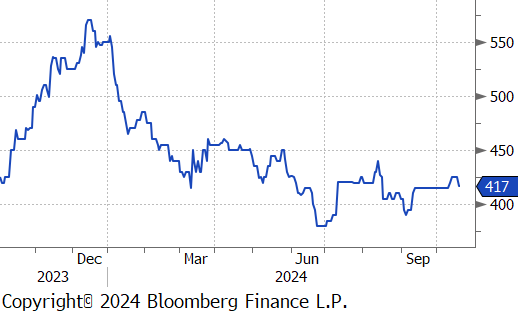
The busheling 2nd month future rose by $2 or 0.5% to $417.
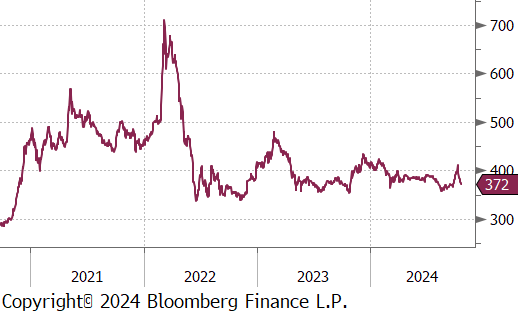
The LME Turkish scrap 2nd month future dropped by $23 or -5.8% to $372, sharply reversing from its recent high touched last week.
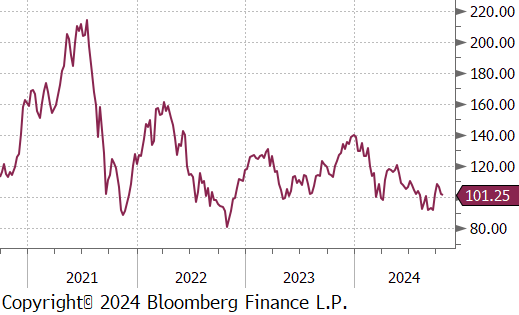
The iron ore 2nd month future slipped by $5.25 or -5.0% to $100.65, marking the second consecutive week of declines.
Dry Bulk / Freight
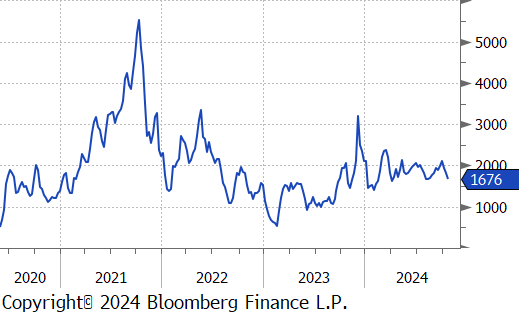
The Baltic Dry Index declined by $184 or -9.9% to $1,676, hitting the lowest price since early August.
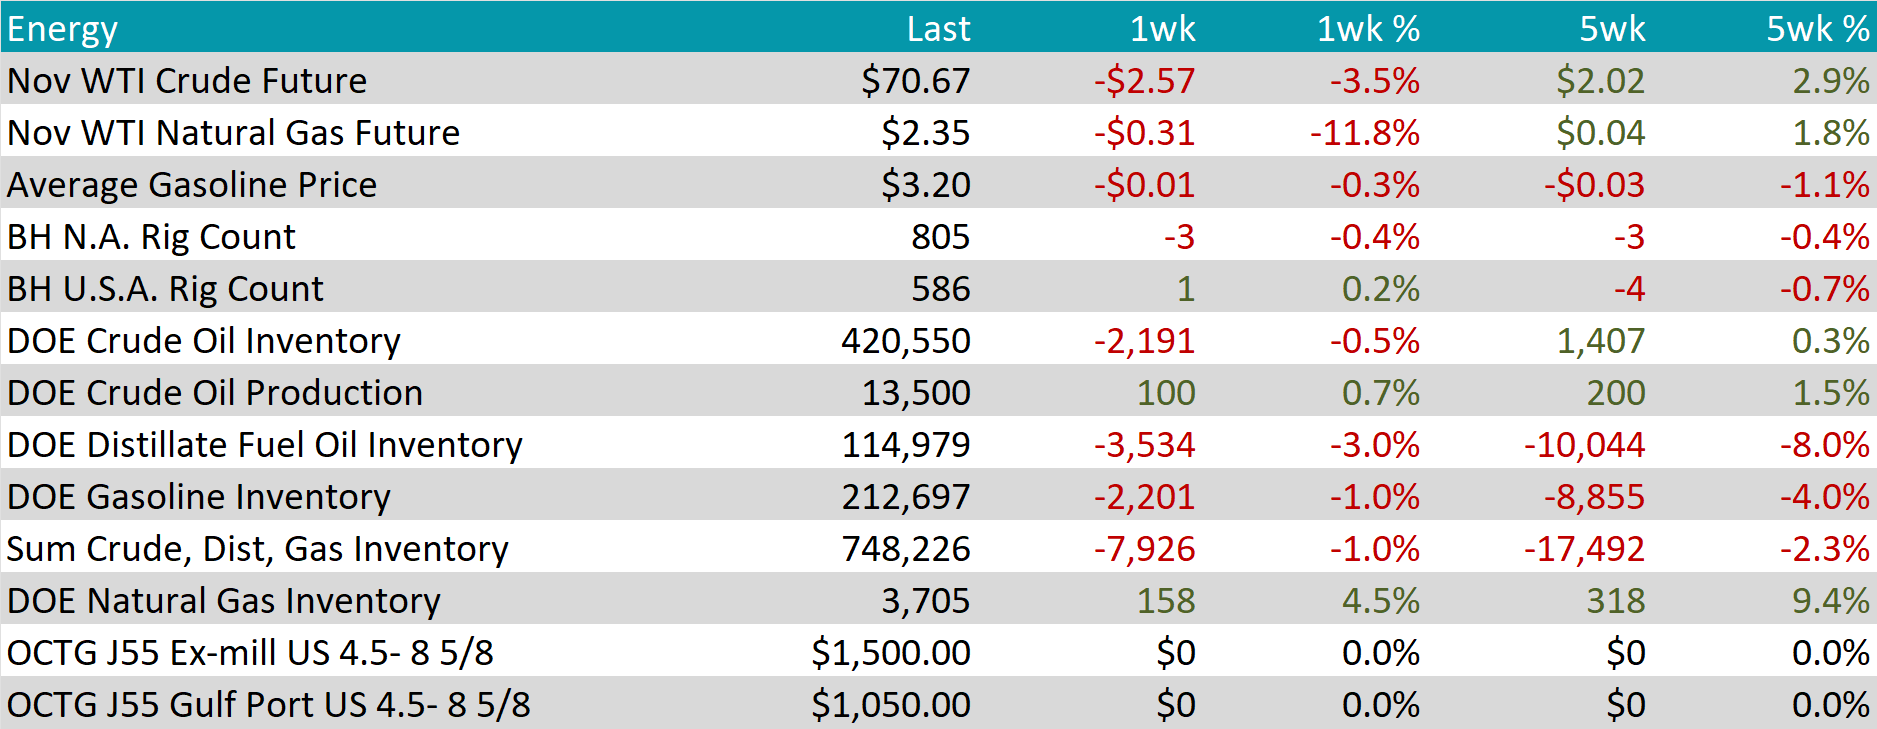
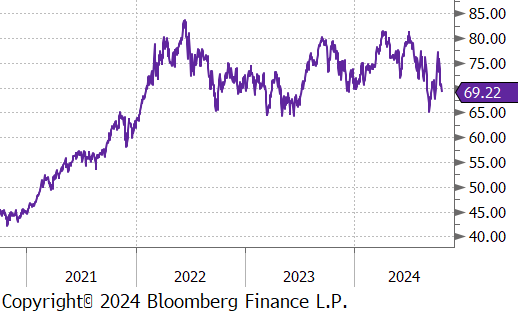
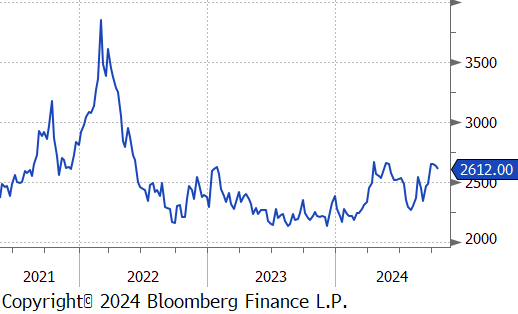
WTI crude oil future lost $2.57 or -3.5% to $70.67/bbl.
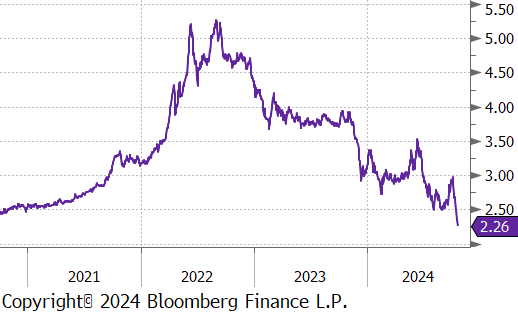
WTI natural gas future lost $0.31 or -11.8 to $2.35/bbl.
The aggregate inventory level continued to decline, this week decreasing by -1.0%.
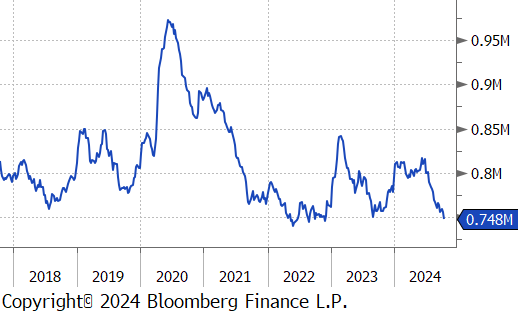
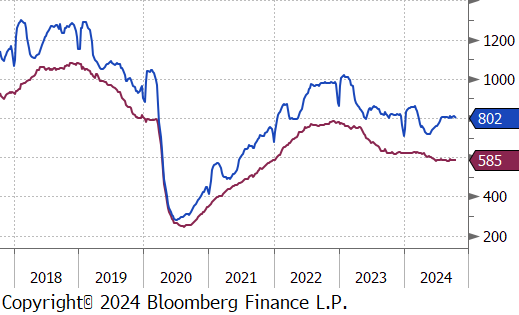
The Baker Hughes North American rig count reduced by 3 rigs, bringing the total count to 805 rigs. At the same time, the US rig count added 1 rig, bringing the total count to 586 rigs.
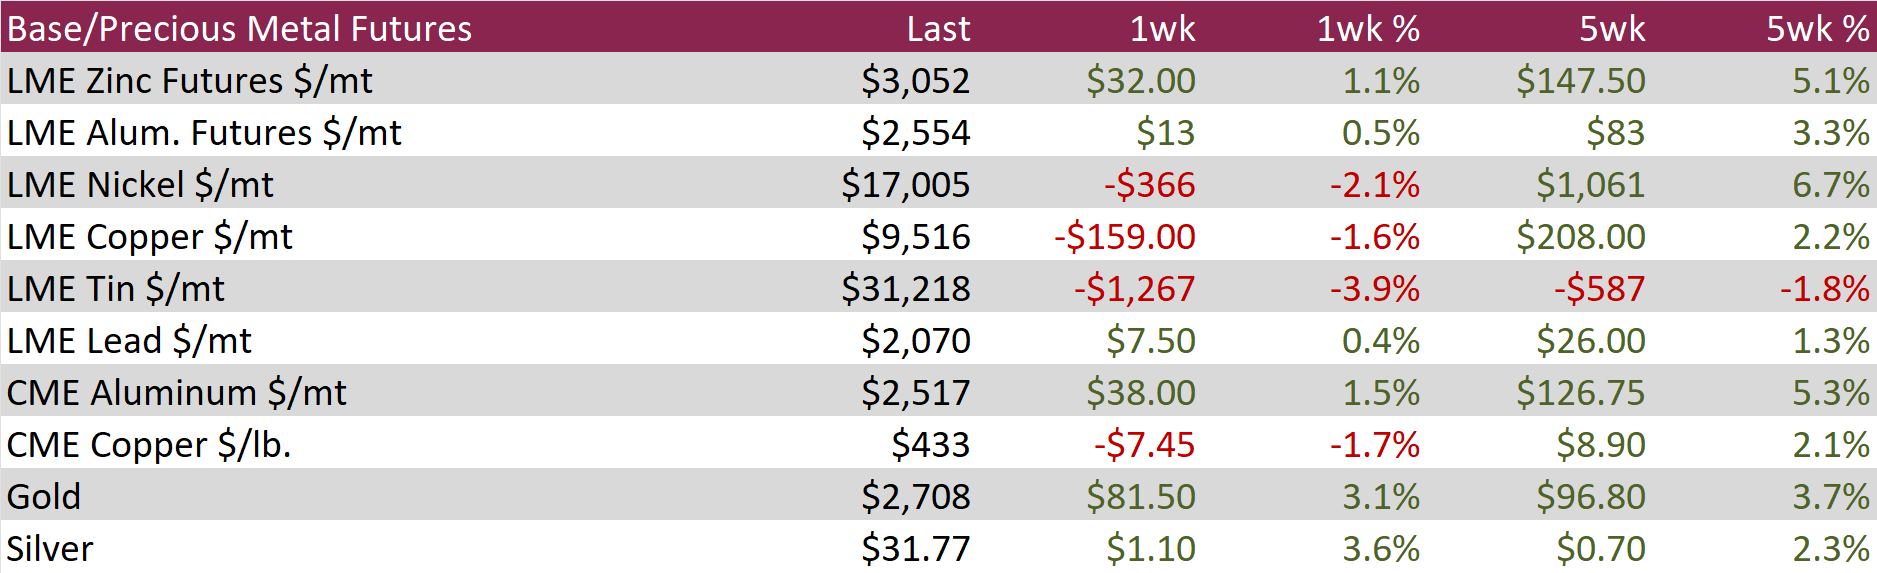
Aluminum futures rose by $13 or 0.5% to $2,554, as expectations of strong demand outweighed concerns over ample supply in China. The metal’s widespread industrial applications, particularly in electric vehicles, solar panels, and other electrification sectors, helped prevent steep declines, despite concerns over slowing factory output in China, the world’s top aluminum consumer. Supporting this demand, aluminum stocks in Chinese ports have fallen by 20% since their peak in March, now down to 656k imperial tons. Additionally, prices have been bolstered by risks to bauxite supply, a critical raw material for aluminum production. Emirates Global Aluminum, a key supplier of bauxite to China, was forced to halt exports from Guinea after customs authorities blocked shipments, raising input costs for smelters and further supporting prices.
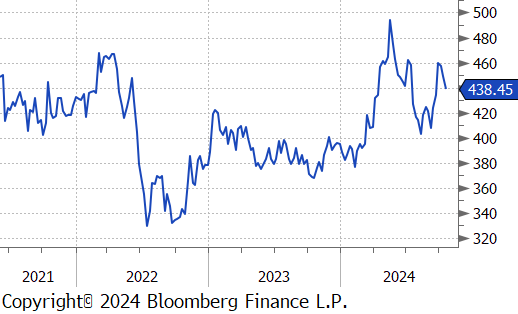
Copper futures fell by $7.45 or -1.7% to $433, as China’s central bank cut benchmark lending rates to record lows, improving the economic outlook for the world’s top copper consumer. The People’s Bank of China (PBOC) reduced the one-year loan prime rate by 25 basis points to 3.1% and the five-year rate to 3.6%. On Friday, the PBOC also took steps to support China’s equity market and hinted at further cuts to banks’ reserve requirements by year-end. Additionally, recent Chinese economic data exceeded expectations, further fueling optimism. Meanwhile, rising demand for copper, driven by the global shift toward cleaner energy, has heightened concerns of a supply shortfall as mining companies struggle to ramp up production.
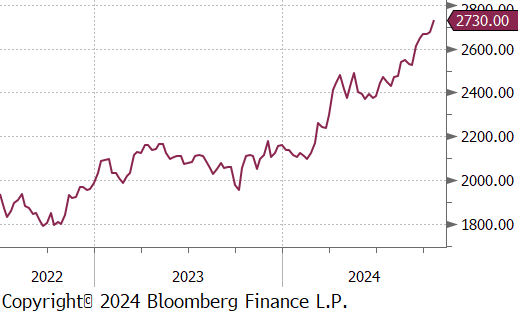
Gold soared by $81.50 or 3.1% to $2,708, hitting new record highs as demand for safe-haven assets intensified. Investors are monitoring escalating tensions in the Middle East, with Hezbollah announcing an escalation in its conflict with Israel, and reports of Israeli strikes on Beirut’s southern suburbs and other targets over the weekend. Uncertainty surrounding the upcoming US presidential elections is also boosting the appeal of safe-haven assets like gold. Additionally, expectations of looser monetary policies from major central banks are supporting prices. The PBoC lowered key rates as part of broader stimulus efforts, while the European Central Bank (ECB) implemented its third rate cut this year. However, stronger-than-expected US economic data has tempered expectations for a more dovish Federal Reserve stance.
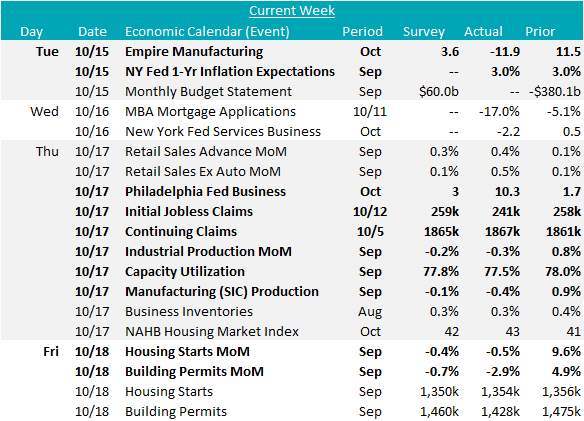
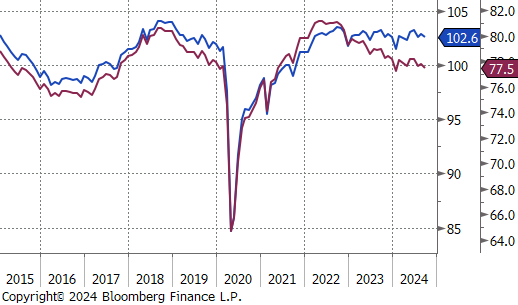
September’s Industrial Production was down -0.3%, a sharper decline than the market expected -0.1% and following a downwardly revised 0.3% increase in August. Capacity utilization was also lower, printing down 0.3% to 77.5%, below the estimate for a slight uptick to 77.9%. Manufacturing production declined -0.4%, coming in below the expected -0.1% decrease.
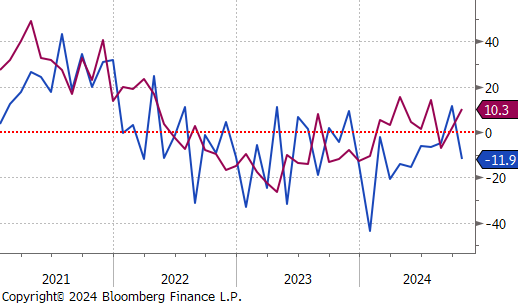
We also received the first round of October FED Manufacturing Surveys which provided vastly different pictures. Empire (NY) came in at -11.9, well below the expected 3.6, while Philadelphia printed up 10.3, well above expectations of a modest 3 increase.
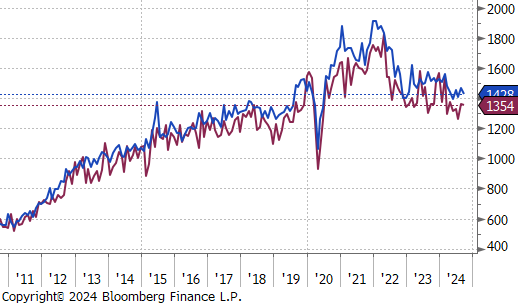
The first batch of September housing data printed lower, but mostly came in line with expectations (when accounting for the potential impact of Hurricane Helene). Housing starts printed down -0.5%, just below the expected -0.4%, while Building permits were down -2.9% versus the expected -0.7% move. On the permits side, the entire “miss” versus expectations can be explained by the -50k move in the South region.
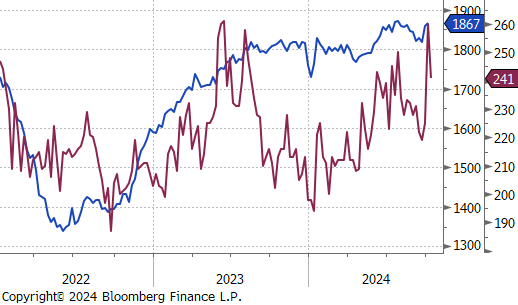
Interestingly, after last week’s worse than expected surge in initial jobless claims, this week’s figure came in well below expectations of another 259k claims, printing down to 241k. While this number could rise again next week, (the period surveyed encompasses the time between Hurricane’s Helene & Milton) it is an encouraging signal that the labor market is in fact more stable the last week’s surprise data initially suggested. Continuing jobless claims ticked higher to 1,867k from 1,861k.
Finally, on the inflation side, the NY FED 1yr Inflation Expectations index was unchanged at 3% in September. It has spent most of the year holding at this slightly elevated level and has failed to push well below 3% since November 2020.