Flack Capital Markets | Ferrous Financial Insider
October 25, 2024 – Issue #455
October 25, 2024 – Issue #455
Overview:
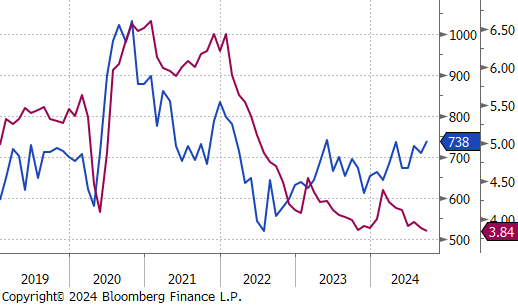
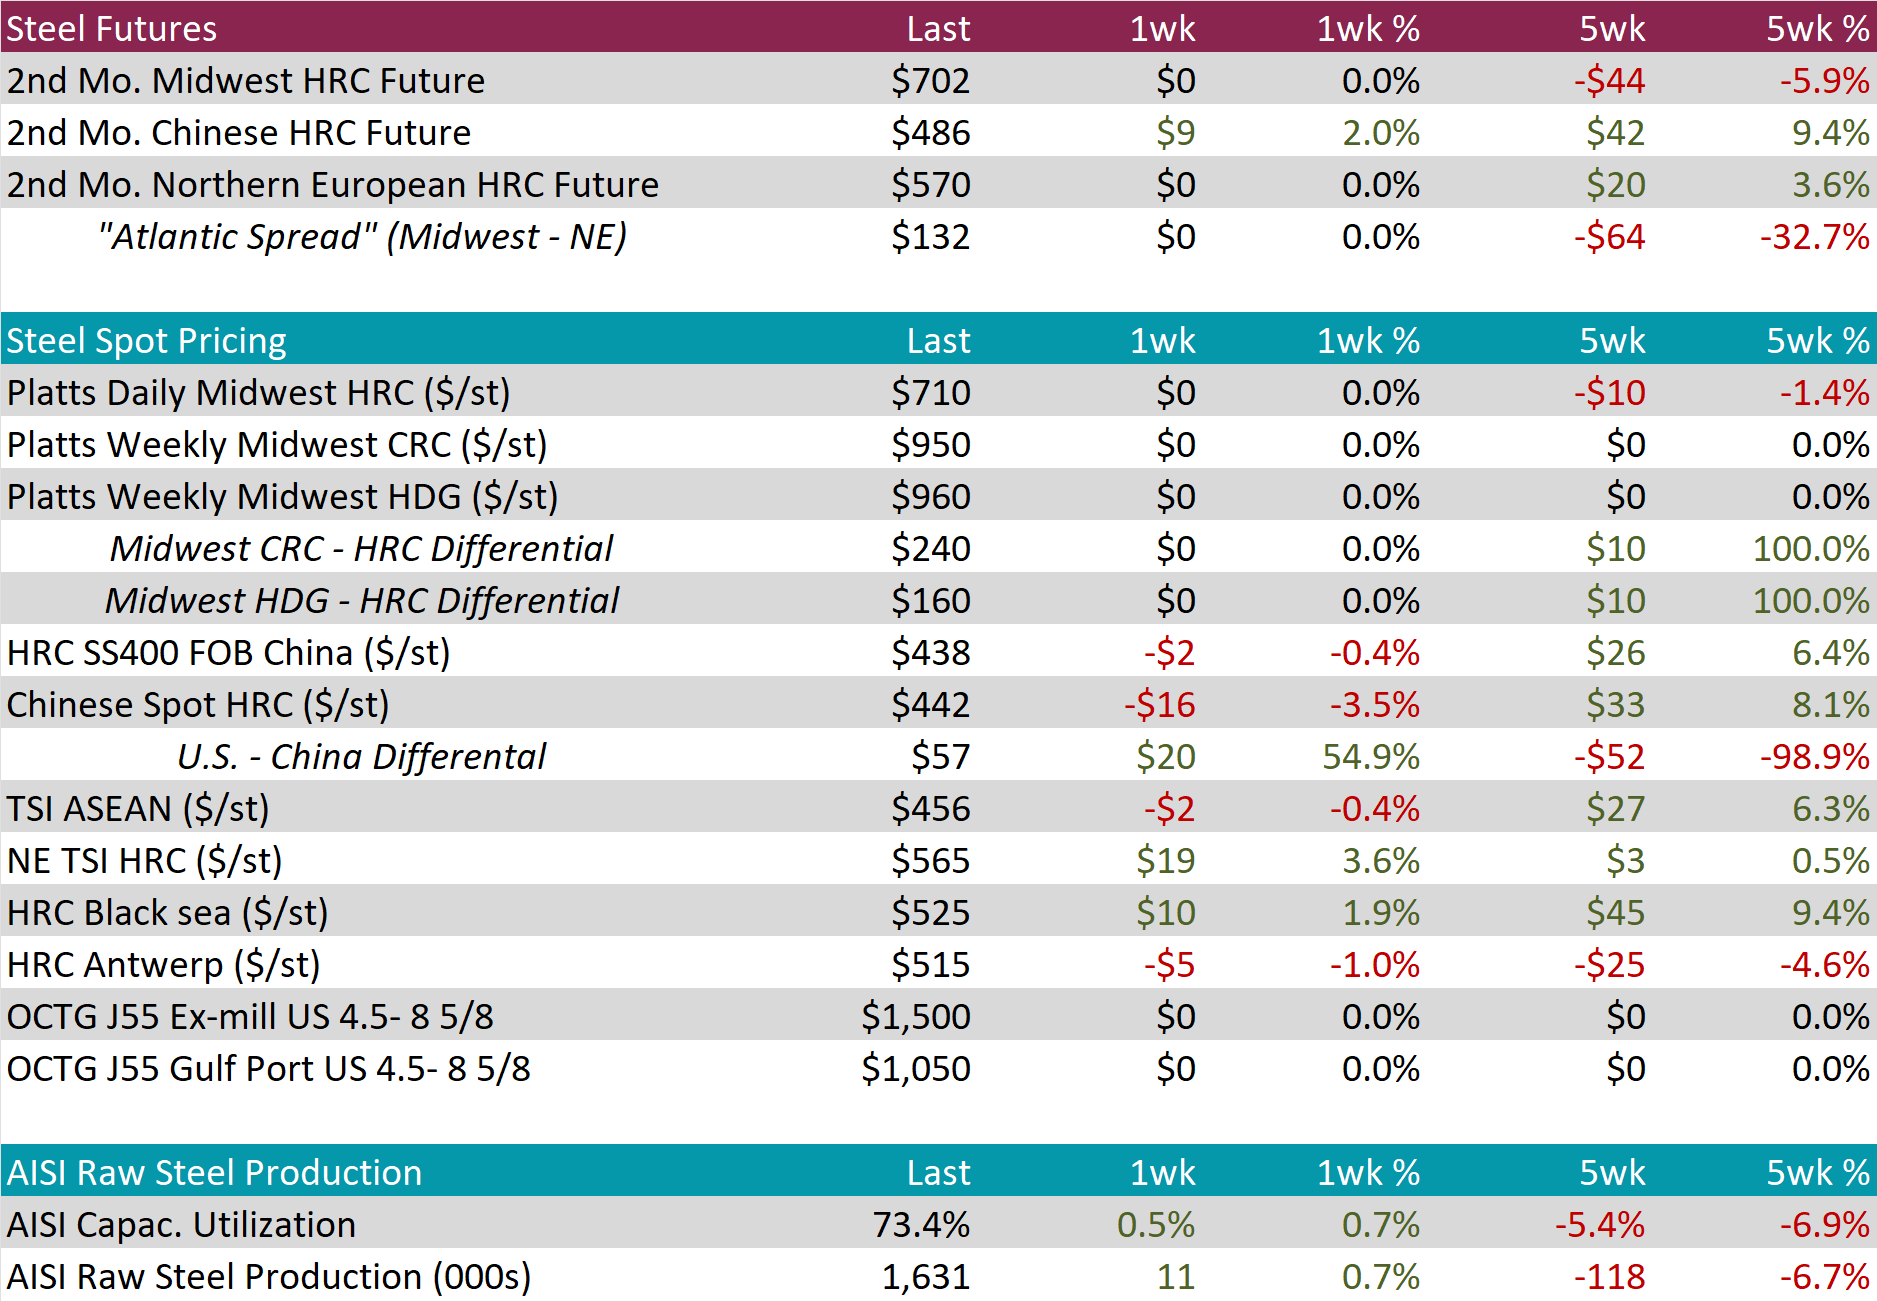
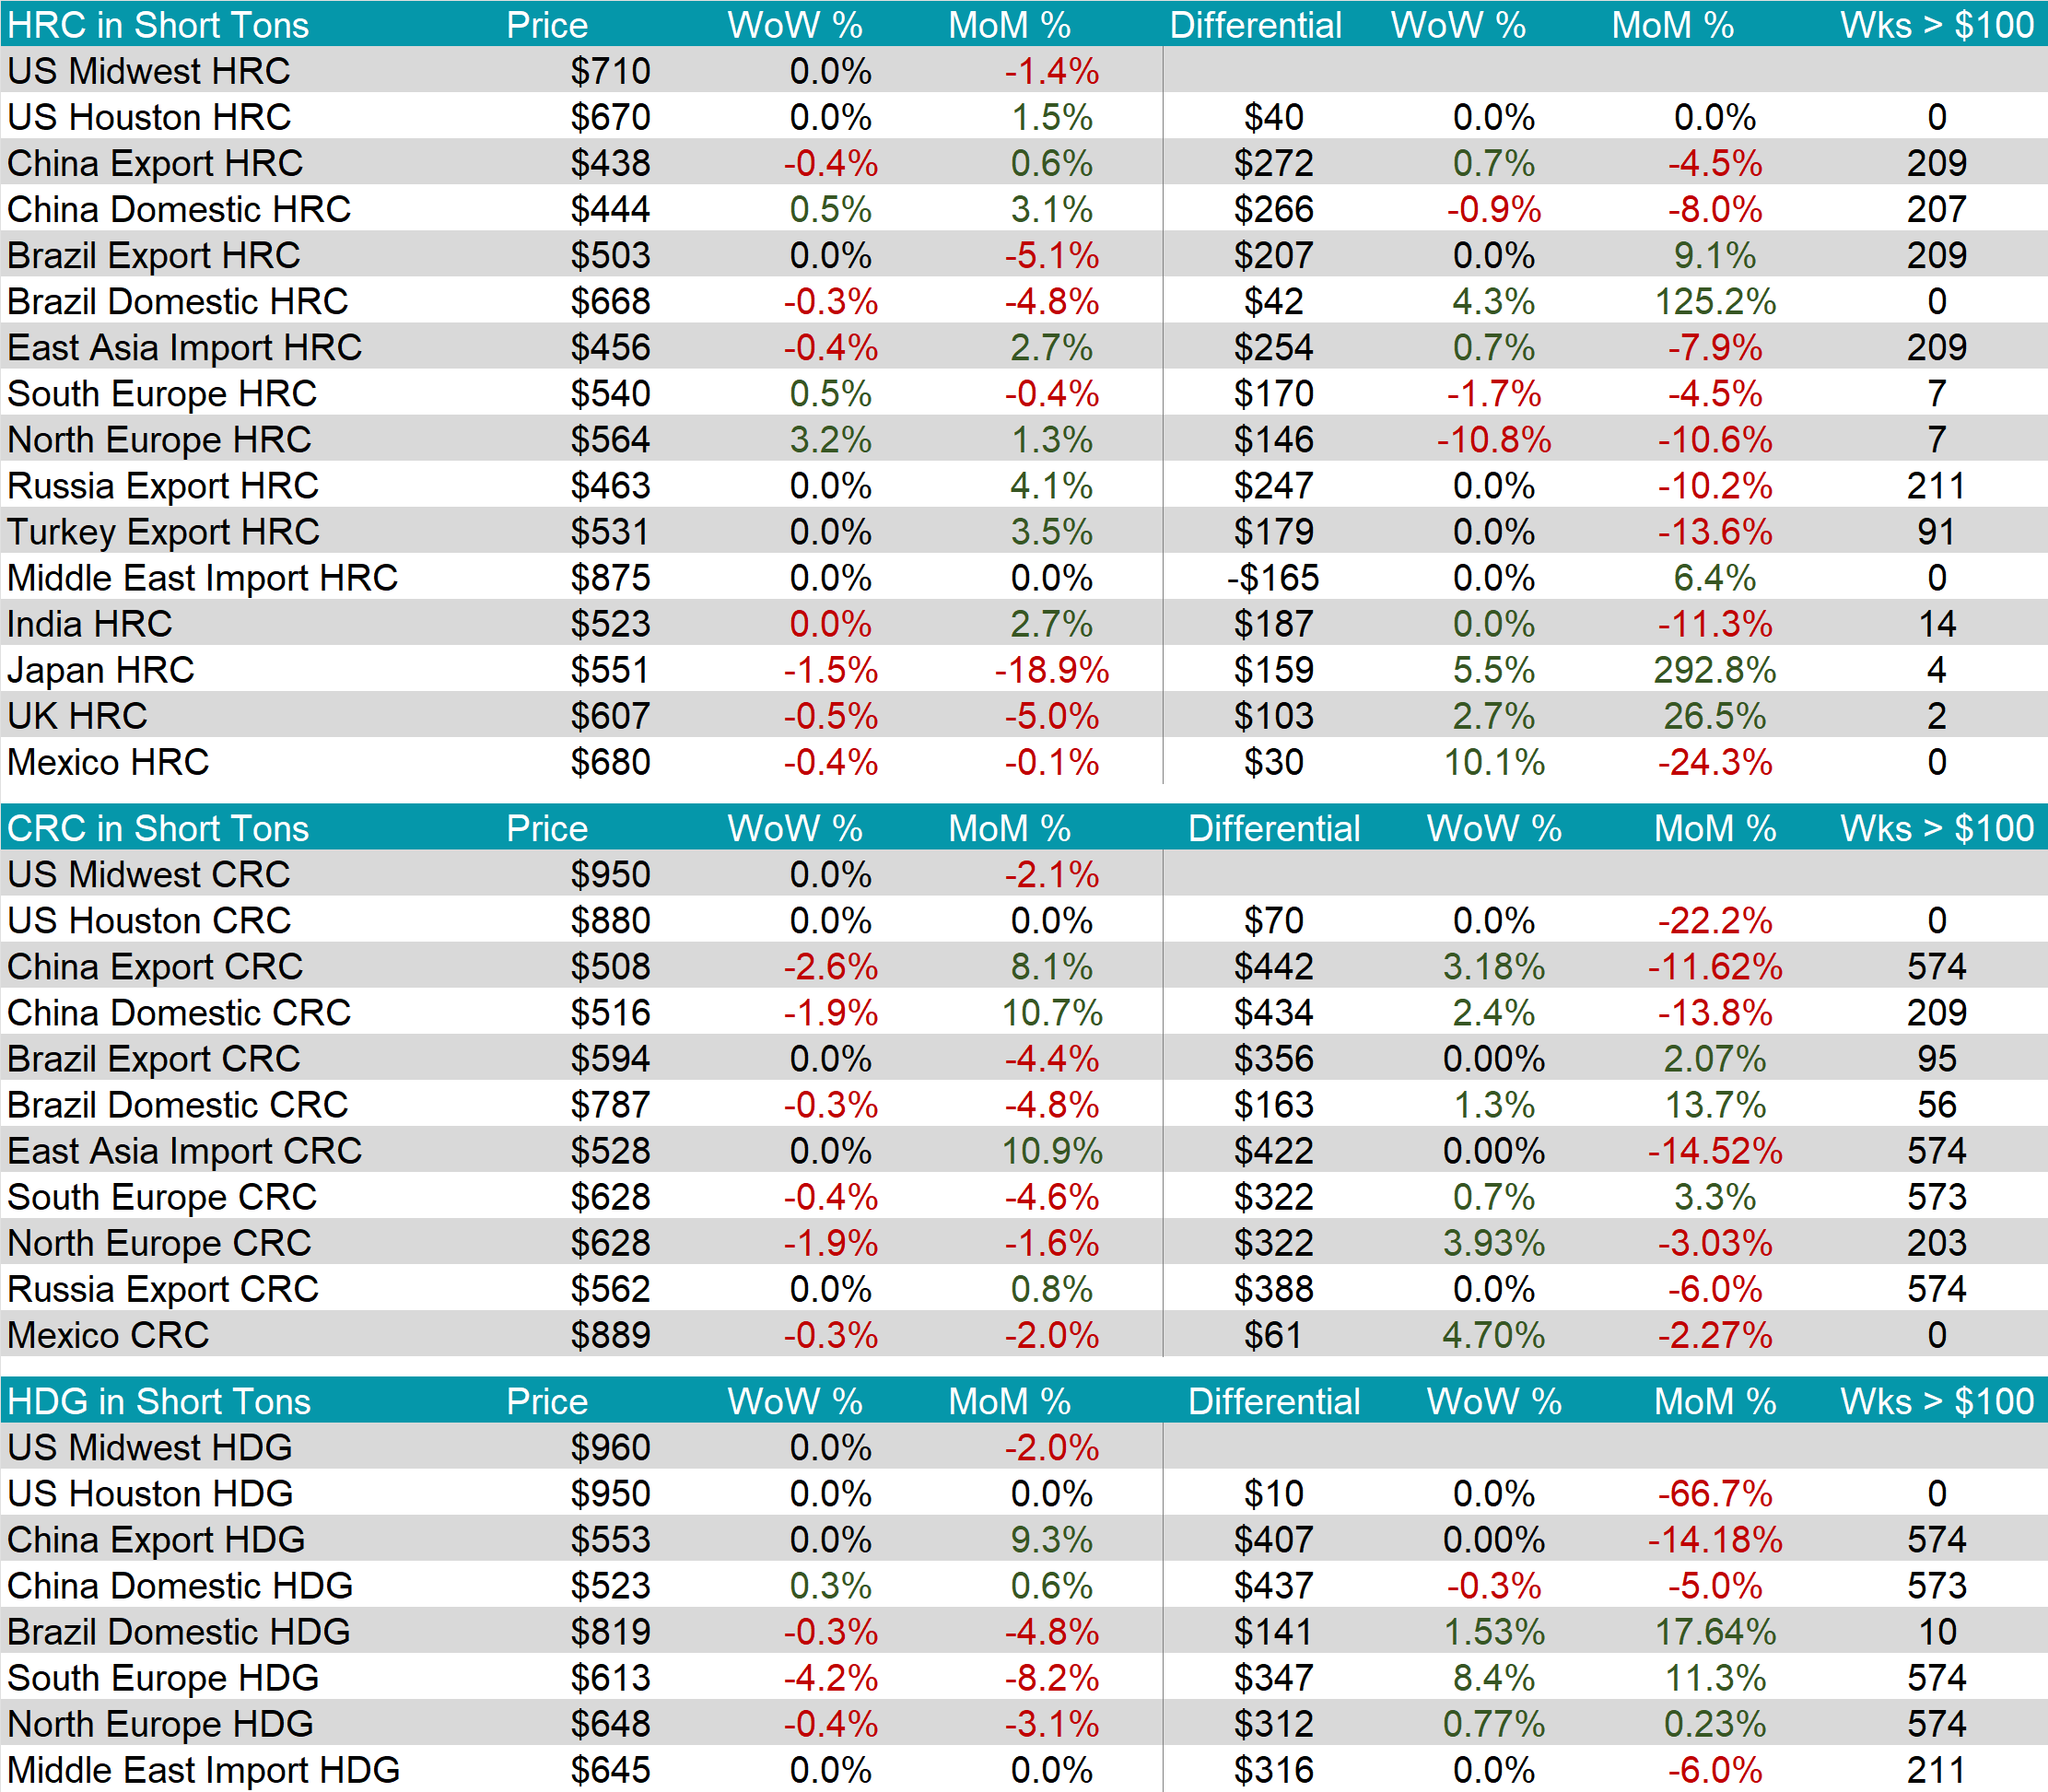
The HRC spot price remained unchanged at $710. At the same time, the HRC 2nd month future also held steady, staying at $702.
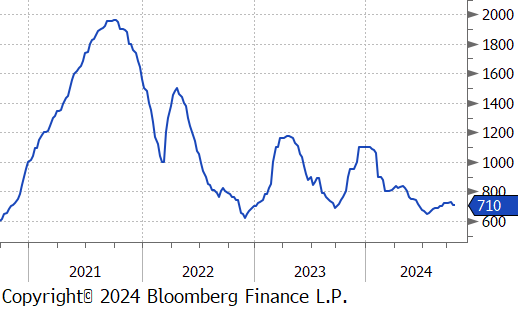
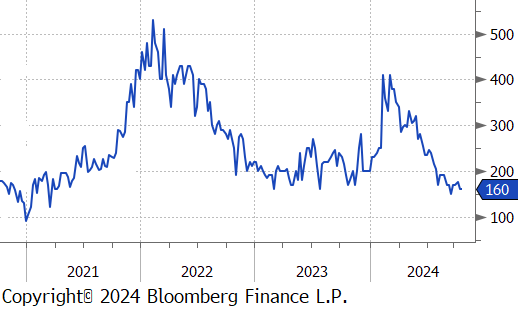
Tandem products both remained unchanged, resulting in the HDG – HRC differential to stay at $160.
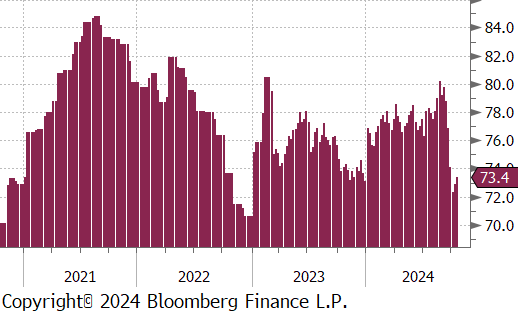
Mill production increased but remains to be subdued, with capacity utilization ticking up by 0.5% to 73.4%, bringing the raw steel production up to 1.631m net tons.
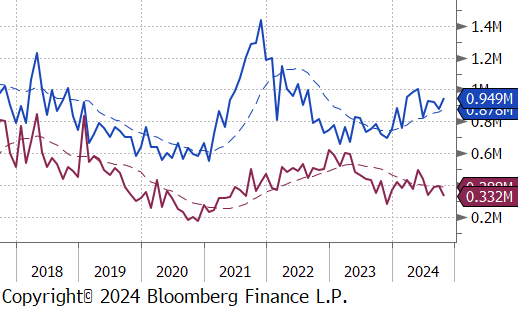
October Projection – Sheet 986k (up 145k MoM); Tube 331k (down 42k MoM)
September Census – Sheet 841k (down 78k MoM); Tube 373k (down 15k MoM)
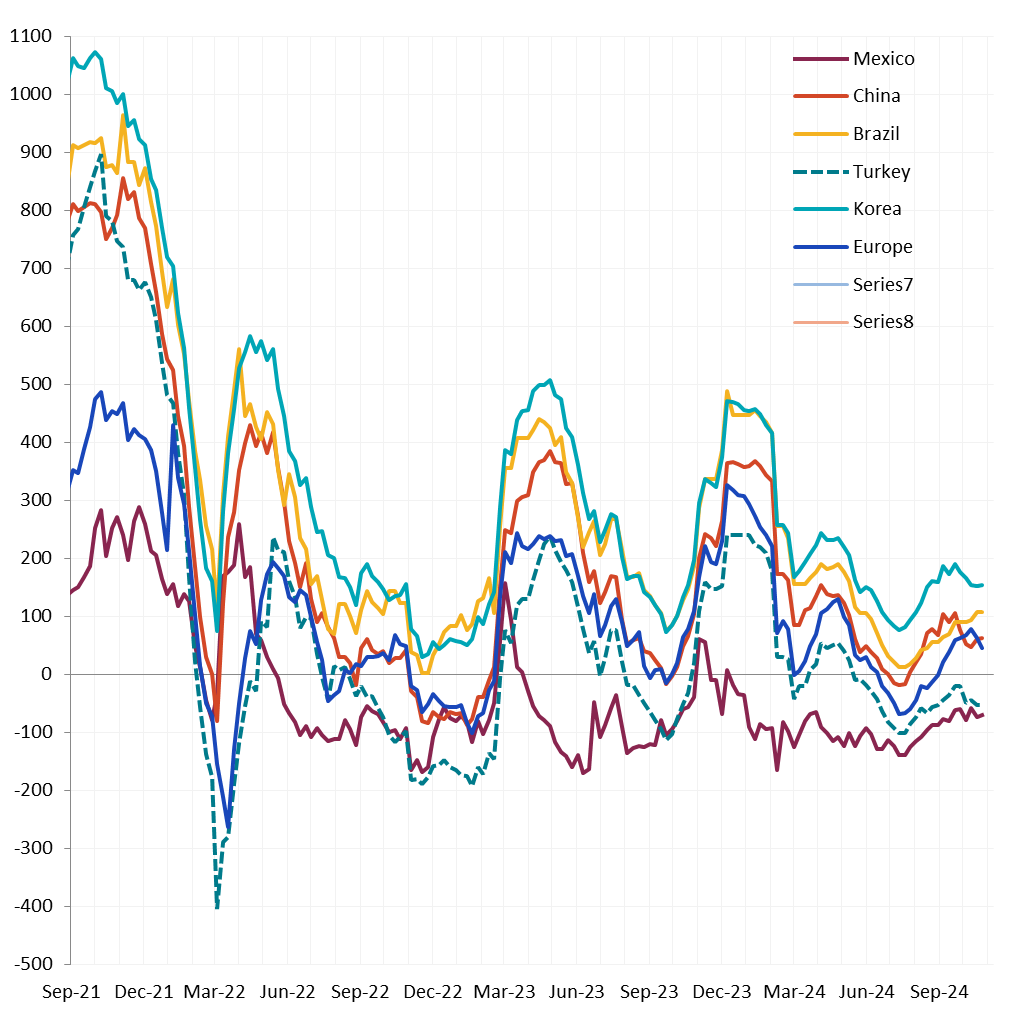
Watched global differentials varied this week, with China Export HRC falling by -0.4%, while North Europe HRC price rose by 3.2%.
Scrap
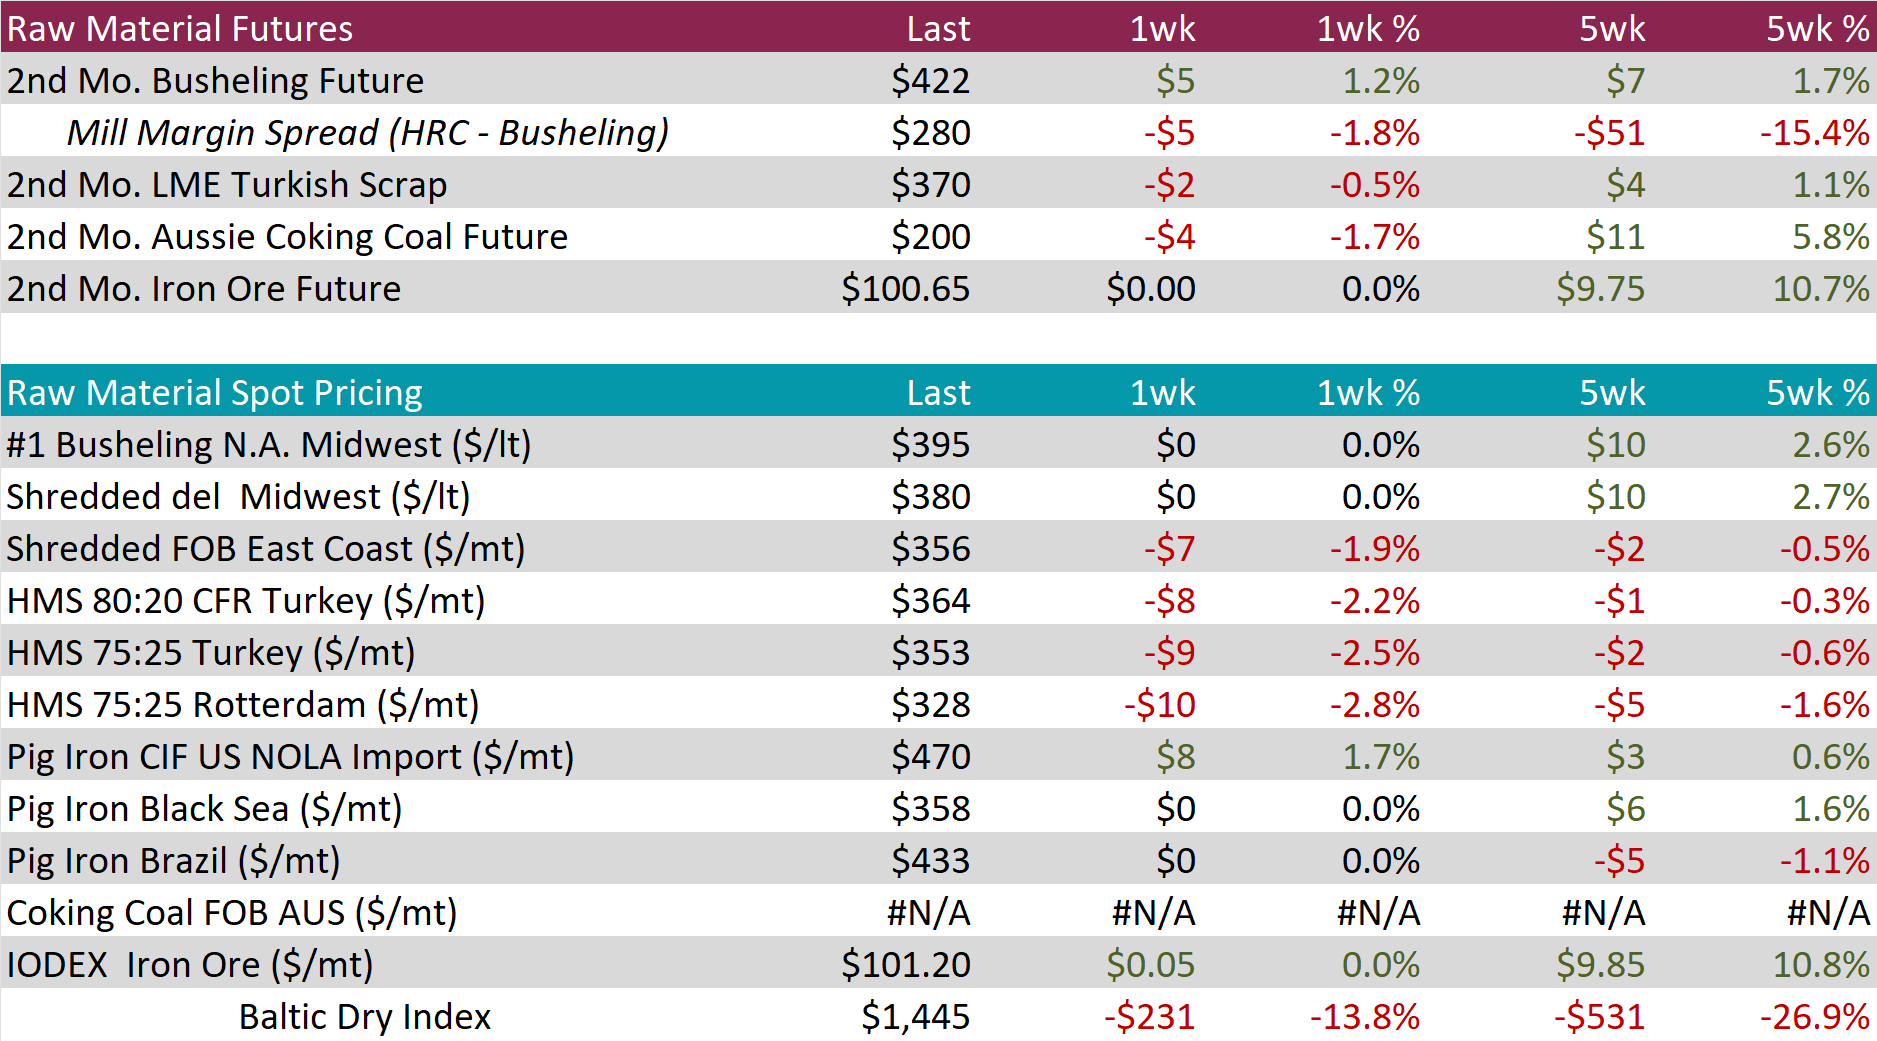
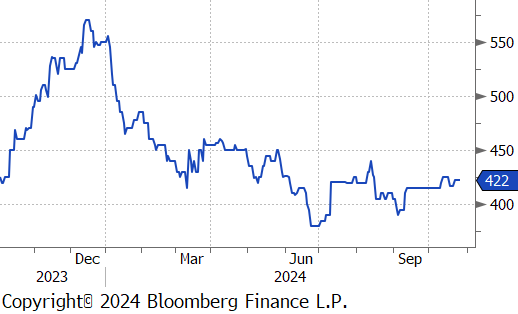
The busheling 2nd month future rose by $5 or 1.2% to $422, furthering last weeks gain.
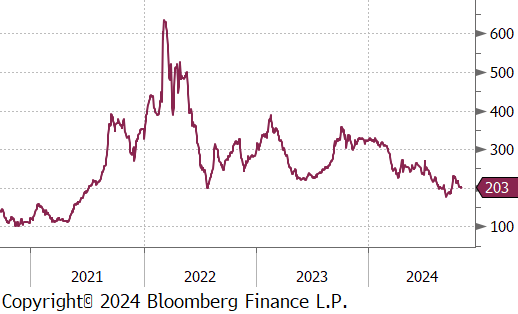
The Aussie coking coal 2nd month future declined by $4 oir -1.7% to $200, marking the third consecutive week of price declines.
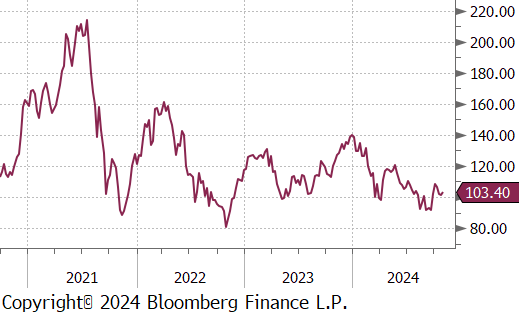
The iron ore 2nd month future remained unchanged at $100.65, resulting in the five-week price change to be up by $9.75 or 10.7%.
Dry Bulk / Freight
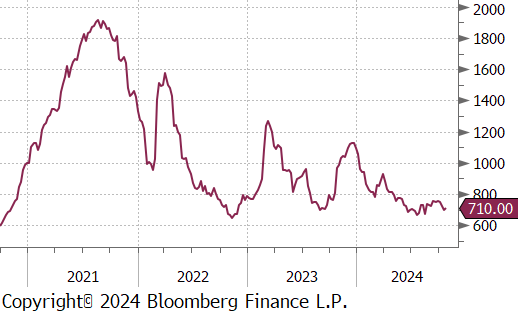
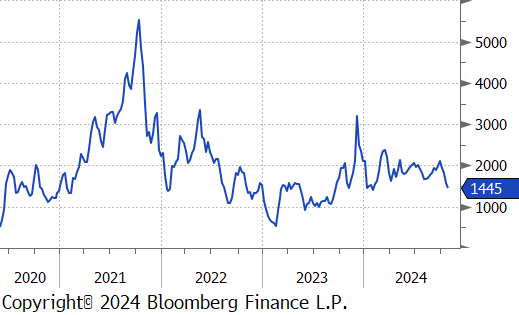
The Baltic Dry Index dropped by $231 or -13.8% to $1,445, hitting the lowest price since February.
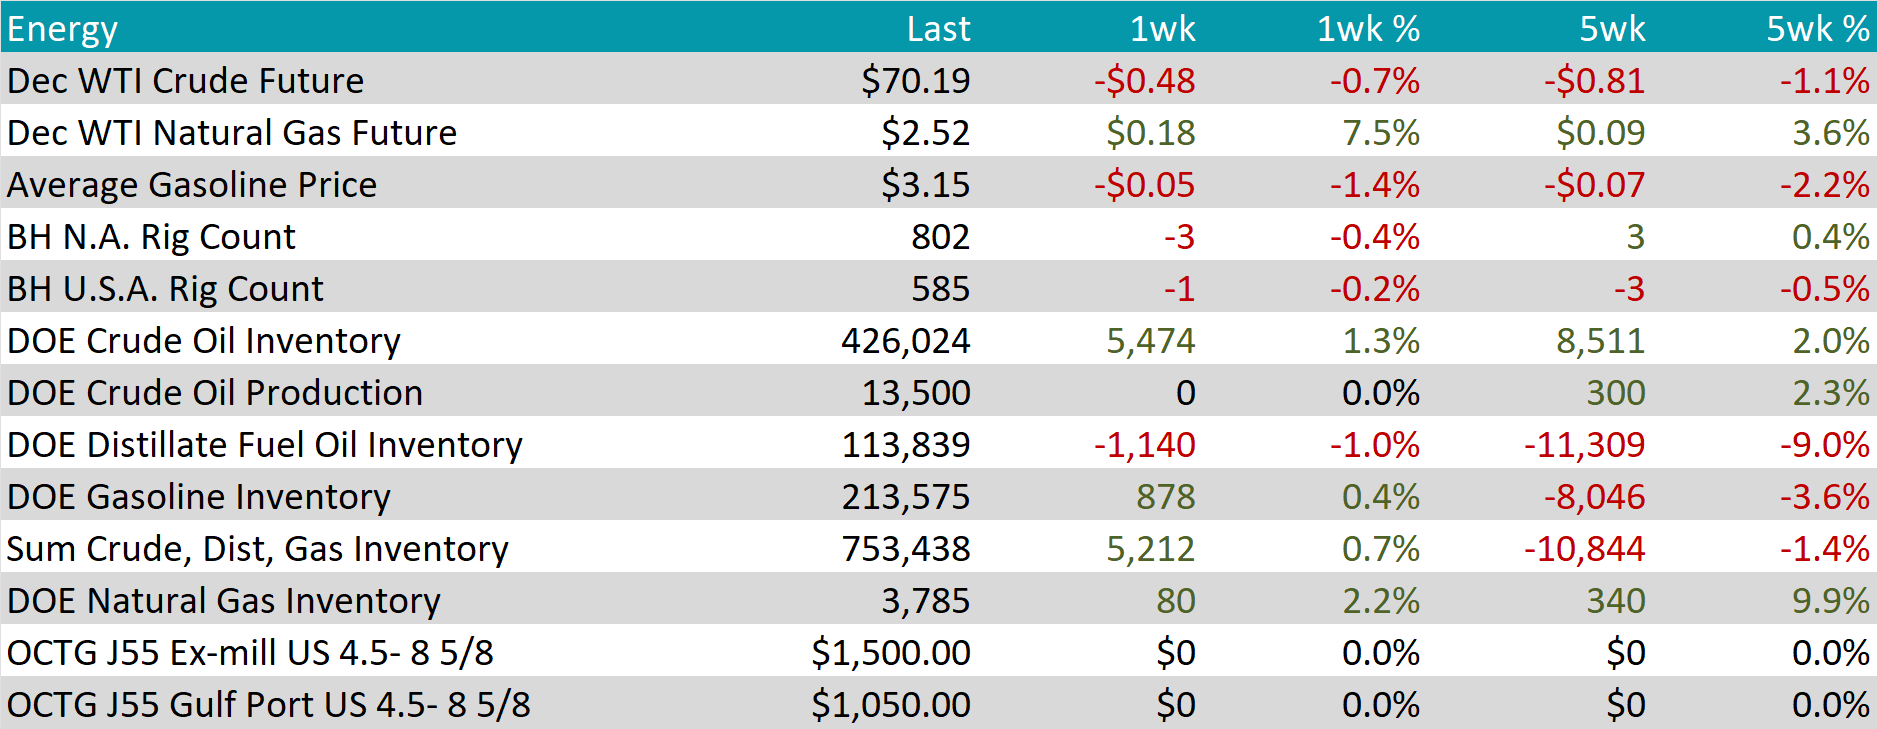
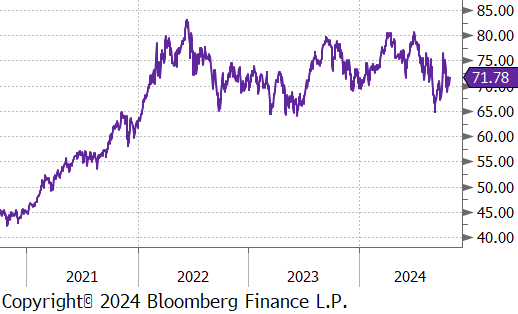
WTI crude oil future lost $0.48 or -0.7% to $70.19/bbl.
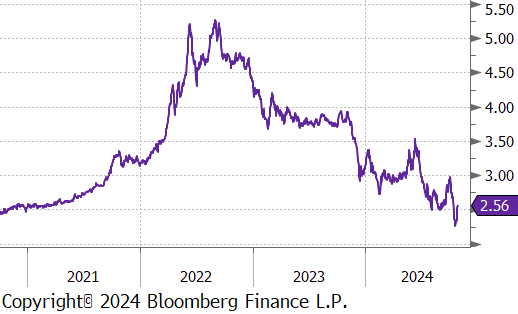
WTI natural gas future gained $0.18 or 7.5% to $2.52/bbl.
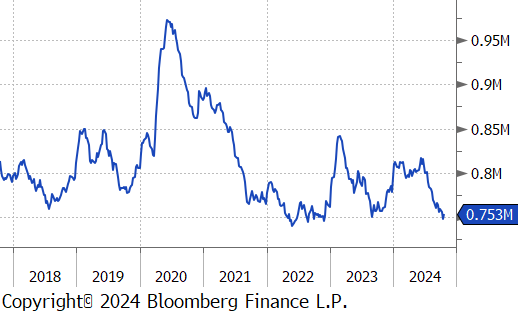
The aggregate inventory level experienced a slight increase, rising this week by 0.7%.
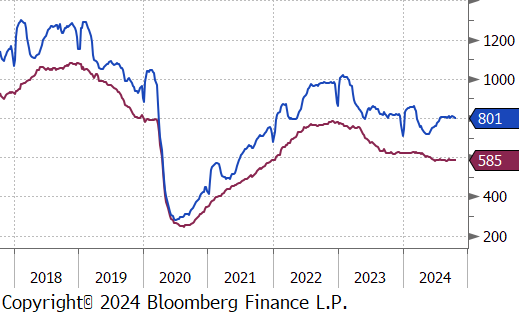
The Baker Hughes North American rig count reduced by 3 rigs, bringing the total count to 802 rigs. Meanwhile, the US rig count also fell, reducing by 1 rig, bringing the total count to 585 rigs.
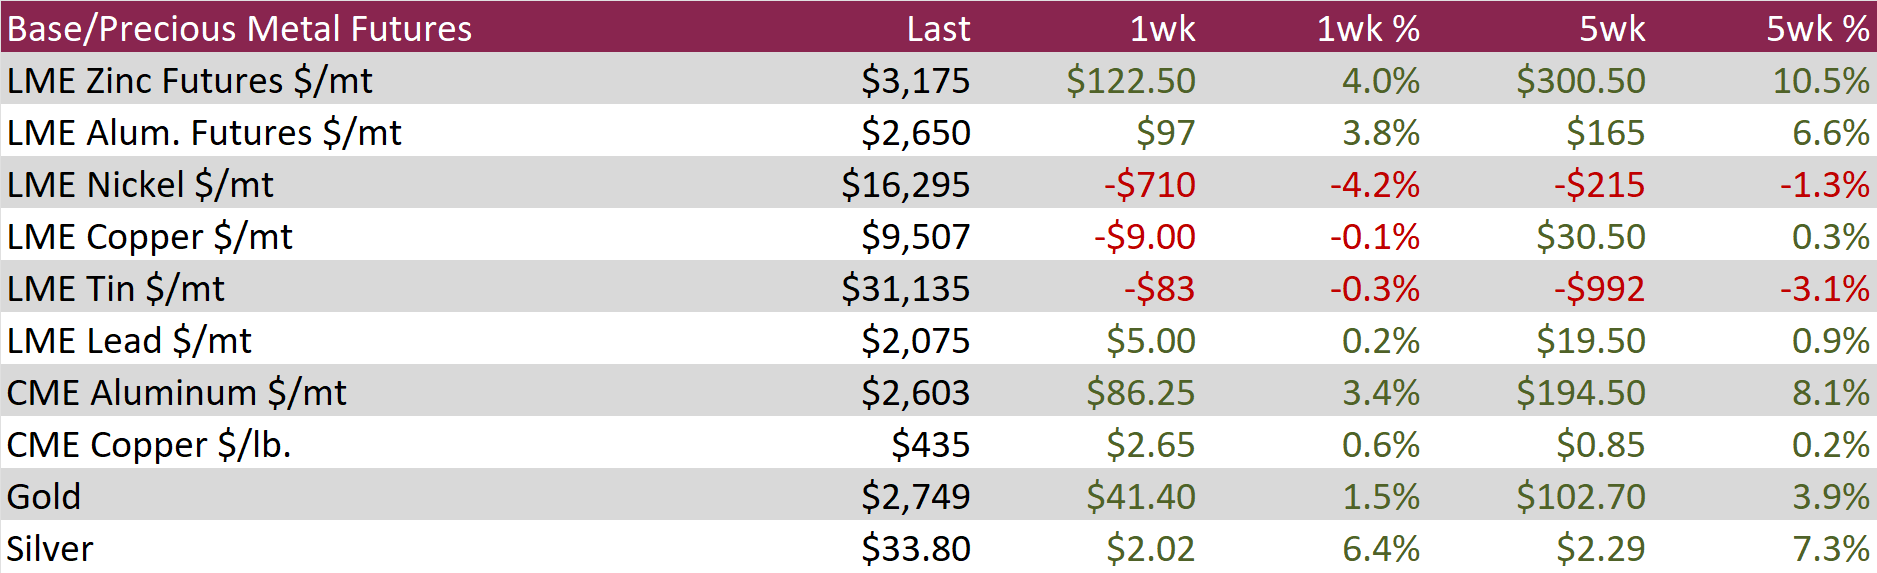
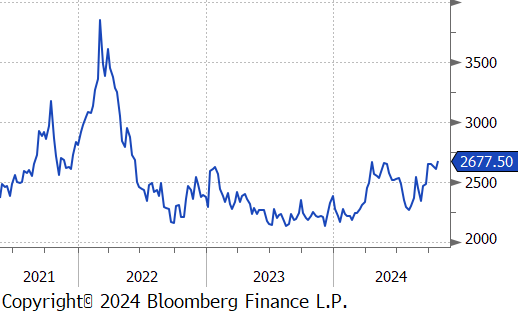
Aluminum futures jumped up by $97 or 3.8% to $2,650, nearing the four-month high. This comes as markets assess the potential impact of recent economic support measures from the Chinese government on industrial demand. Following an economic-focused Politburo meeting, Beijing announced an aggressive fiscal stimulus package aimed at helping the economy reach its 5% growth target for the year. This follows the People’s Bank of China’s (PBoC) earlier monetary stimulus, which included key rate cuts, injecting CNY 1 trillion of liquidity, and refinancing over CNY 37 trillion in mortgages at more favorable rates. Additionally, ongoing risks around alumina supply in China, exacerbated by earlier output disruptions in Guinea and Australia, continue to support aluminum prices.
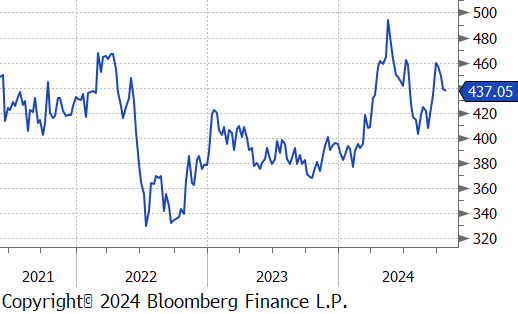
Copper futures inched up by $2.65 or 0.6% to $435. Escalating tensions in the Middle East led investors to shift from riskier assets to safer havens. However, optimism around China’s economic stimulus measures continued to buoy market sentiment, with expectations of stronger demand from the world’s top metals consumer. Further support for copper prices came from the potential for additional US interest rate cuts, which could boost global economic activity and fuel demand for industrial metals.
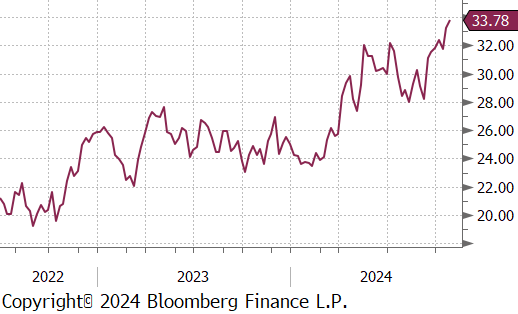
Silver rose by $2.02 or 6.4% to $33.80, marking their highest level in 12 years, driven by strong demand for safe-haven assets and bullish expectations for industrial use, boosted by China’s stimulus measures. Geopolitical tensions also fueled silver’s rise, as fears of escalating conflict in the Middle East intensified after Israel pledged retaliation against Iran’s ballistic missile attack, potentially targeting Iran’s oil infrastructure. Additionally, silver benefited from China’s aggressive fiscal and monetary stimulus efforts aimed at supporting its economy, further boosting demand for silver in industrial applications such as electrification and solar panels. However, the upward momentum was tempered by a strong US jobs report, which dampened expectations for dovish Federal Reserve policies and capped further bullion gains.
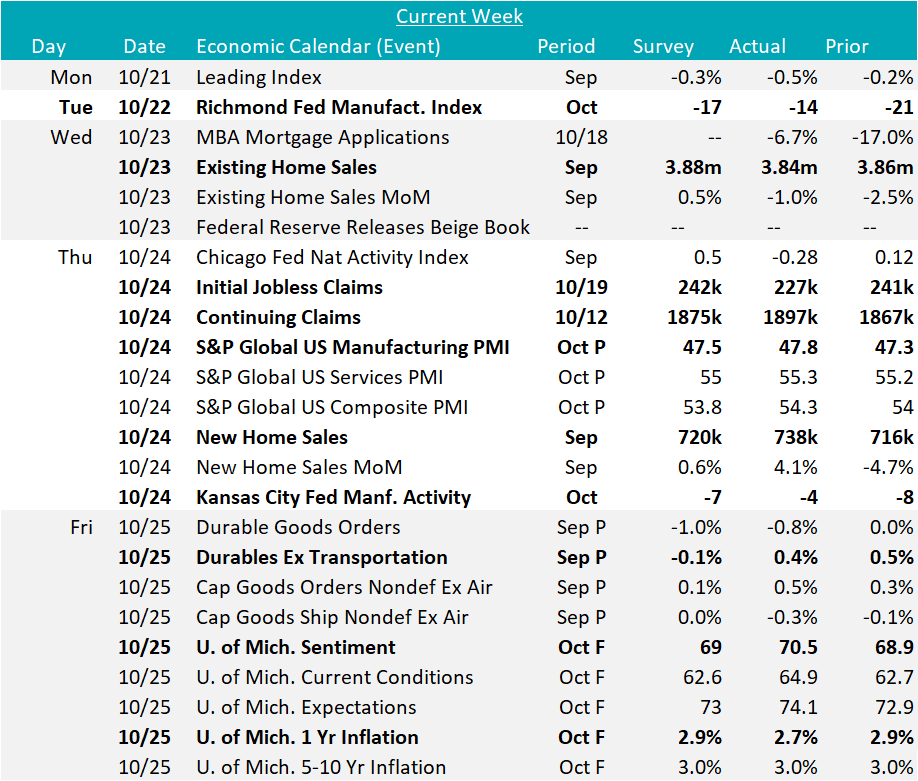
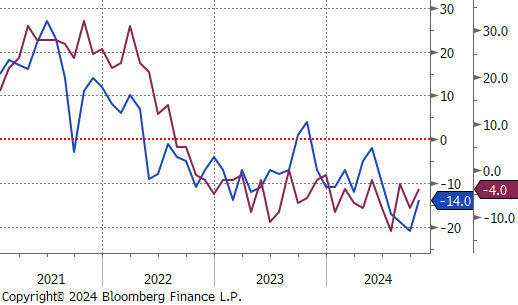
Additional October FED Manufacturing Surveys showed a move in the right direction with better-than-expected readings, but both Richmond and Kansas City remain in contraction territory. Richmond printed up to -14, from Septembers reading of -21, and above the expected -17, and Kansas City came in at -4, up from -8, and better than the expected -7. The preliminary S&P Global US Manufacturing PMI moved in a similar direction, printing up to 47.8, from last month’s 47.3, and better than the expected 47.5.
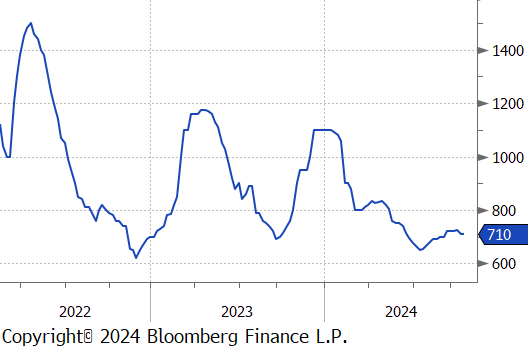
September housing data show a continued divergence in the trends for new and existing home sales. New sales jumped by 4.1% to their highest annualized level since May, while existing sales were down by -1% compared to the expected 0.5% increase. Given the fact that the Federal Reserve is so reluctant to provide forward guidance with the cutting cycle, and with a clear signal that there is a vast amount of refinancing demand, we anticipate existing inventories to remain low going into next year and for new home sales to benefit from this dynamic.
Preliminary durable goods new orders data also came in slightly better than the expected, printing down -0.8% verses the anticipated -1% decline. This provides another troubling signal for the automotive sector, as the ex. Transportation component actually printed significantly better than expectations, rising 0.4% versus the expected -0.1%.
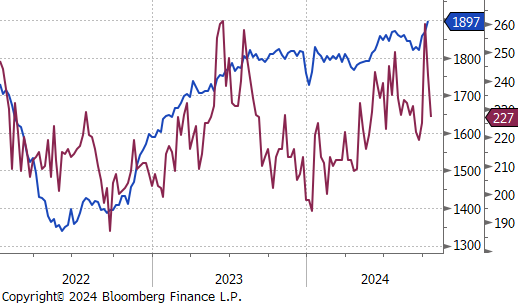
Initial claims also continued their downward trend, printing 227k, versus an expected 242k. Initial claims data is now back to Hurricane Helene levels. Continuing claims came in at 1,897k, above the expected 1,875k.
Finally, and encouragingly, the final University of Michigan Consumer Sentiment Survey came in above expectations, printing at 70.5, versus an expected 69. This is the highest reading in 6 months. A main contributing force here, was the 1yr inflation expectation declining to 2.7%, from the preliminary reading of 2.7%. While the current reading remains above the FEDs target, the final data suggests consumers anticipate further disinflation in the coming months.