Flack Capital Markets | Ferrous Financial Insider
October 4, 2024 – Issue #452
October 4, 2024 – Issue #452
Overview:
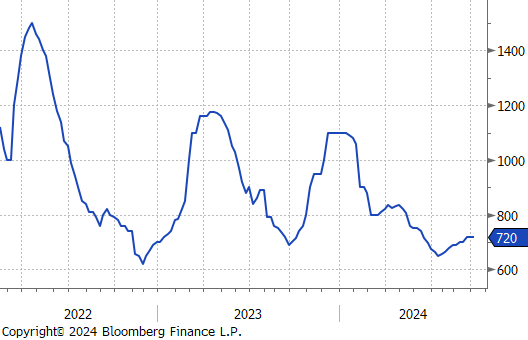
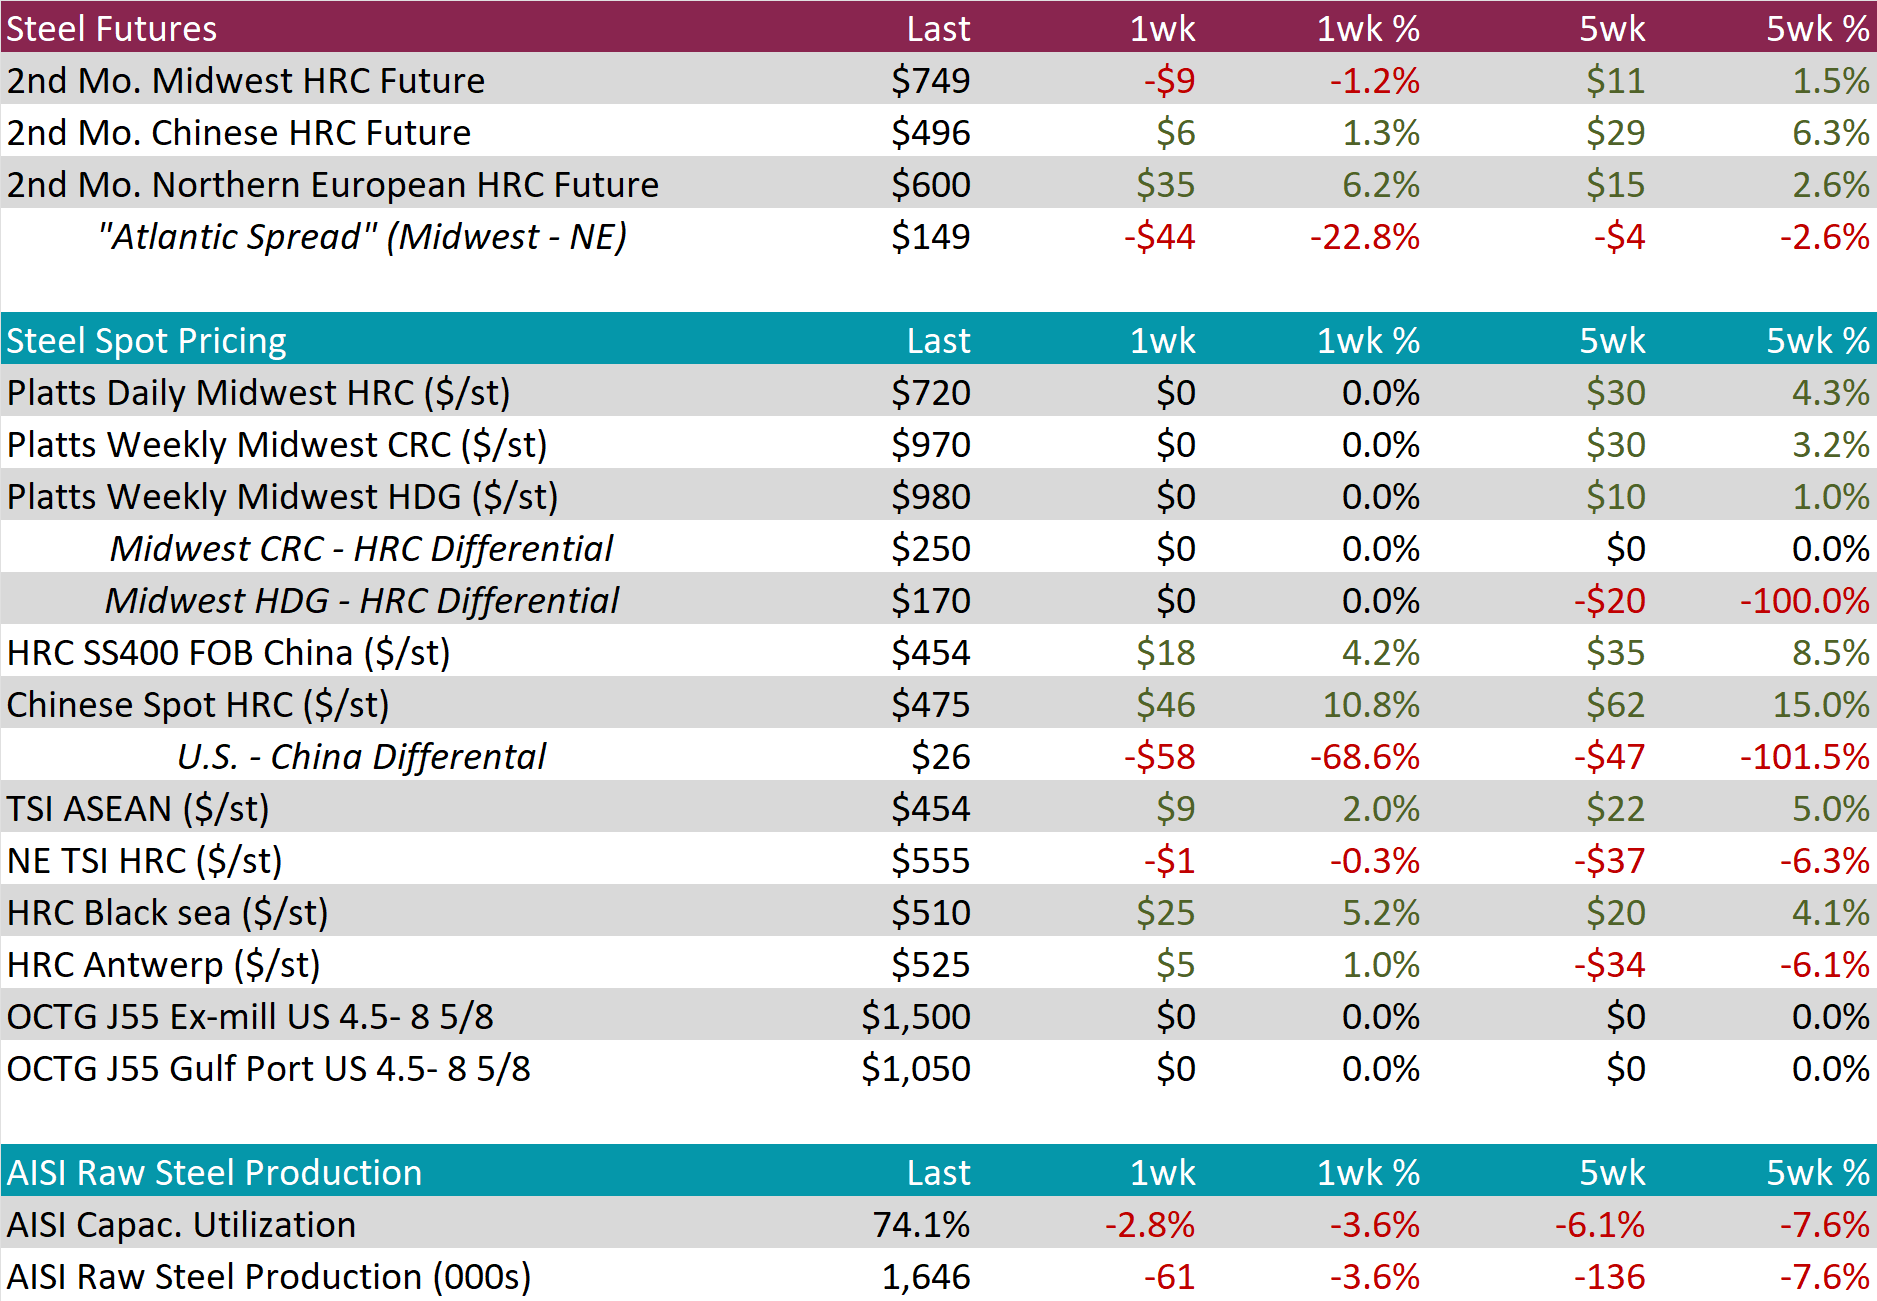
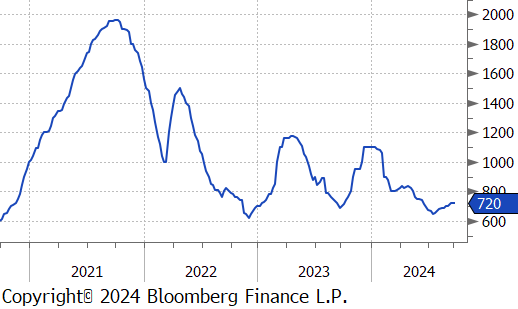
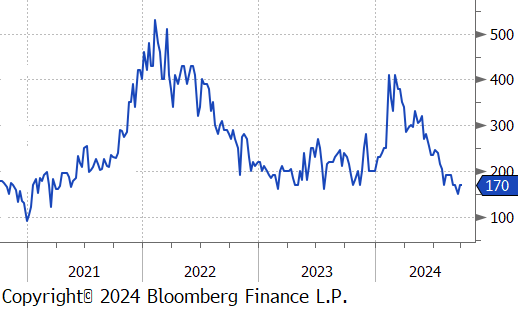
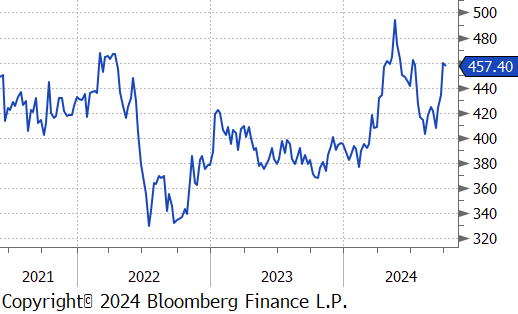
The HRC spot price remained unchanged at $720 for the third consecutive week, bringing the five-week price change to be up by $30 or 4.3%. At the same time, the HRC 2nd month future slipped by $9 or -1.2% to $749, reversing last week’s gains.
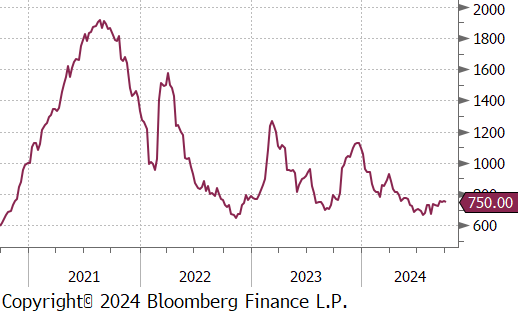
Tandem products both held steady week-over-week, resulting in the HDG – HRC differential to remain at $170.
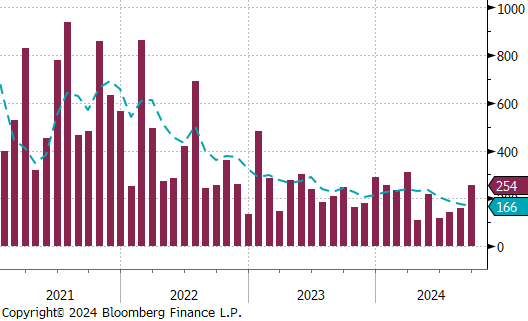
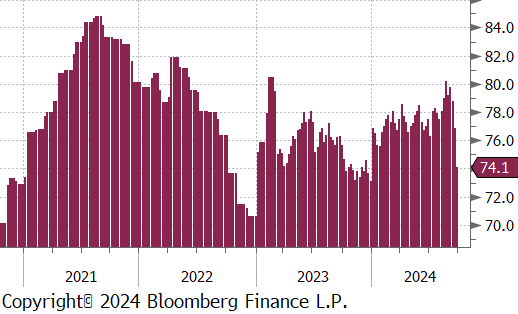
Mill production notably scaled back further, with capacity utilization ticking down by -2.8% to 74.1%, bringing raw steel production down to 1.646m net tons, reaching the lowest level since December 2022.
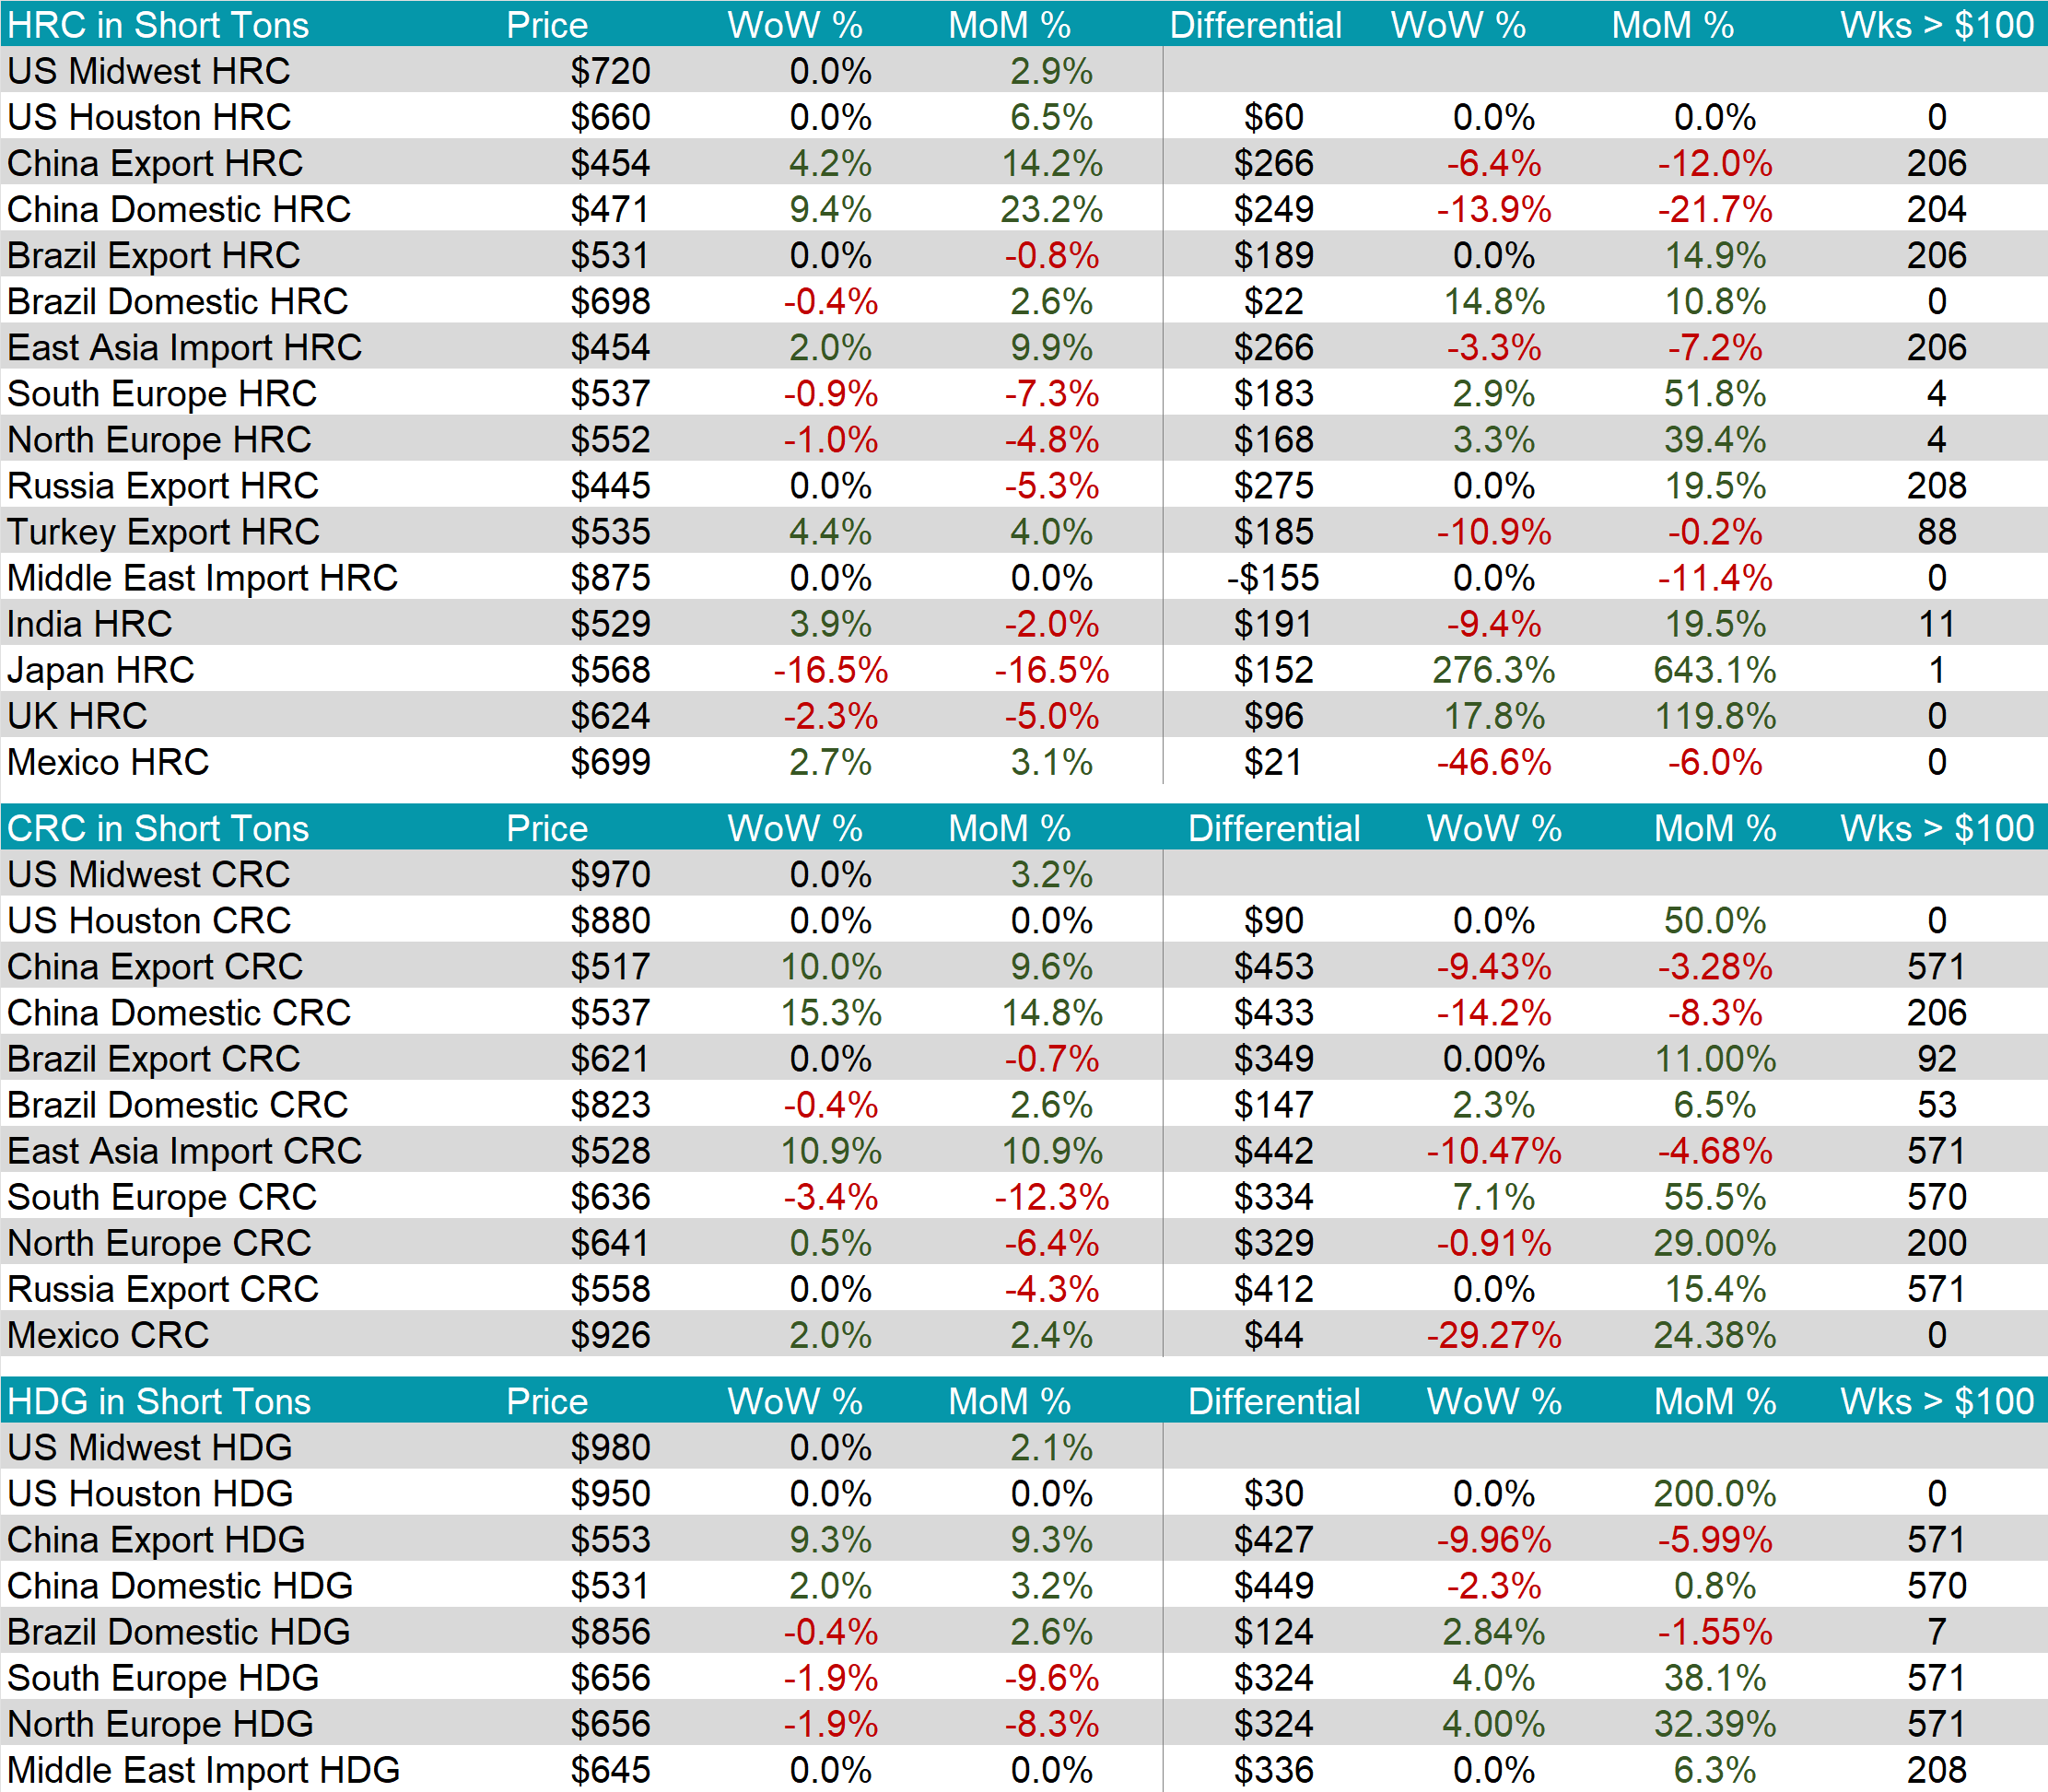
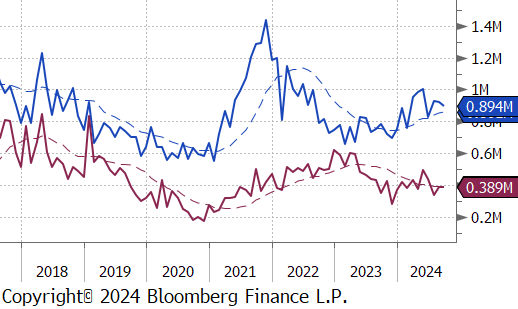
September Projection – Sheet 894k (down 25k MoM); Tube 389k (up 0k MoM)
August Census – Sheet 918k (down 12k MoM); Tube 389k (up 51k MoM)
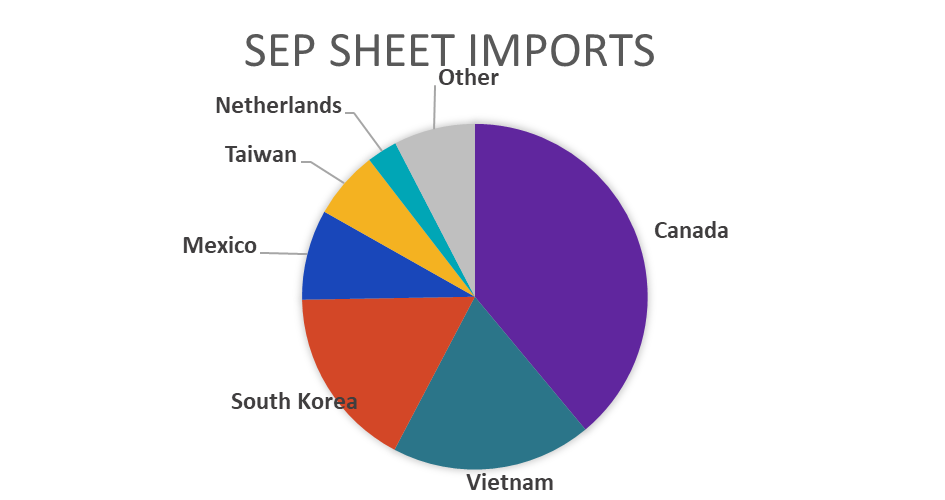
Watch global differentials were mixed this week, with China Export HRC surging by 4.2%, Korea HRC +2.0%, Turkey HRC +4.4% and Mexico HRC +2.7%, whereas North Europe HRC continued to slip, -1.0%.
Scrap
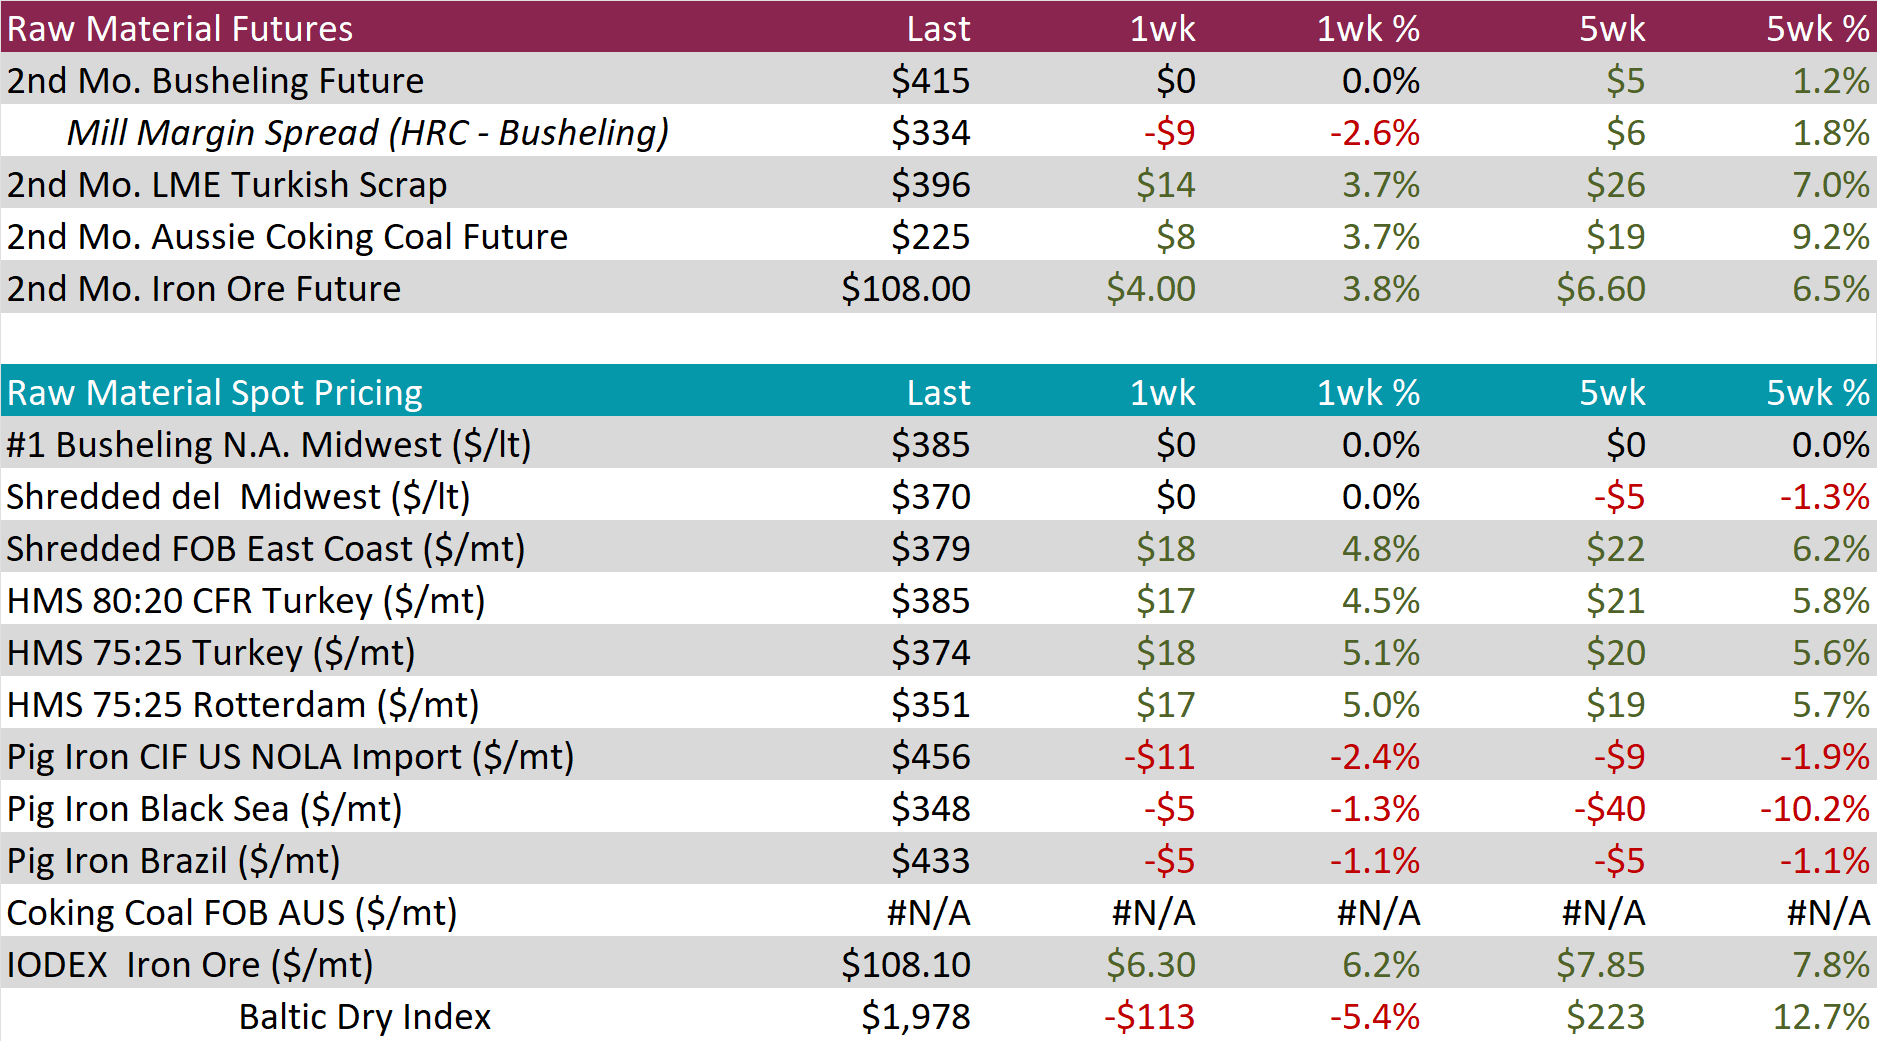
The busheling 2nd month future continued to stay at $415, bringing the five-week price change to be up by $5 or 1.2%.
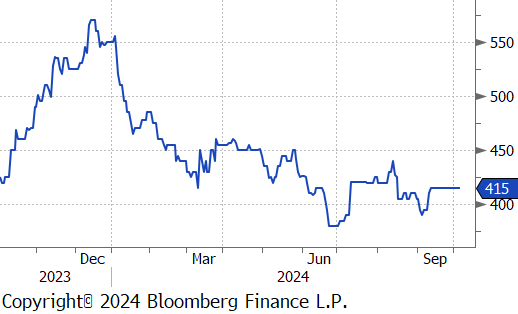
The Aussie coking coal 2nd month future rose by $8 or 3.7% to $225, marking the fourth consecutive week of price increases and the highest price in nine weeks.
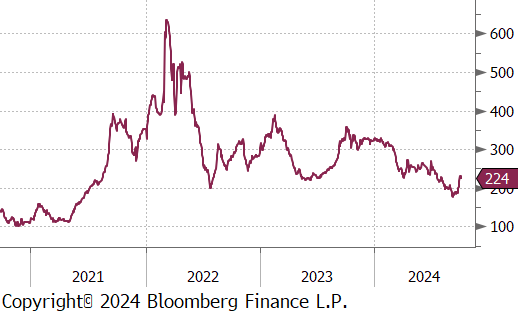
The iron ore 2nd month future increased for the second consecutive week, inching up by $4 or 3.8% to $108, hitting the highest price in twelve weeks.
Dry Bulk / Freight
The Baltic Dry Index fell by $113 or -5.4% to $1,978, ending a four week stretch of increases.
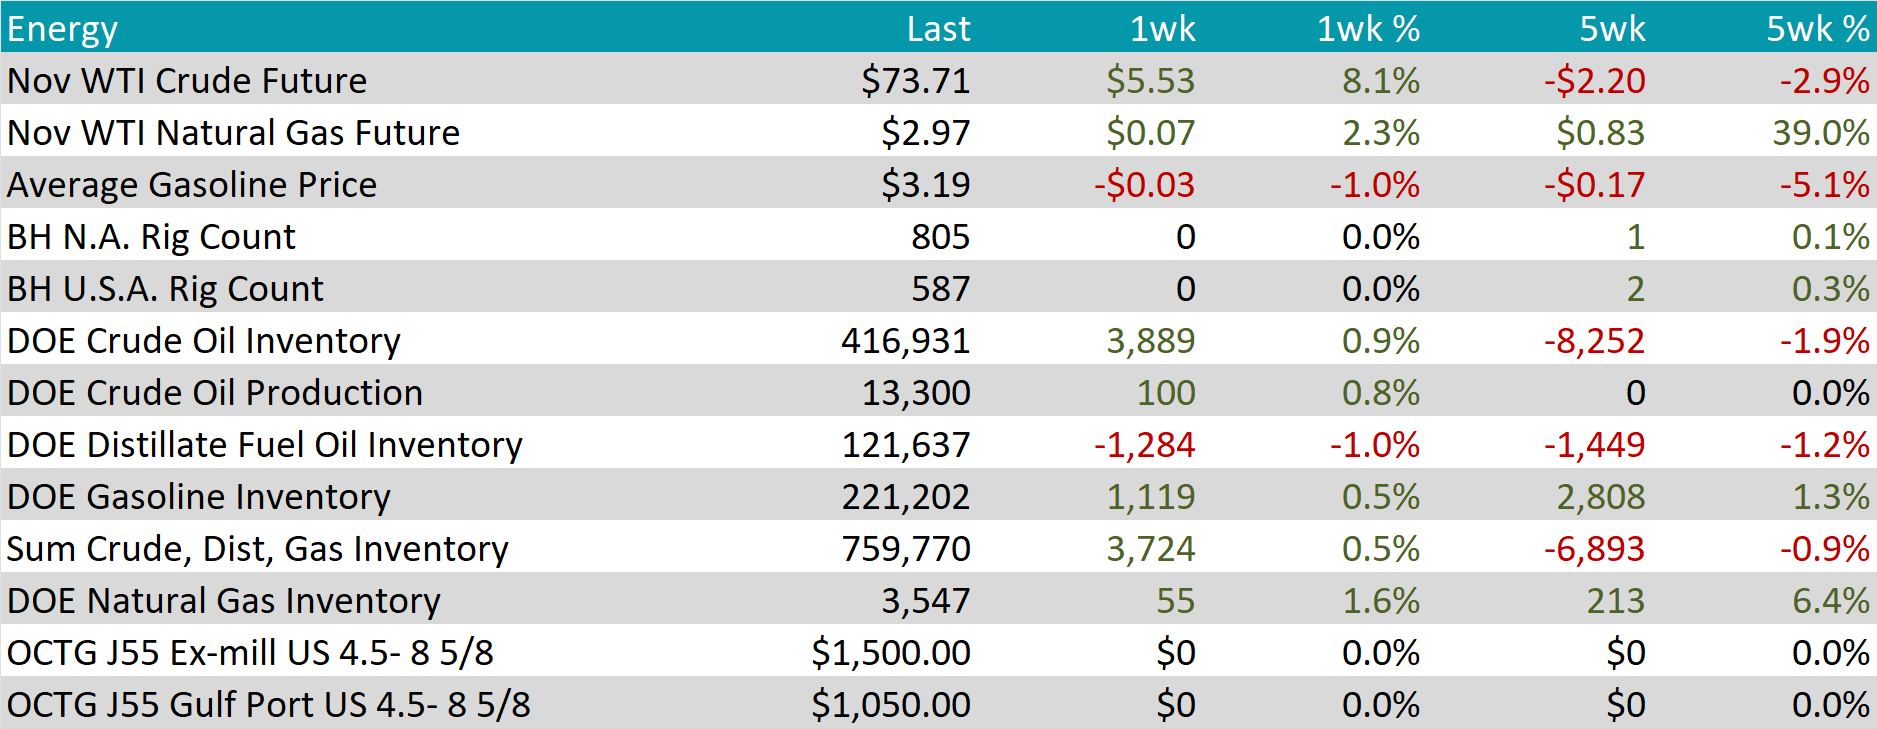
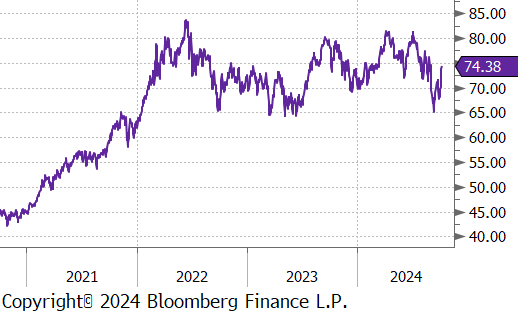
WTI crude oil future gained $5.53 or 8.1% to $73.71/bbl.
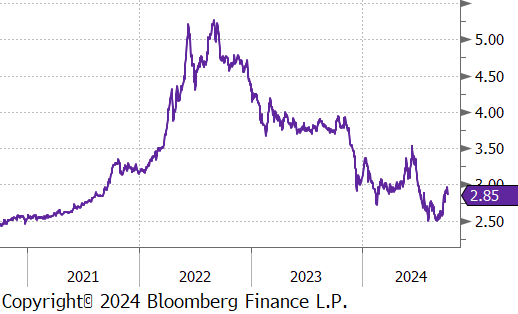
WTI natural gas future gained $0.07 or 2.3% to $2.97/bbl.
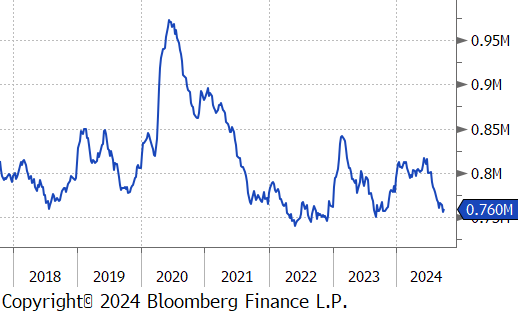
The aggregate inventory level experienced an increase of 0.5%, after declining for two consecutive weeks.
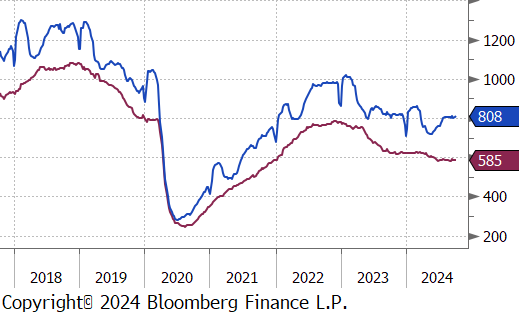
The Baker Hughes North American rig count remained unchanged, keeping the total count at 805 rigs. Similarly, the US rig count held steady, keeping the total count at 587 rigs.
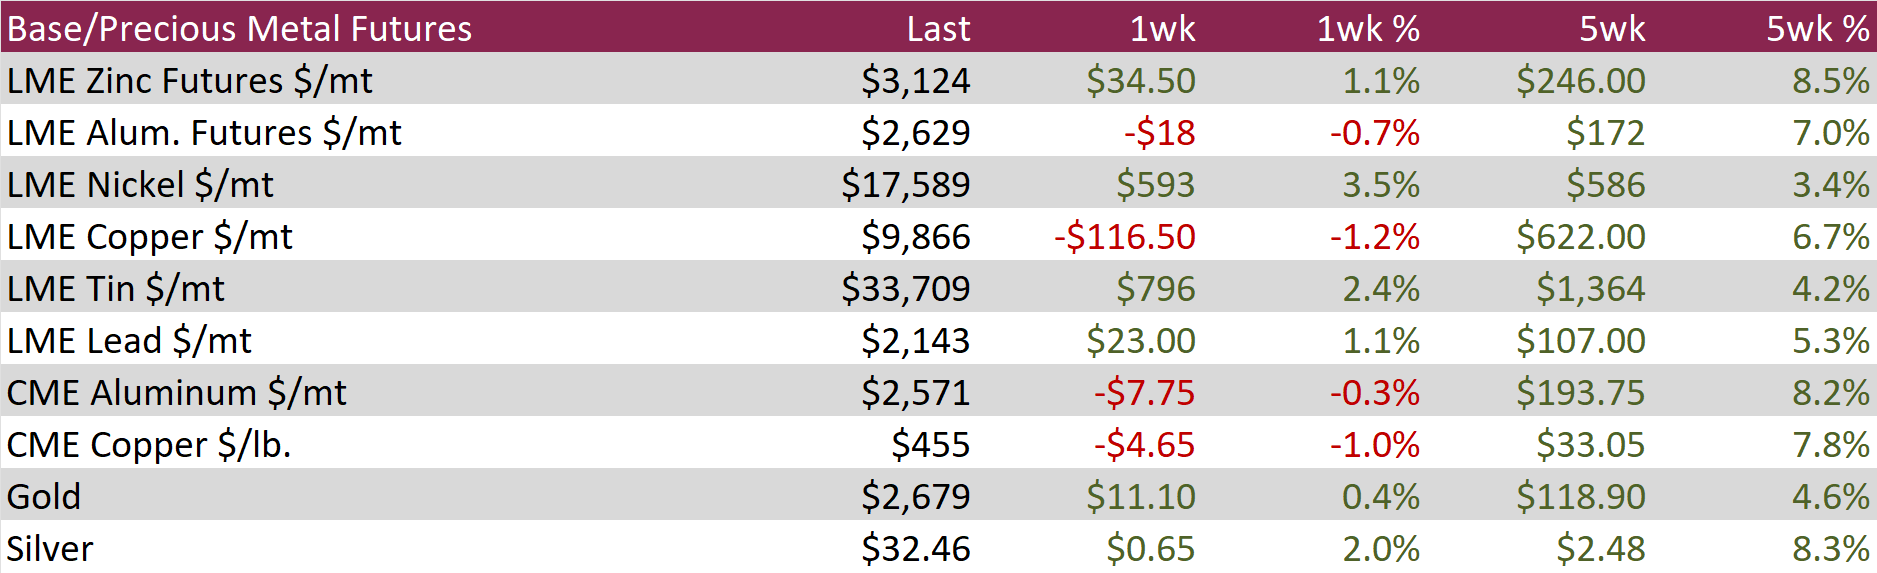
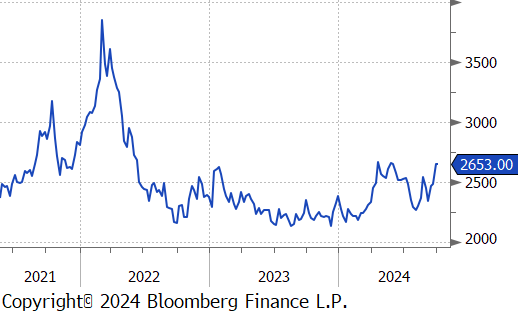
Aluminum futures fell by $18 or -0.7% to $2,629, easing from the four-month high of $2,685 reached on October 2nd. This pullback comes as markets assess the potential impact of recent economic support measures from the Chinese government on industrial demand. Following an economic-focused Politburo meeting, Beijing announced an aggressive fiscal stimulus package aimed at helping the economy reach its 5% growth target for the year. This follows the People’s Bank of China’s (PBoC) earlier monetary stimulus, which included key rate cuts, injecting CNY 1 trillion of liquidity, and refinancing over CNY 37 trillion in mortgages at more favorable rates. Additionally, ongoing risks around alumina supply in China, exacerbated by earlier output disruptions in Guinea and Australia, continue to support aluminum prices.
Copper futures slipped by $4.65 or -1.0% after a volatile week, with low trading volumes due to Chinese markets being closed for a national holiday. The metal recorded its first weekly decline since early September, losing half a percent as traders locked in profits following copper’s recent four-month high. Additionally, escalating tensions in the Middle East led investors to shift from riskier assets to safer havens. However, optimism around China’s economic stimulus measures continued to buoy market sentiment, with expectations of stronger demand from the world’s top metals consumer. Further support for copper prices came from the potential for additional US interest rate cuts, which could boost global economic activity and fuel demand for industrial metals.
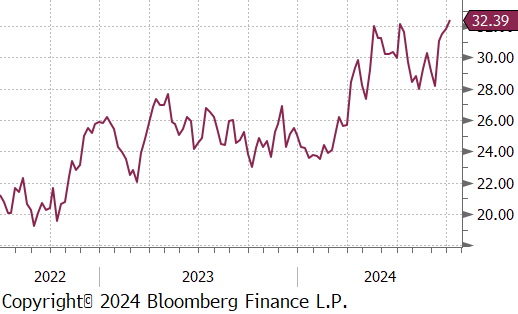
Silver rose by $0.65 or 2.0% to $32.46, marking their highest level in 12 years, driven by strong demand for safe-haven assets and bullish expectations for industrial use, boosted by China’s stimulus measures. Geopolitical tensions also fueled silver’s rise, as fears of escalating conflict in the Middle East intensified after Israel pledged retaliation against Iran’s ballistic missile attack, potentially targeting Iran’s oil infrastructure. Additionally, silver benefited from China’s aggressive fiscal and monetary stimulus efforts aimed at supporting its economy, further boosting demand for silver in industrial applications such as electrification and solar panels. However, the upward momentum was tempered by a strong US jobs report, which dampened expectations for dovish Federal Reserve policies and capped further bullion gains.
September manufacturing data from early in the week underscore continued contraction within the sector. The summation of:
– FED Manufacturing surveys (slightly higher still in contraction)
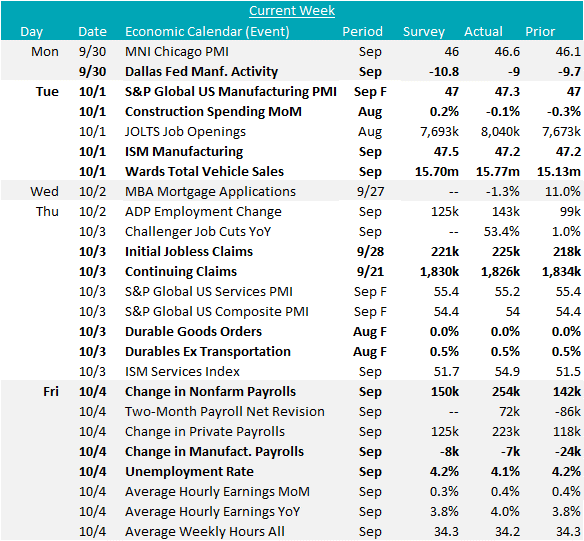
– ISM Manufacturing PMI (flat MoM at 47.2, below expected 47.5)
– S&P Global Manufacturing PMI (up 47.3, above expectations for a flat print at 47)
all highlight the fact that elevated borrowing costs and election uncertainty have stood in the way of a recovery in consumption from the sector. The FED will clearly continue the cutting cycle from here, but this week’s labor market data puts to question whether it will be as rapid as the market was pricing.
On the construction spending side, August CPIP (Construction Put In Place) shows a continued 4.1% YoY strength, however, recent monthly figures are pointing to stagnation, down (-0.1% versus an expected 0.2%) for the 3rd consecutive month with 6 of the last 7 coming in below expectations. Private spending decreased by 0.2%, and nonresidential spending was down 0.1%. On the other hand, public spending continues to be a bright spot, up 0.3% this month for the 6th time in the last 8.
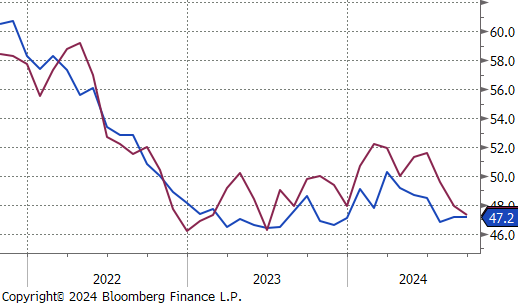
Of most note, labor market data has recently been signaling more resilience than previously thought. This starts with initial jobless claims, which since the end of July have been in a clear downtrend (signaling a reduced rate of firing). Additionally, JOLTS job openings unexpectedly rebounded back above the 8M level to 8.04M in August, rather than continuing their downtrend toward the 2019 average of 7.15M (increased labor demand). All culminating to a red-hot September 254k addition to Nonfarm payrolls, well above the expectation of 150k job added. Furthermore, the unemployment rate fell to 4.1%, down from August’s 4.2% and expectations for an unchanged print. The market reaction was a clear reset in how rapid the FOMC is going to cut rates going forward.