Flack Capital Markets | Ferrous Financial Insider
September 6, 2024 – Issue #448
September 6, 2024 – Issue #448
Overview:
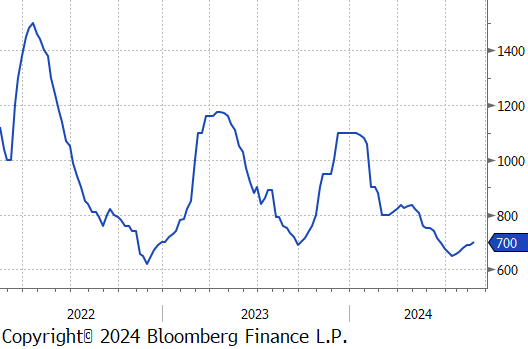
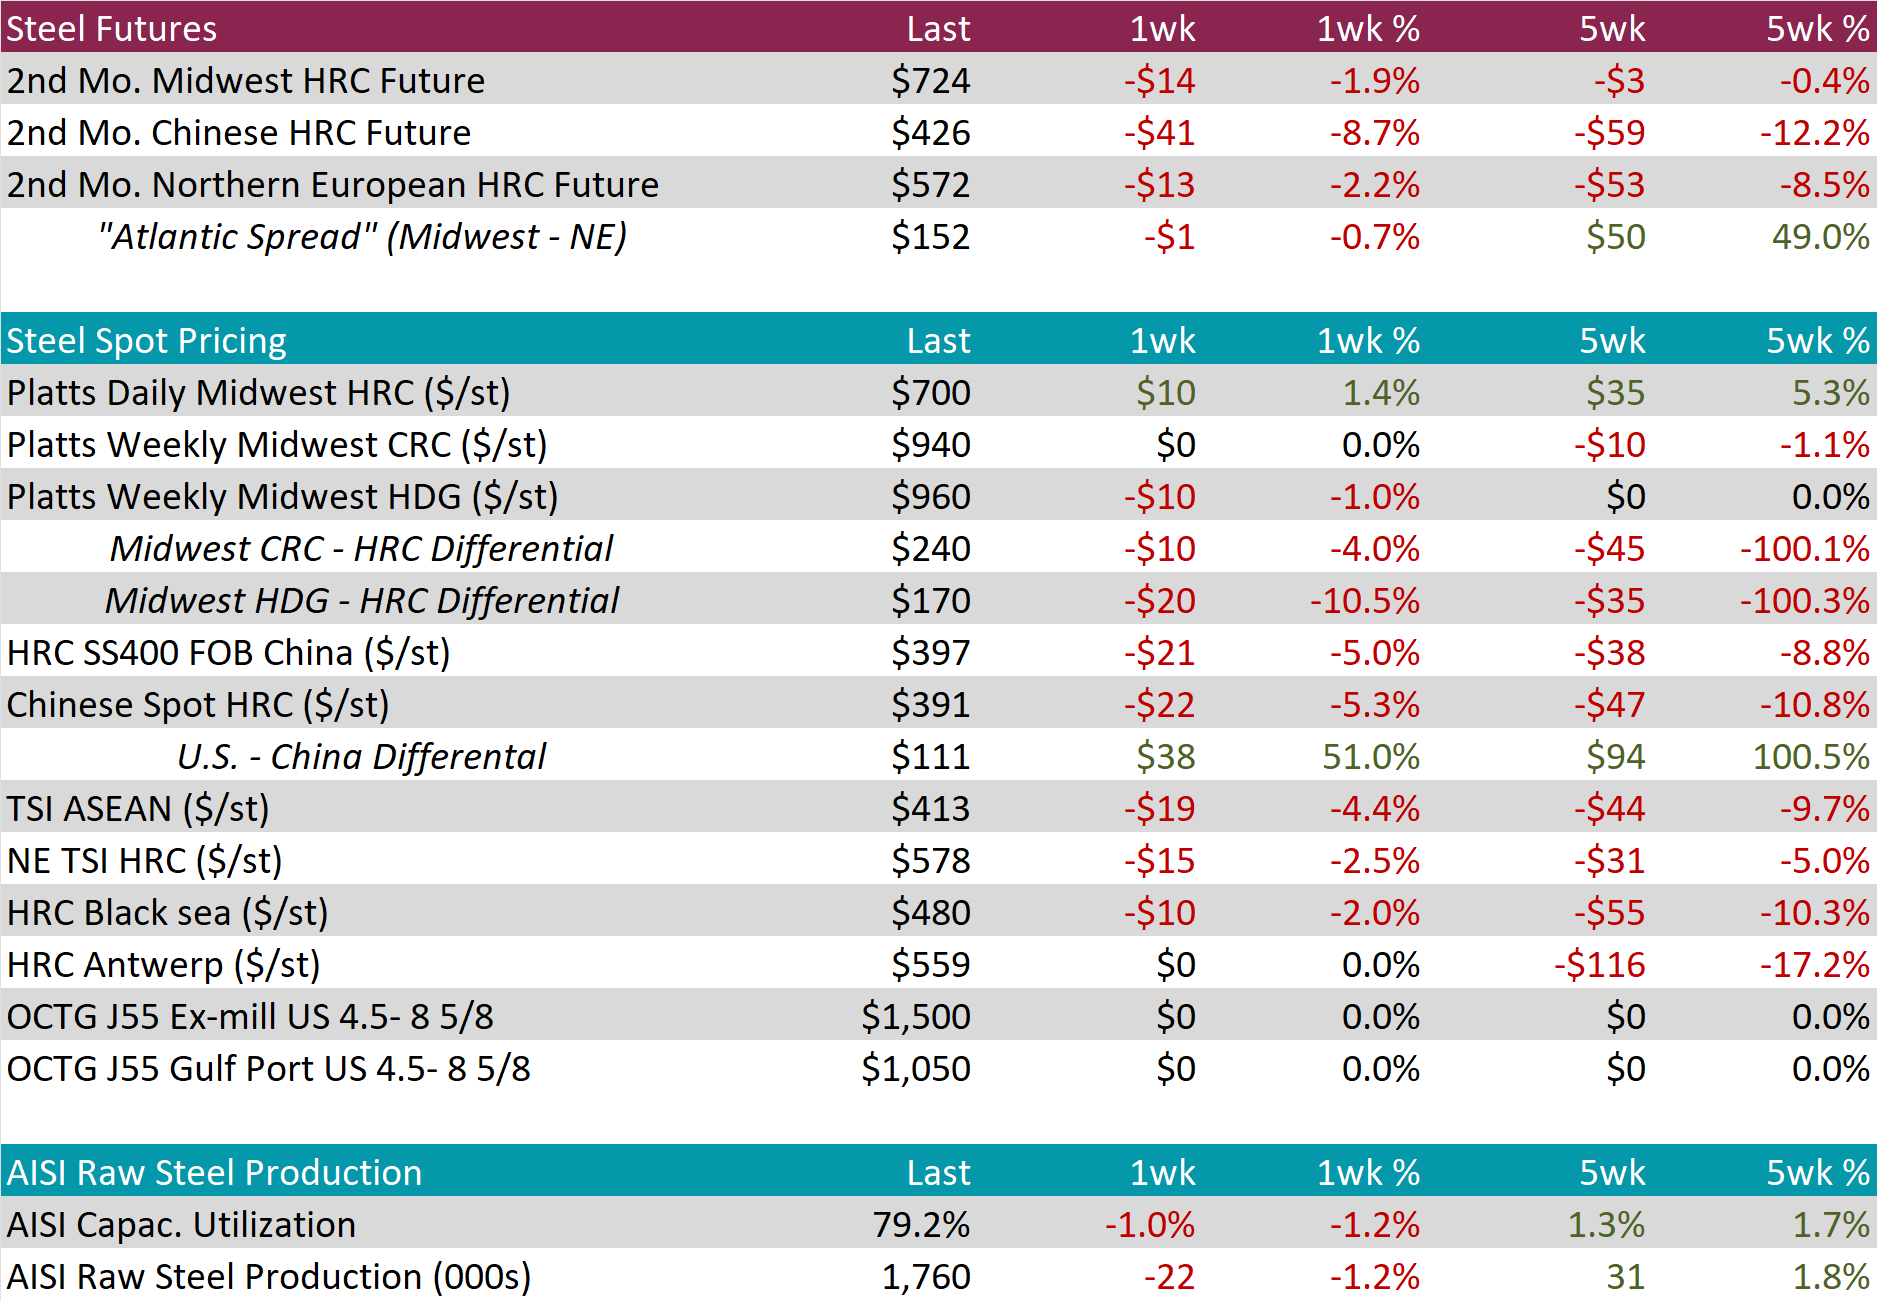
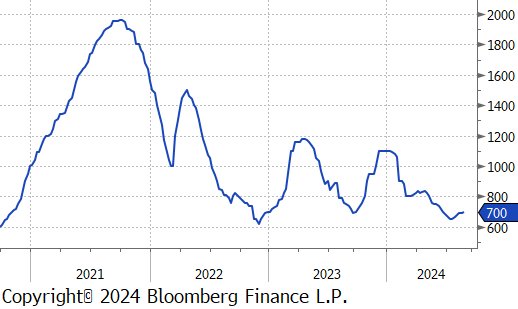
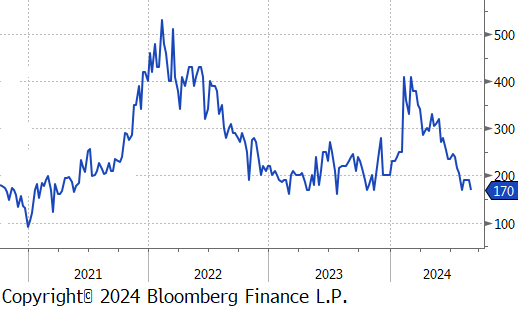
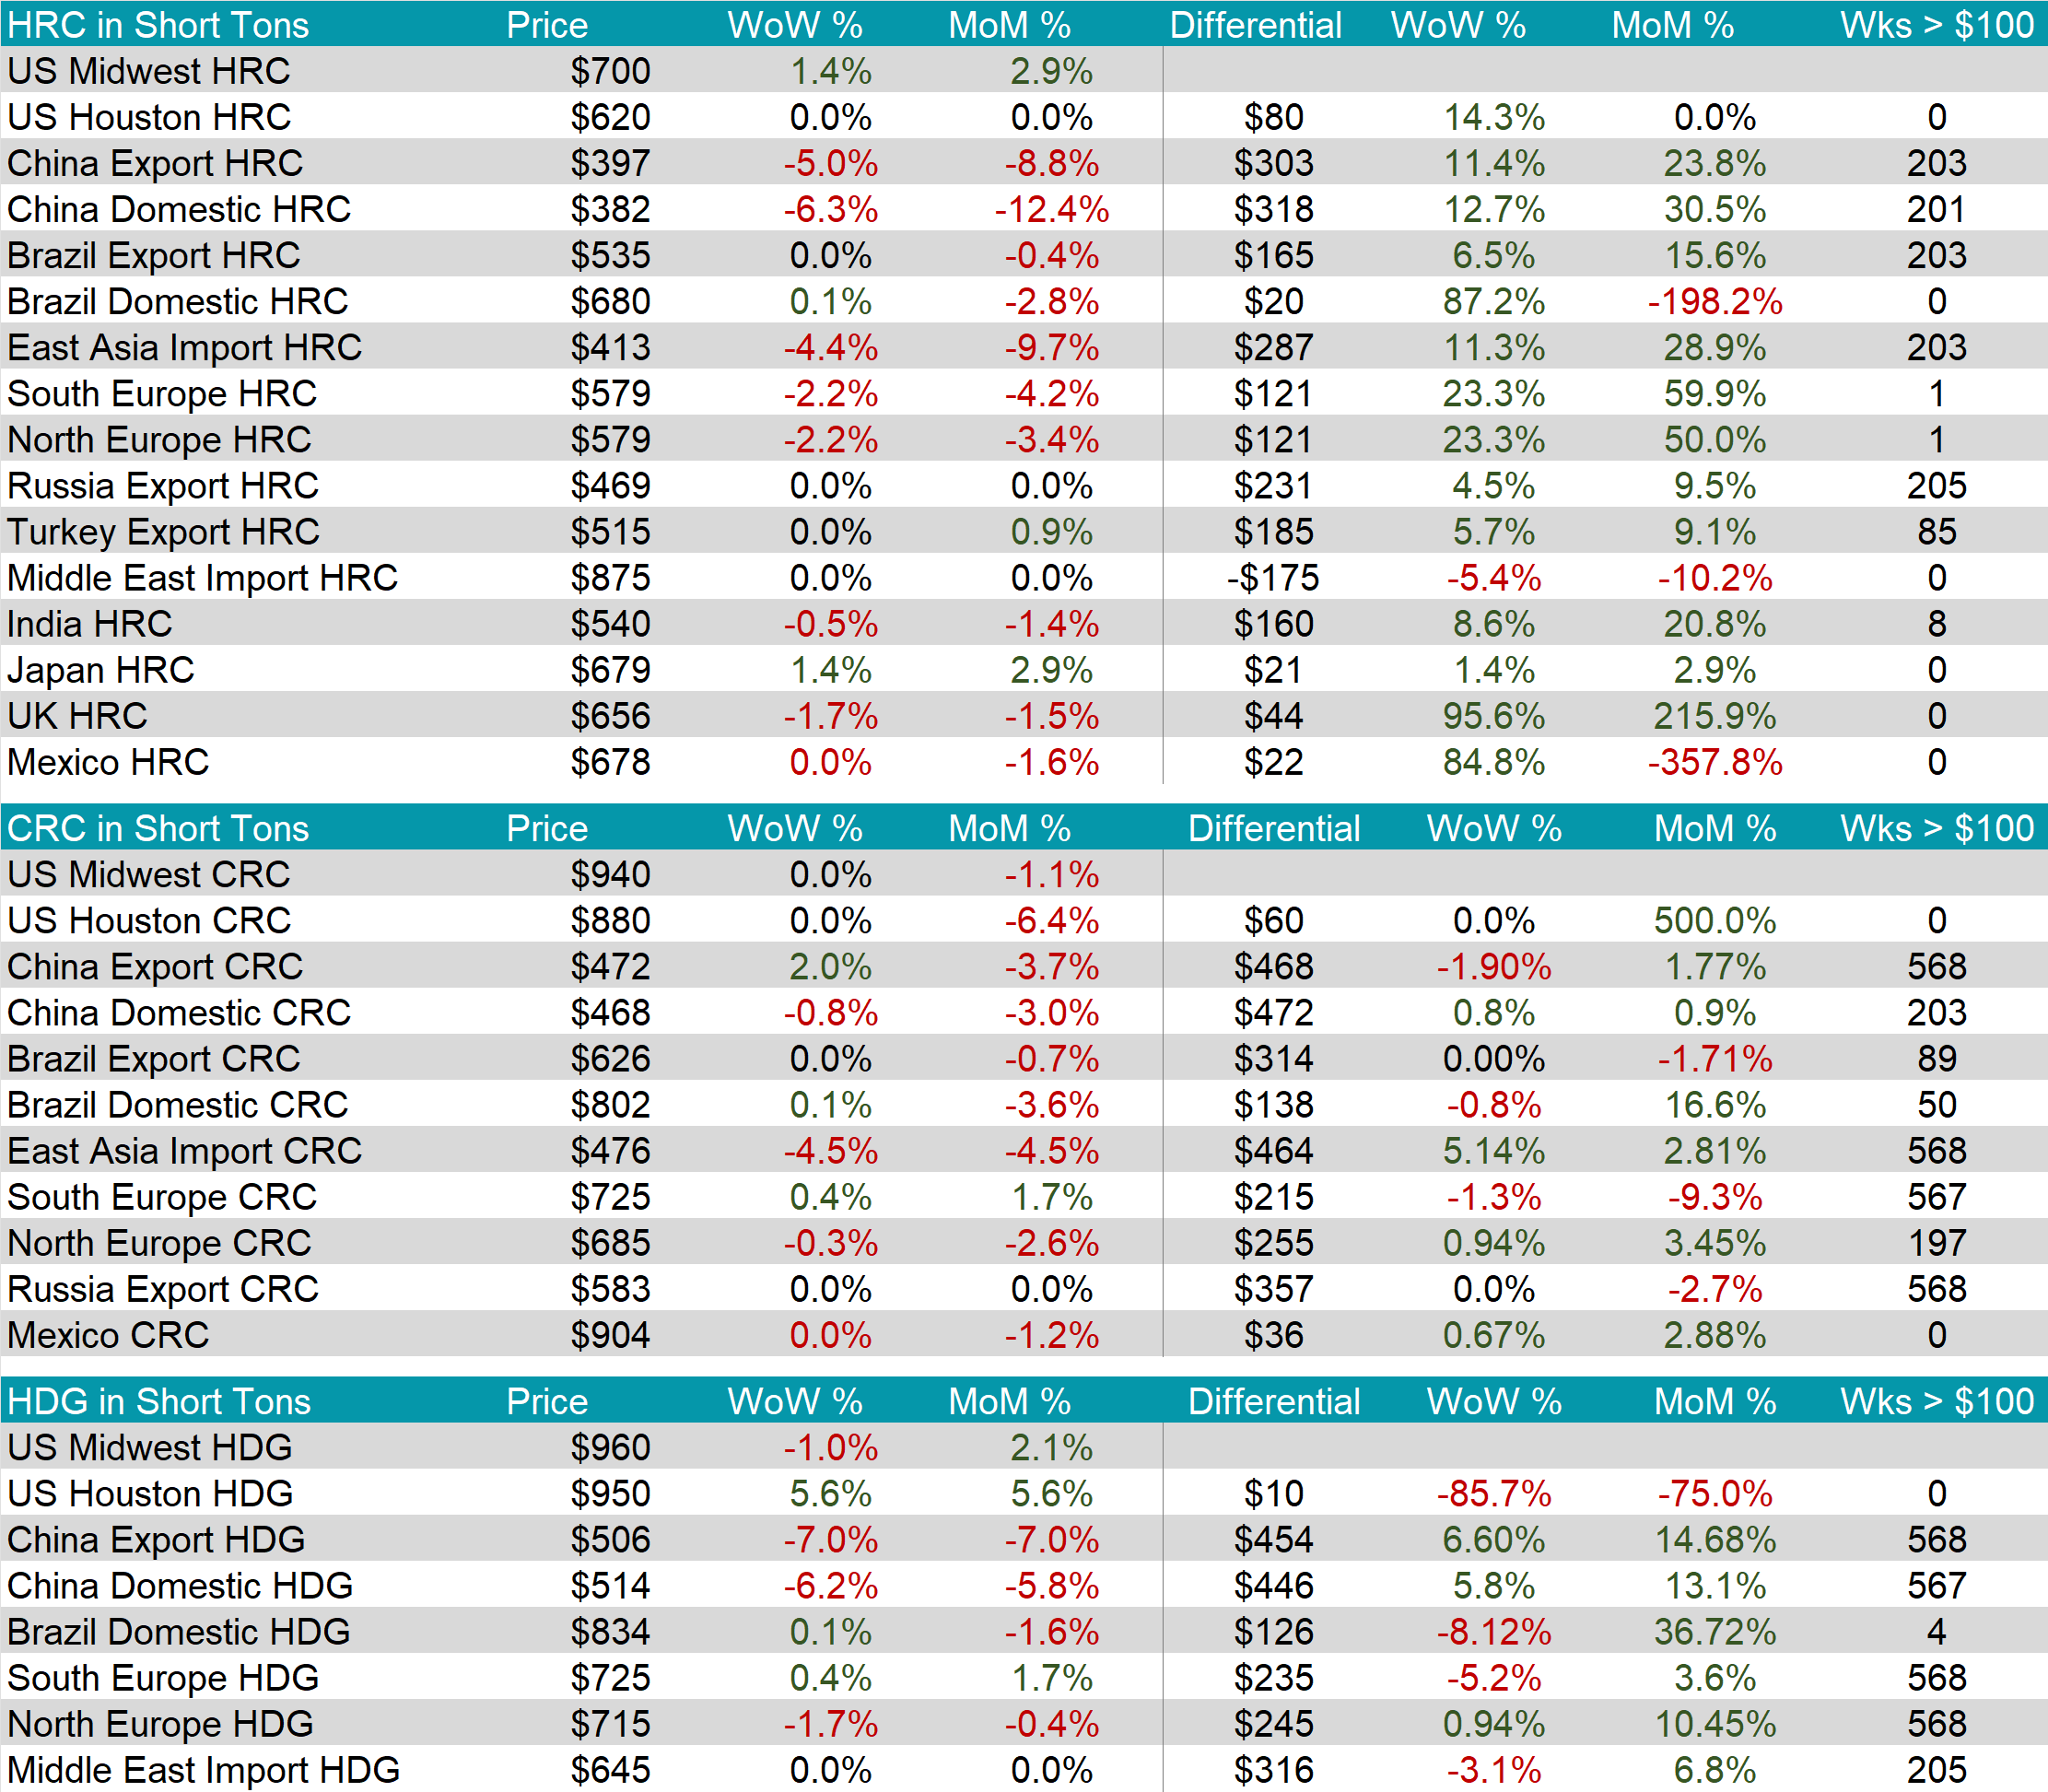
The HRC spot price increased by $10 or 1.4% to $700, breaking back into the $700 price level for the first time since mid-June. At the same time, the HRC 2nd month future fell by $14 or -1.9% to $724, declining for the first time in three weeks.
Tandem products were mixed, with CRC remaining unchanged whereas HDG dipped by $10, resulting in the HDG – HRC differential to decrease by $20 or -10.5% to $170.
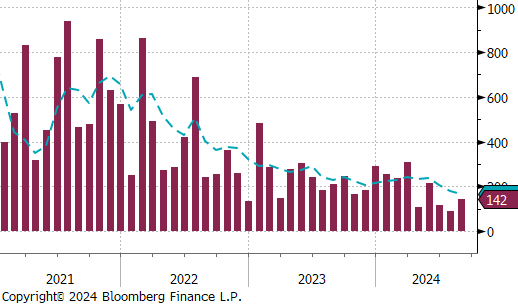
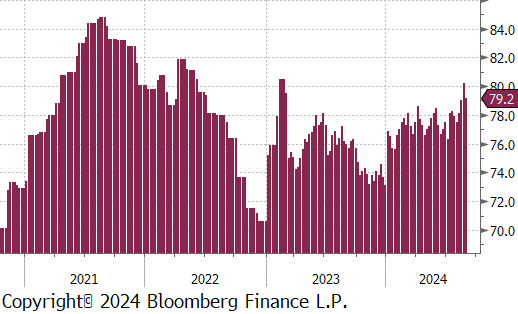
Mill production edged lower, but remains on the more elevated range, with capacity utilization ticking down by 1.0% to 79.2%, bringing raw steel production down to 1.760m net tons.
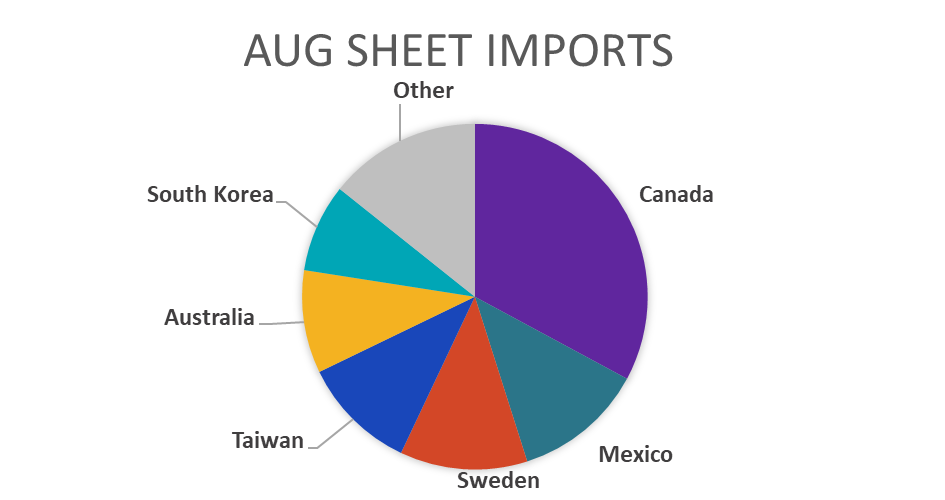
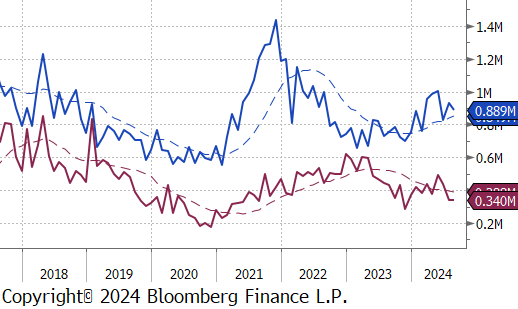
August Projection – Sheet 889k (down 41k MoM); Tube 340k (up 2k MoM)
July Census – Sheet 931k (up 105k MoM); Tube 337k (down 76k MoM)
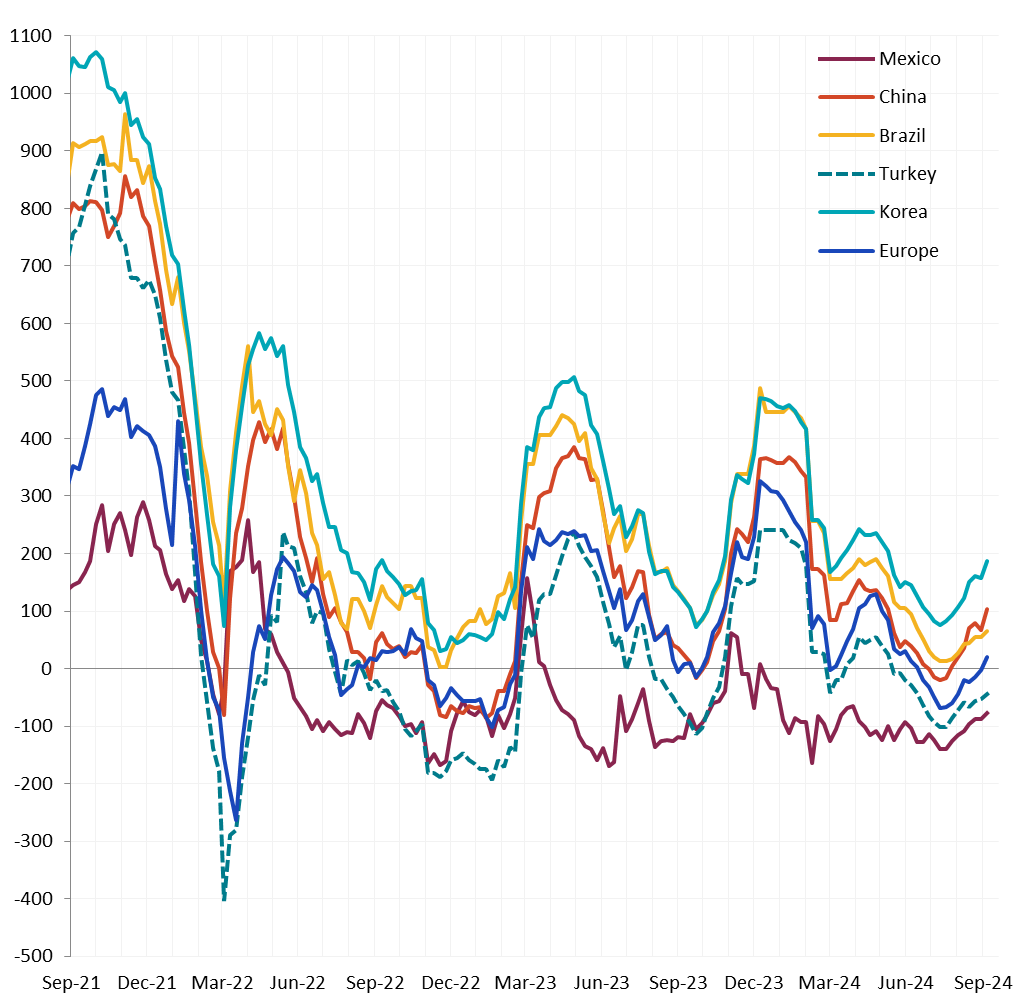
All watched global differentials expanded, with China Export HRC falling by -5.0%, Korea dropping by -4.4%, and North Europe HRC down by -2.2%.
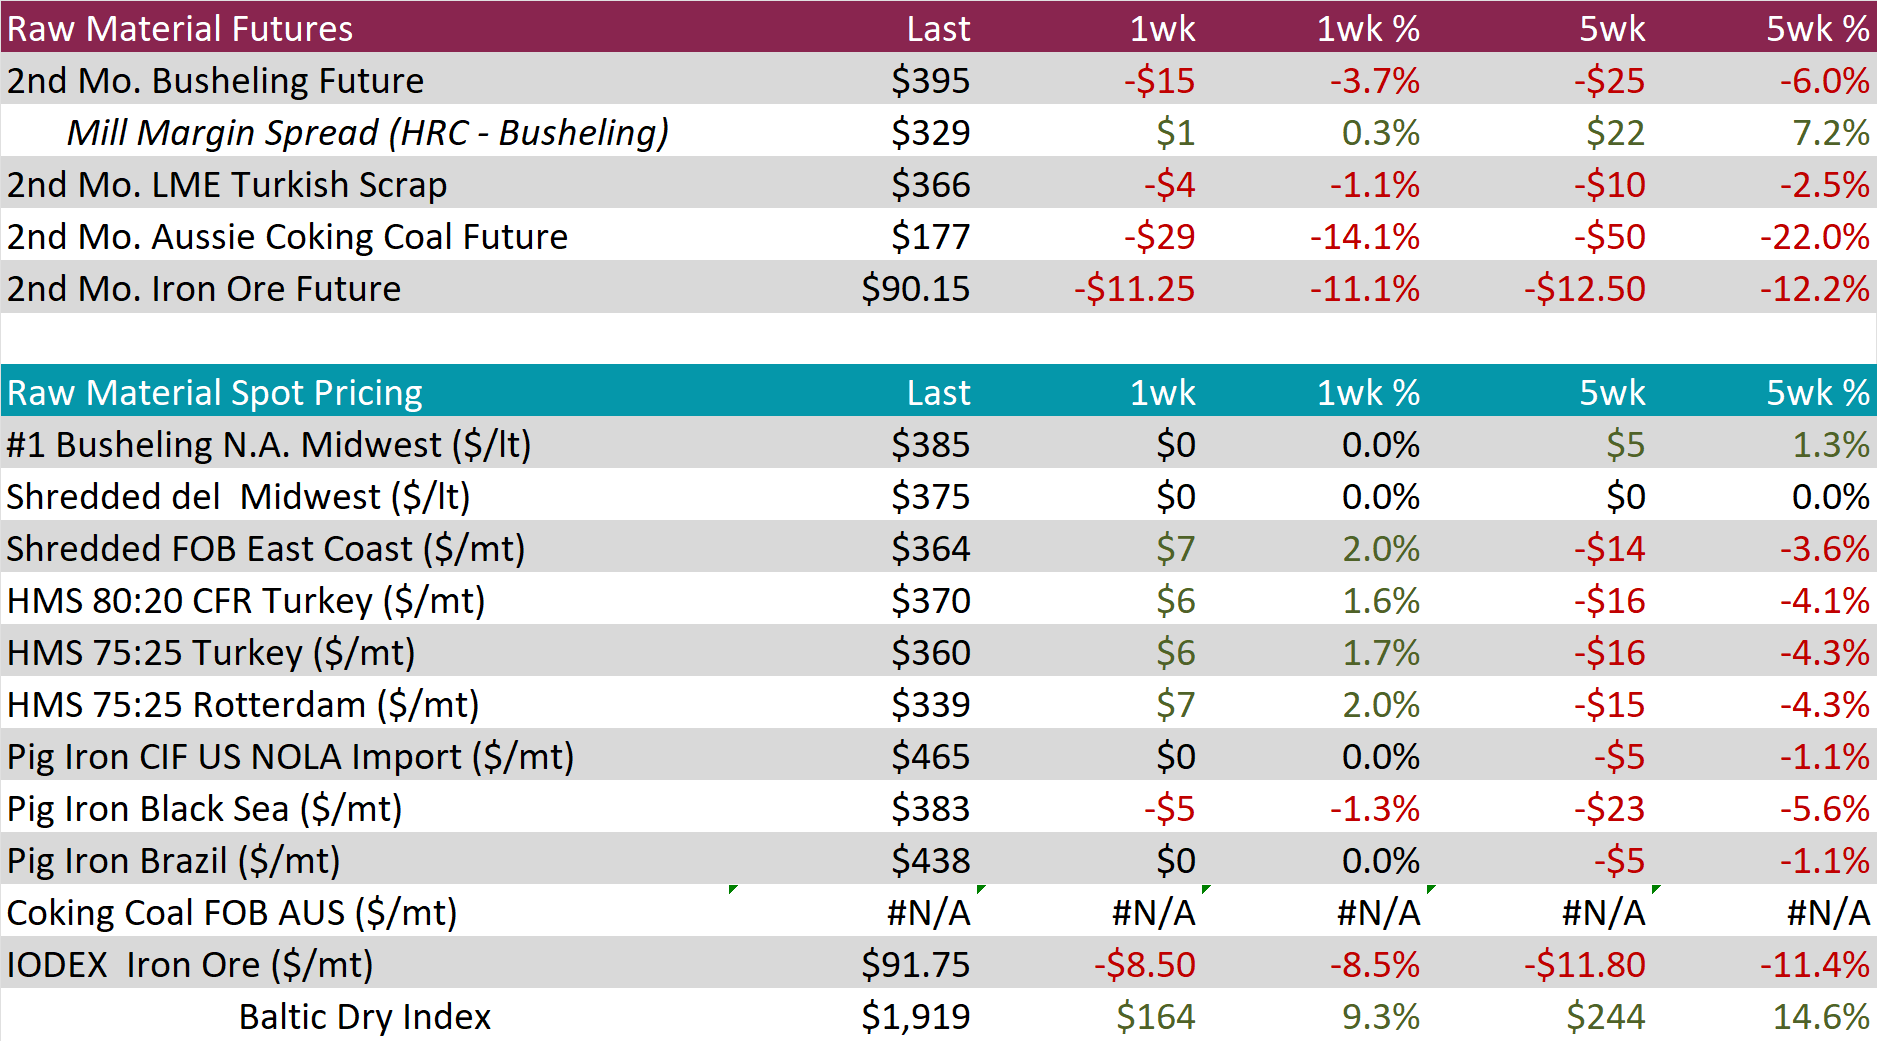
Scrap
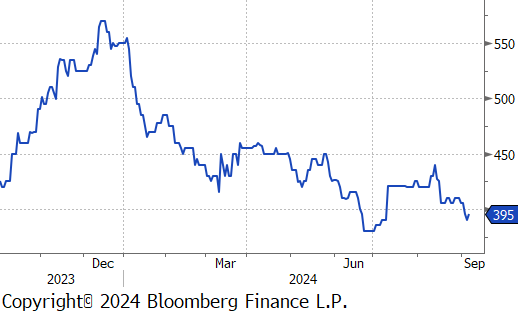
The 2nd month busheling future declined by $15 or -3.7% to $395, falling below the $400 price level for the first time since early July.
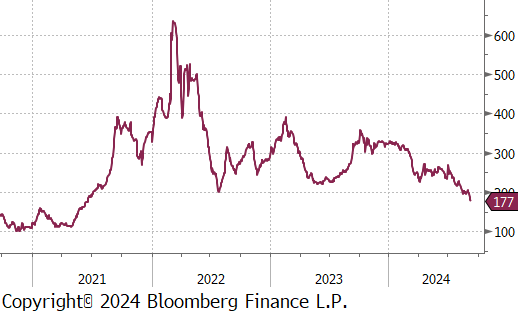
The Aussie coking coal 2nd month future dropped by $29 or -14.1% to $177, hitting the lowest level since June 2021.
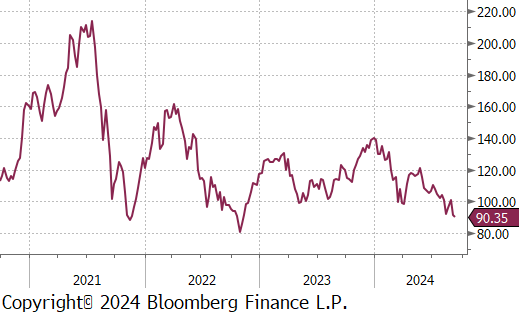
The iron ore 2nd month future decreased by $11.25 or -11.1% to $90.15, sinking to its lowest level since November 2022.
Dry Bulk / Freight
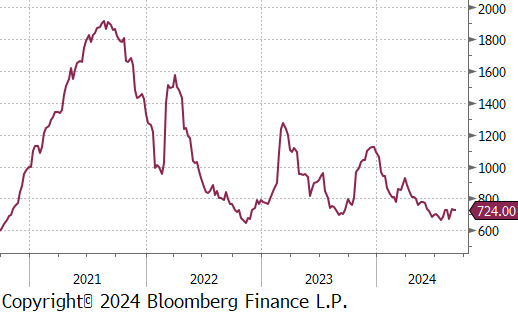
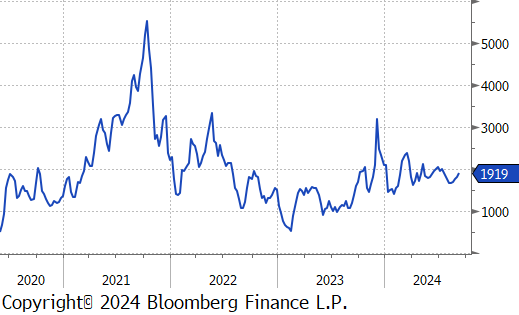
The Baltic Dry Index climbed by $164 or 9.3% to $1,919, rebounding to its highest level since July.
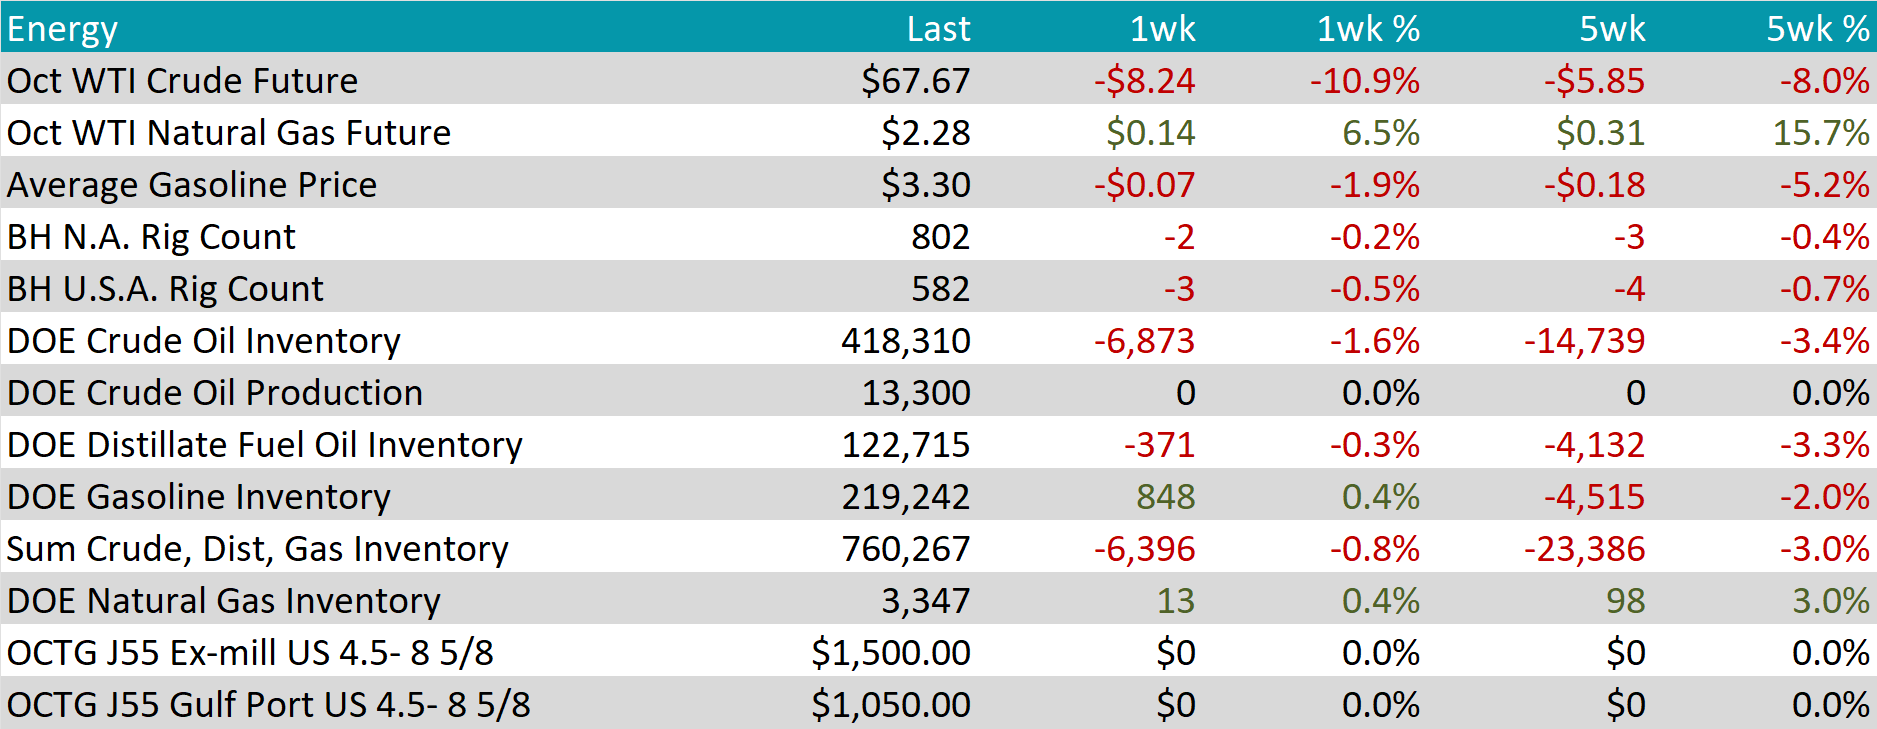
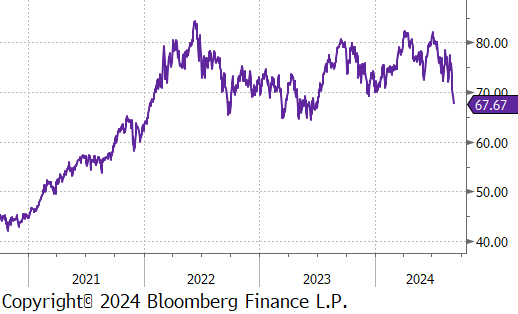
WTI crude oil future lost $8.24 or -10.9% to $67.67/bbl.
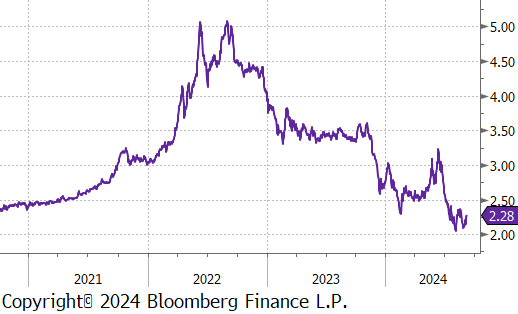
WTI natural gas future gained $0.14 or 6.5% to $2.28/bbl.
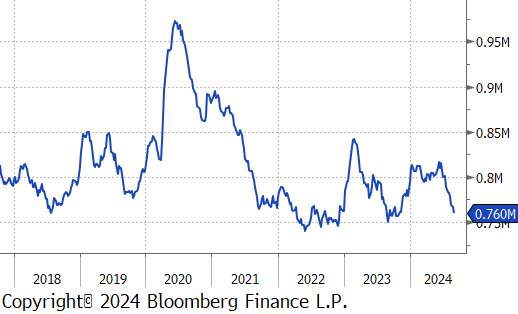
The aggregate inventory level continued to decline, this time falling by -0.8%, marking the seventh consecutive week of decreases.
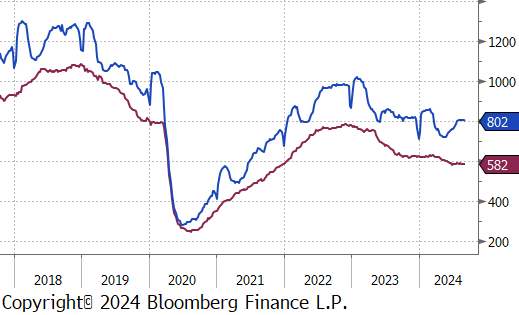
The Baker Hughes North American rig count reduced by 2 rigs, bringing the total count down to 802 rigs. Similarly, the US rig count also declined, reducing by 3 rigs, bringing the total count down to 582 rigs.
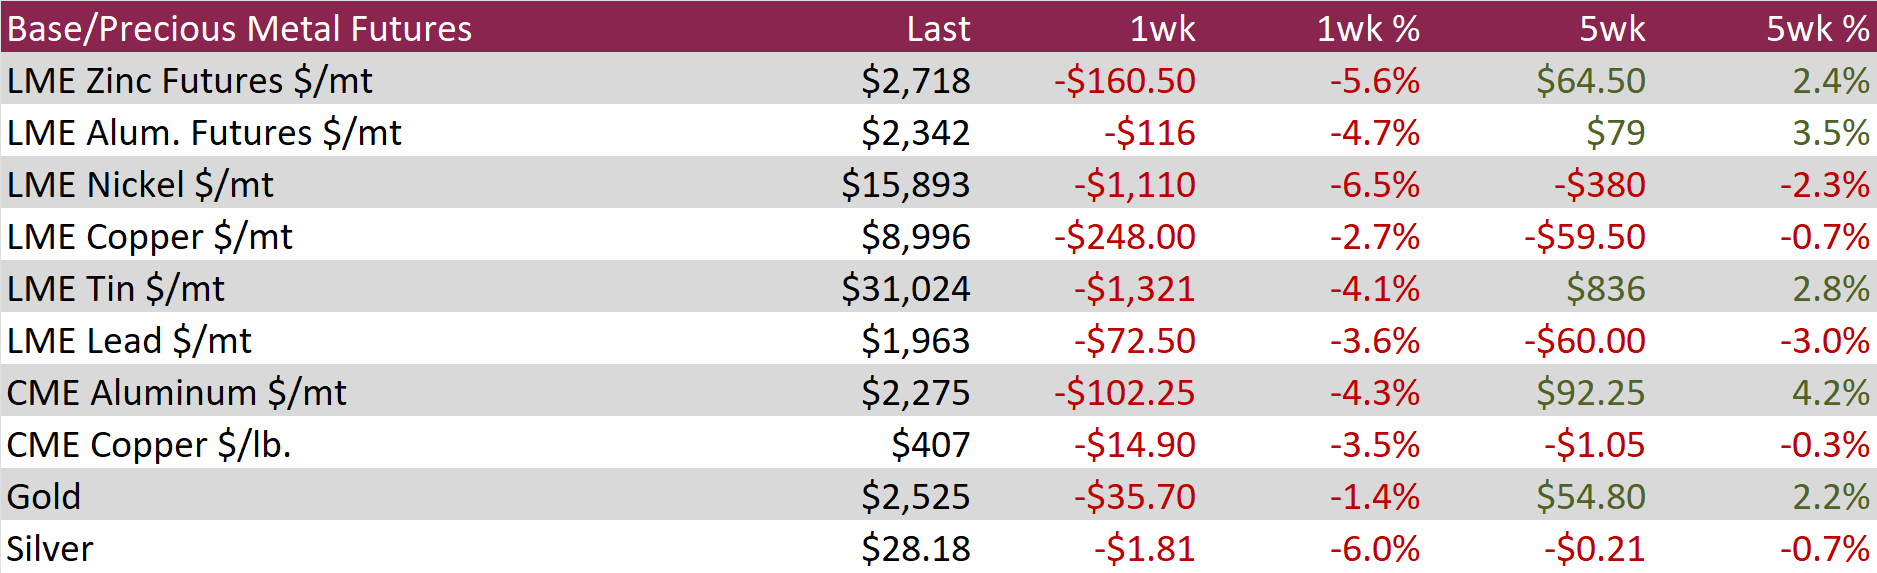
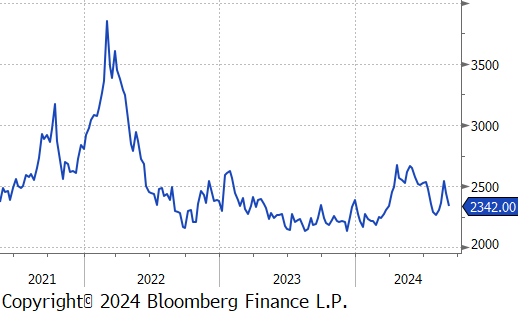
Aluminum futures dropped by $116 or -4.7% to $2,342, continuing their descent from the two-month high of $2,550 reached on August 27th. This decline is part of a broader weakness in base metals, driven largely by decreasing demand in China. The downturn was underscored by China’s official manufacturing PMI, which unexpectedly fell to 49.1 in August, indicating the most significant contraction in factory activity this year and further weakening the demand outlook. Additionally, Beijing’s reluctance to provide fiscal support to traditional manufacturing sectors, opting instead to invest in emerging technologies, has contributed to the negative market sentiment. Concurrently, an increase in aluminum supply in China—boosted by improved rainfall in Yunnan enhancing hydroelectric power availability—has placed additional downward pressure on prices.
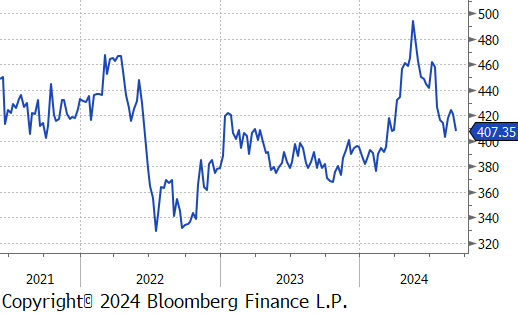
Copper futures fell by $14.90 or -3.5% to $407. This downturn was triggered by disappointing U.S. manufacturing and labor market data, which reignited fears of a recession. Such fears tend to dampen the demand outlook for industrial materials like copper. Adding to the negative sentiment, analysts noted declining demand in China, the world’s largest consumer of commodities. The Australian mining giant BHP Group has recently lowered its forecast for China’s copper demand, citing concerns about the country’s economic recovery. On a more positive note, expectations that the US Federal Reserve might begin cutting interest rates this month have offered some support to commodity prices. Market participants are now focused on upcoming US inflation data, which could determine the magnitude of the Fed’s anticipated rate cut.
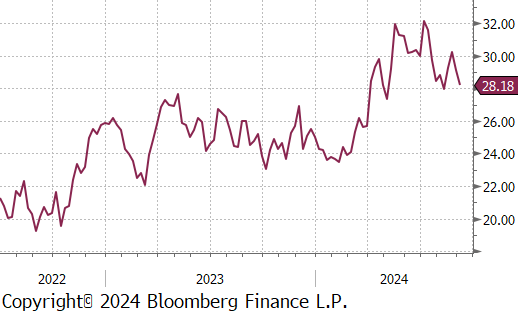
Silver edged down by $1.81 or -6.0% to $28.18, pulling back from a near one-week high amid uncertainty about the extent of the Federal Reserve’s upcoming interest rate cuts, following disappointing US labor market data. The Labor Department’s report showed a weaker-than-expected addition of 142k non-farm payrolls in August, with a downward revision for July’s figures to 89k. The unemployment rate met expectations at 4.2%, slightly down from the previous month. The market is currently debating whether the Fed will opt for a 25 or 50 basis point cut at its September 18 meeting, with the consensus tilting towards a 25-basis-point reduction. Fed Governor Christopher Waller and New York Fed President John Williams have expressed support for rate cuts to stabilize the job market. However, the looming prospect of a US recession and ongoing economic uncertainties in China, a major consumer, continue to exert pressure on commodity markets.
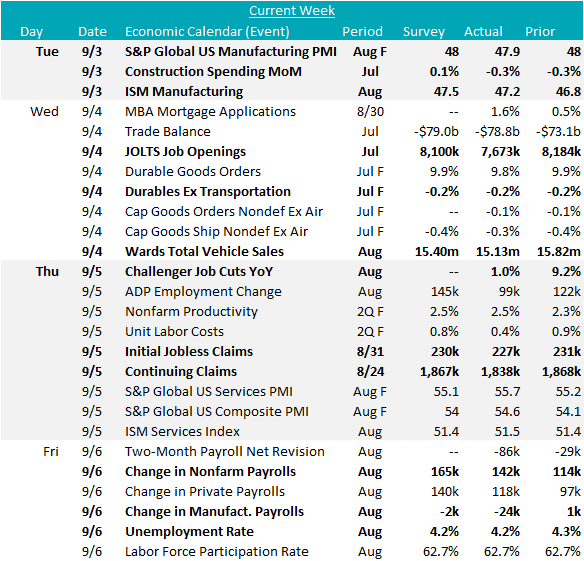
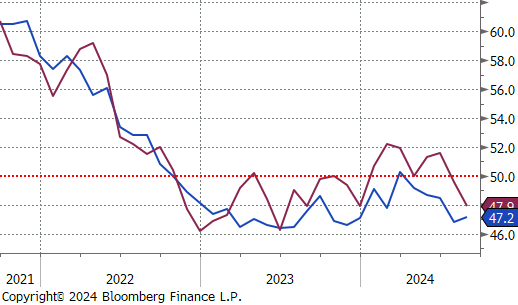
The August ISM Manufacturing PMI rose to 47.2, from 46.8 but came in below expectations of a 47.5 print. This is the 21st of the last 22 readings where the ISM Manufacturing PMI has been in contractionary territory. Additionally, the final S&P Global Manufacturing PMI ticked down to 47.9, from a preliminary estimate at 48, the second month of contraction.
Construction Spending came in below expectations as well, with total spending down -0.3% in July, versus expectations of a slightly increase of 0.1%. The main driver this month was a -0.4% MoM change in Private Non-residential Spending.
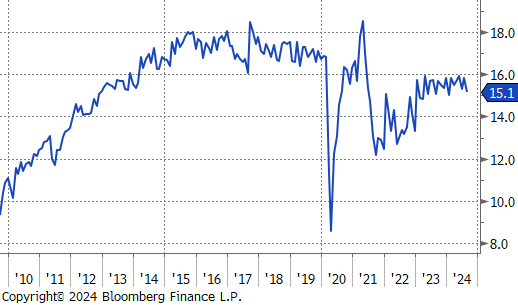
Auto Sales (SAAR), came in at a 15.1M in August, below the expectation of 15.4M. Ongoing affordability issues continue to stand in the way of the sector pushing back up to pre-pandemic levels.
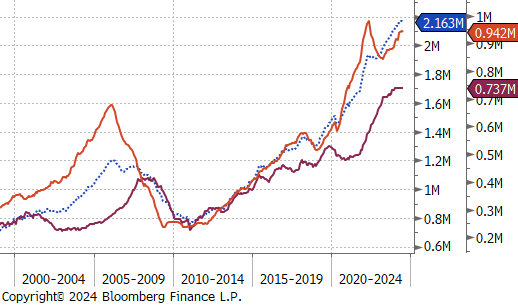
Labor market data from earlier in the week, broadly came in below expectations with JOLTS Job Openings coming in at 7.67M, below expectations of a moderate decline to 8.1M. Furthermore, Challenger YoY Job Cuts provided a benign signal of a 1% increase. Taking a step back, the underlying data show that this month was the worst for layoffs in the last 5 and the YoY figure looks subdued simply because August 2023 saw such a significant surge.
Friday’s jobs data did not provide conclusive evidence in either direction for whether the upcoming September interest rate cut should be 25bps or 50. Nonfarm Payrolls printed up to 142k but came in below expectations of 165k and prior two-month revisions pulled last months negative surprise even lower, from 114k to 89k. That said, it is important to remember that the labor market cooling is by design to stamp out inflation and the 6-month moving average remains at 142k, which is historically elevated. On the other hand, the Unemployment Rate ticked lower to 4.2% from 4.3%.