Flack Capital Markets | Ferrous Financial Insider
September 20, 2024 – Issue #450
September 20, 2024 – Issue #450
Overview:
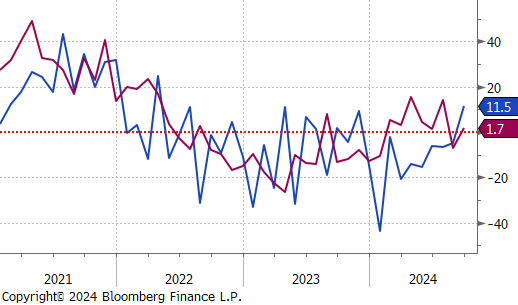
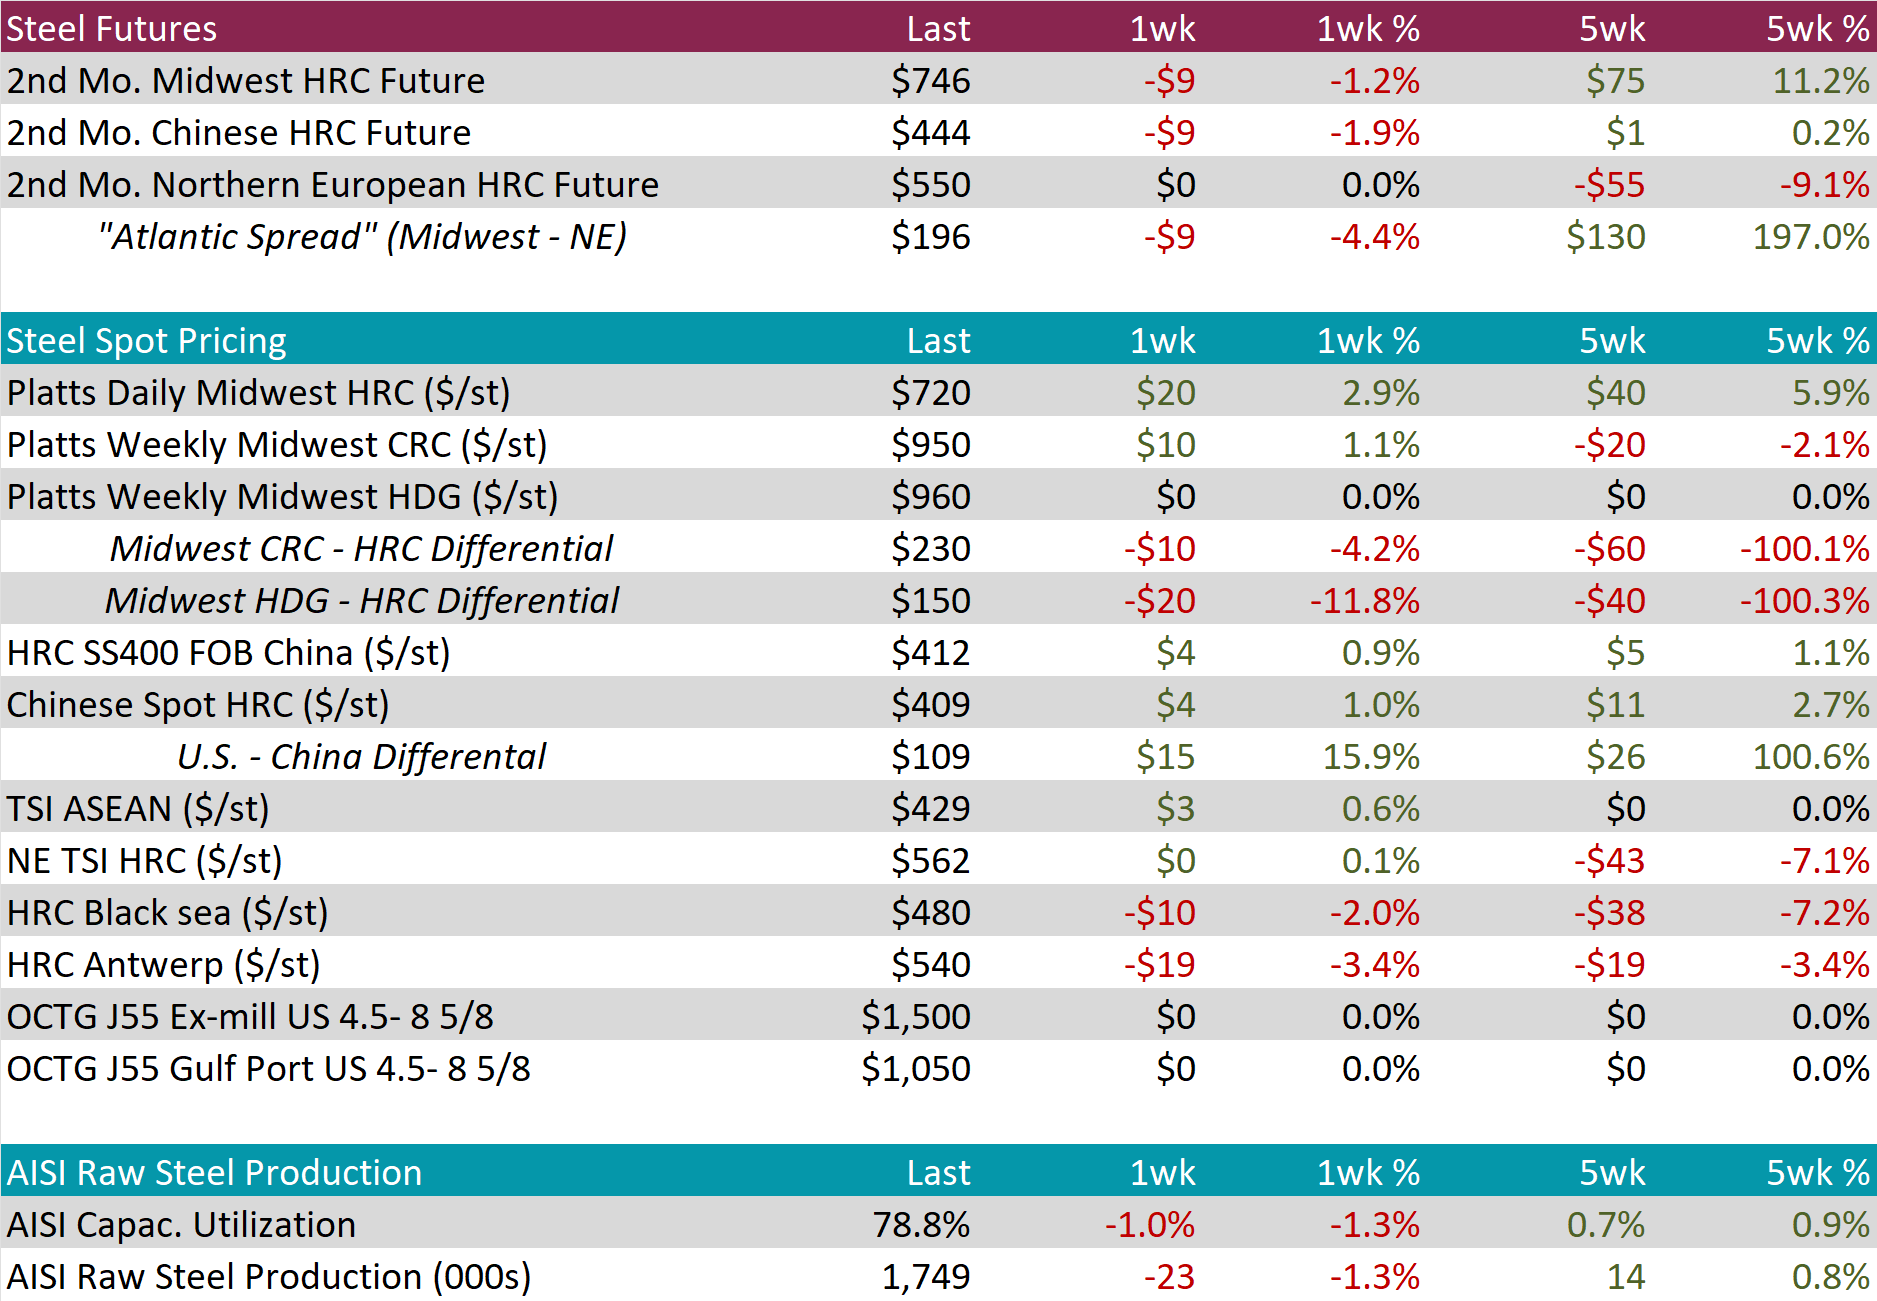
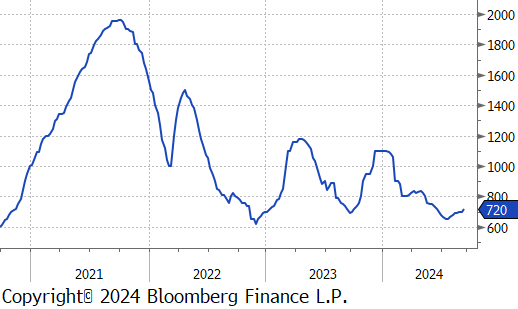
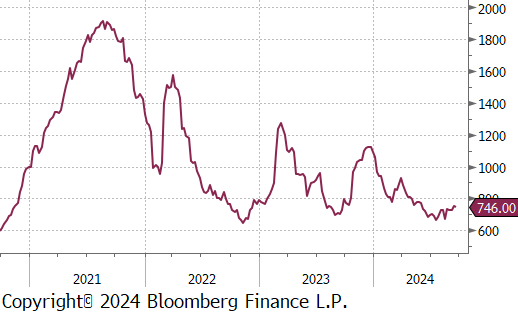
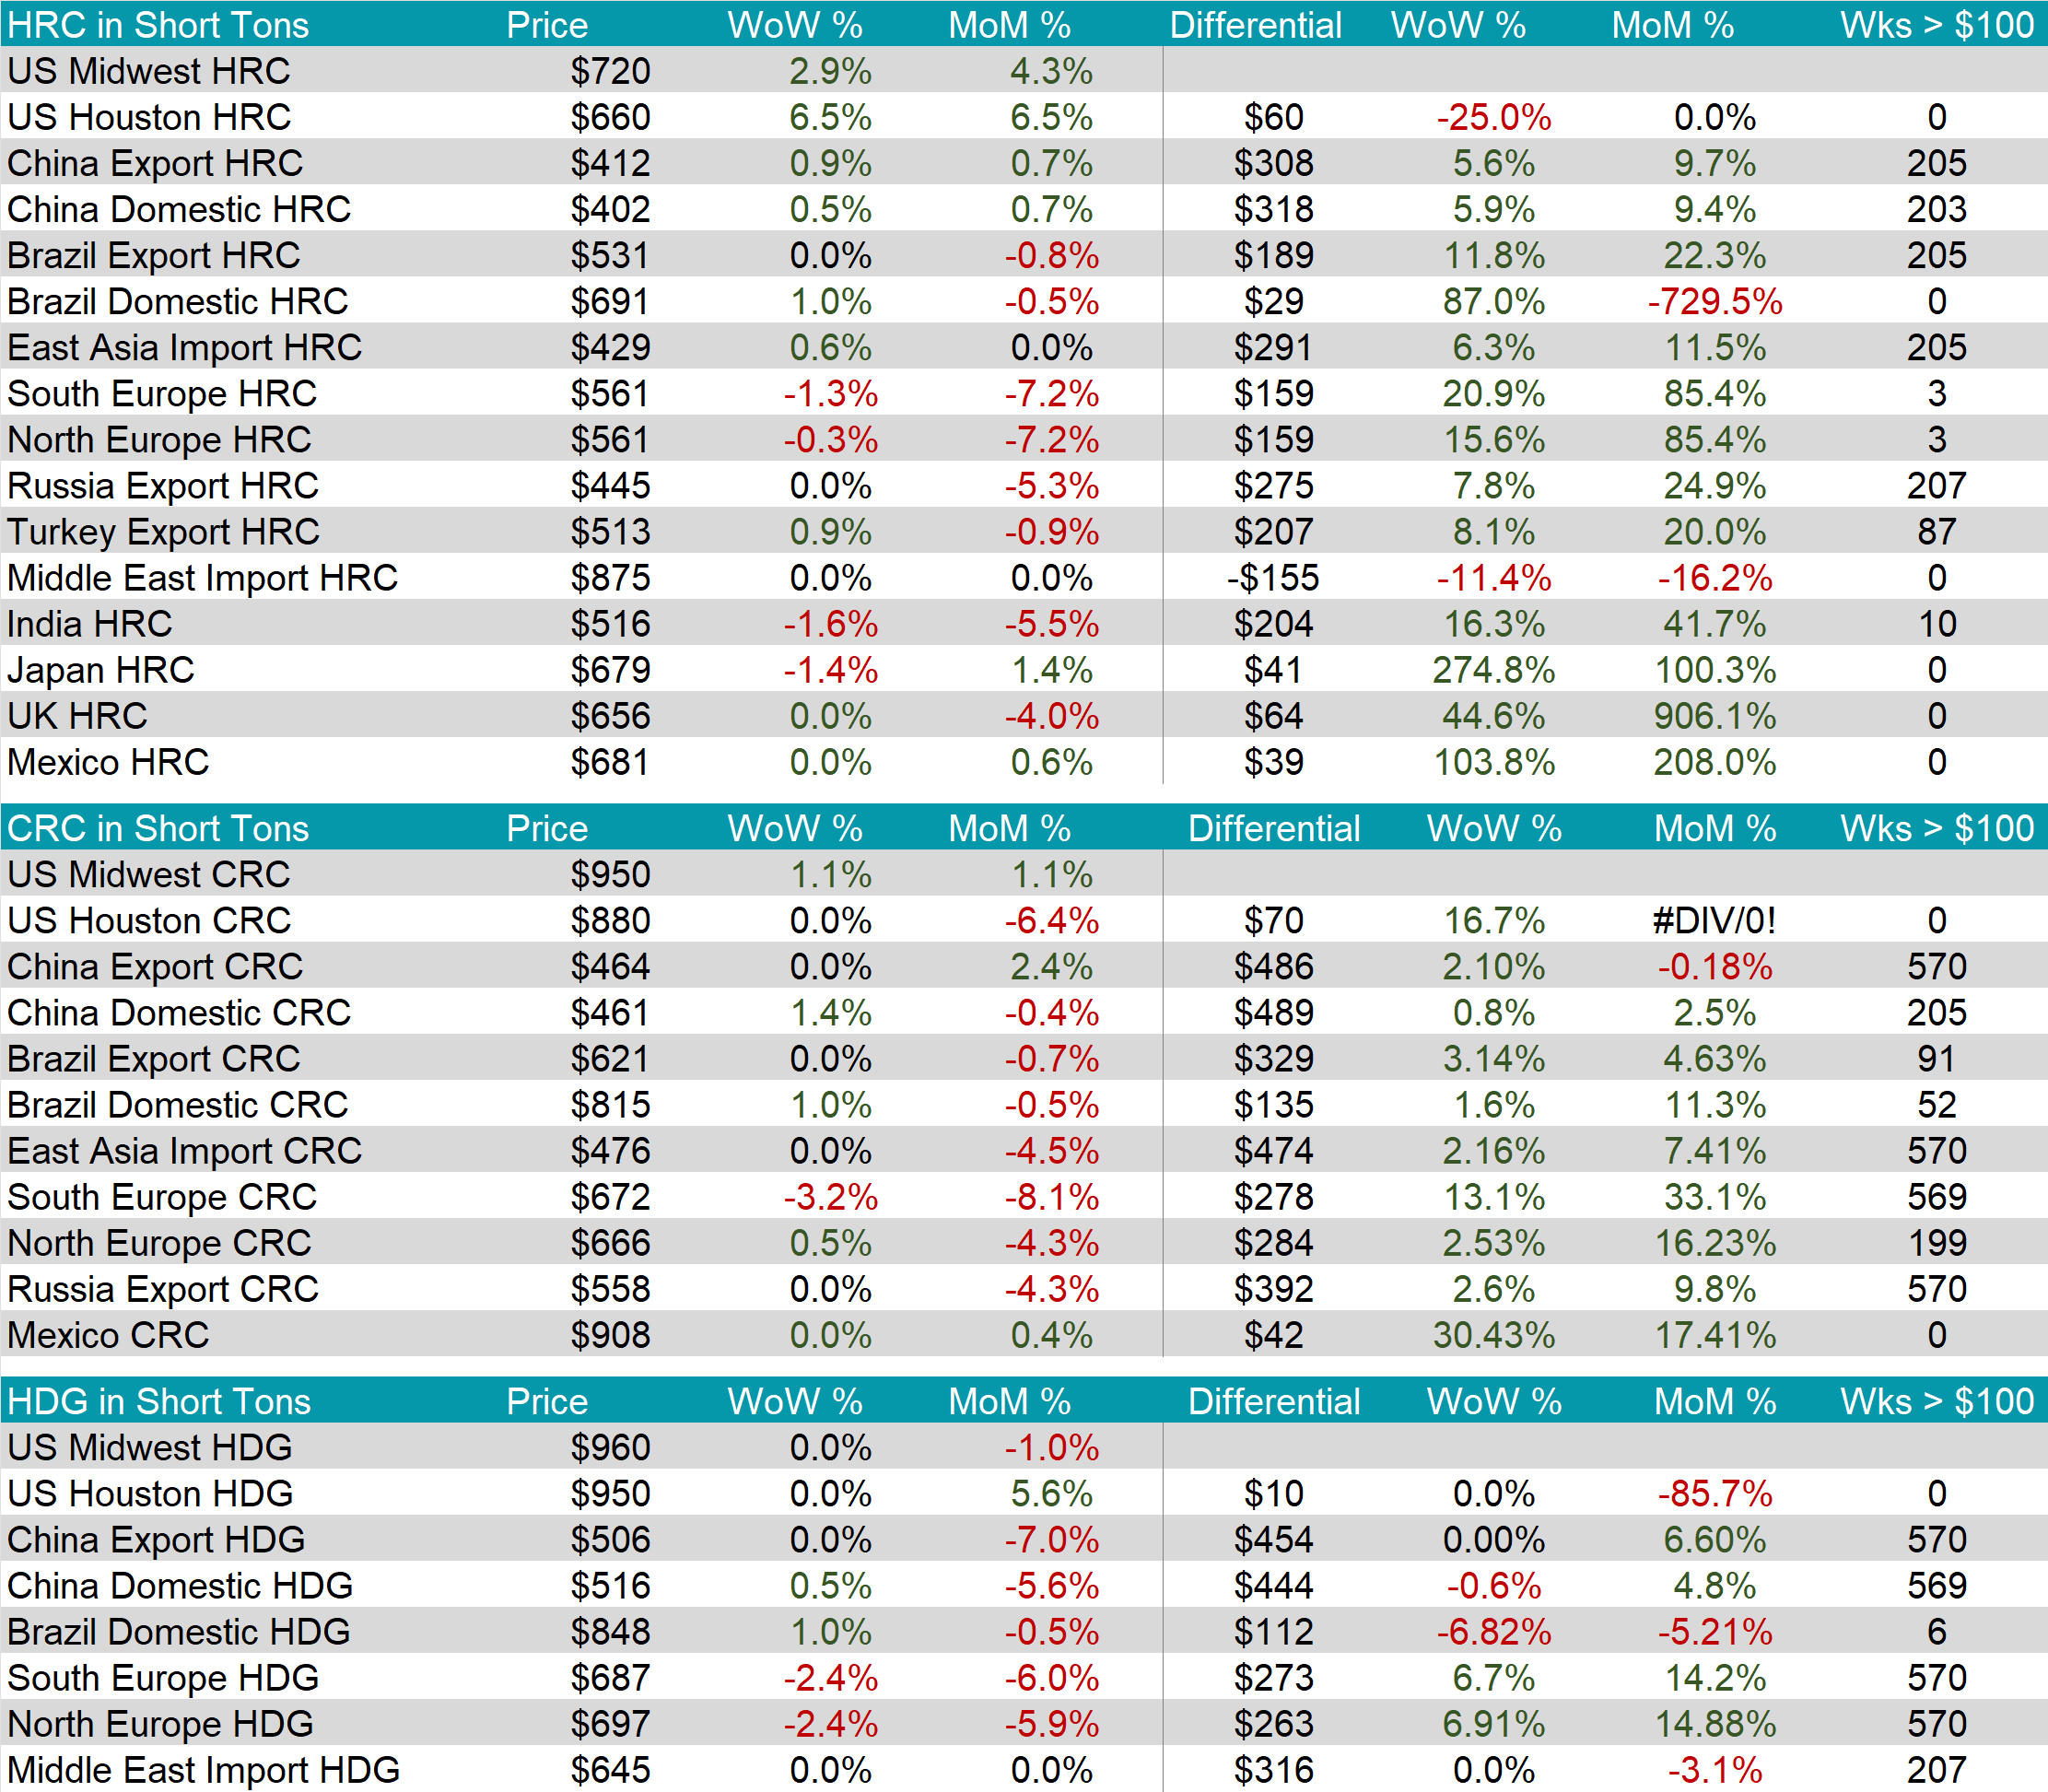
The HRC spot price rose by $20 or 2.9% to $720, reaching the highest price since June. At the same time, the HRC 2nd month future fell by $9 or -1.2% to $746.
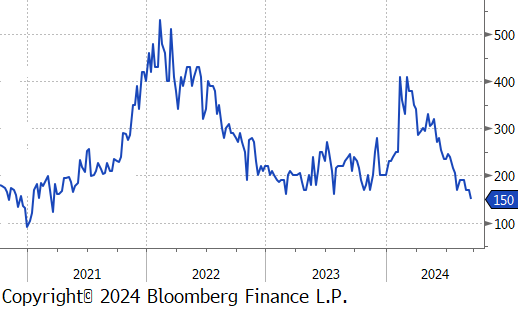
Tandem products were mixed, with CRC inching up by $10 to $950 and HDG remaining unchanged, resulting in the HDG – HRC differential to drop by $20 to $150.
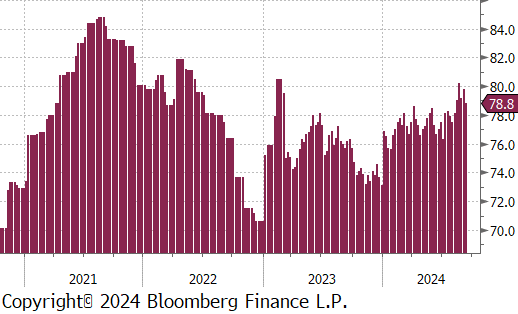
Mill production pulled back, with capacity utilization ticking down by 1.0% to 78.8%, bringing raw steel production down to 1.749m net tons – continuing to remain above the long run average.
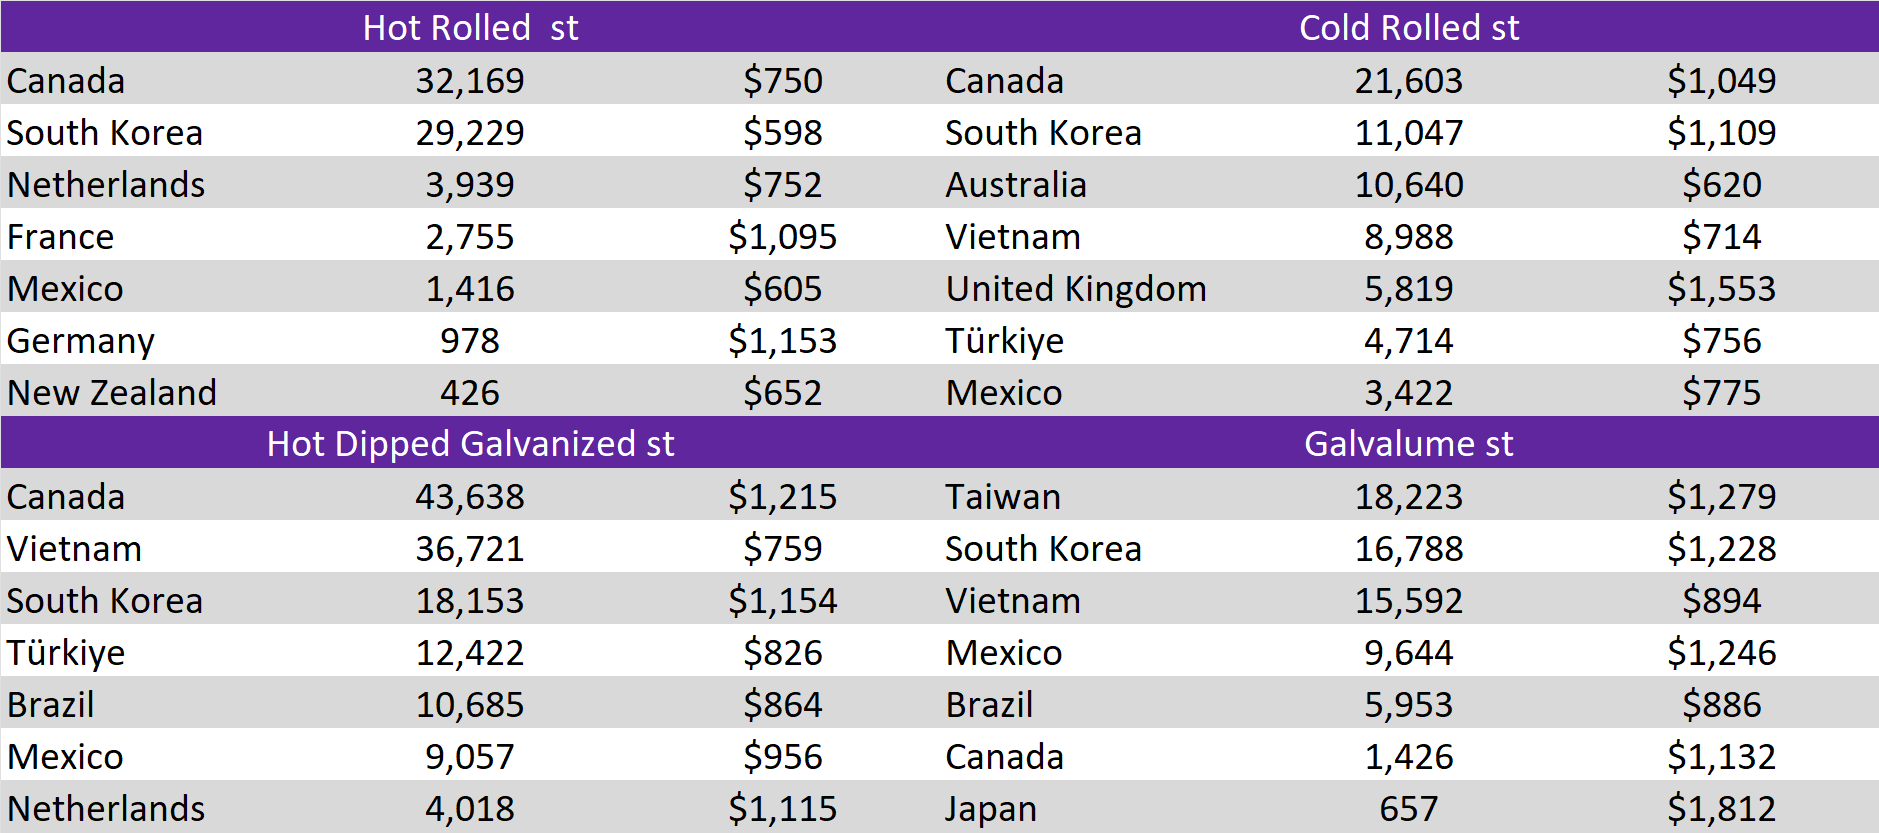
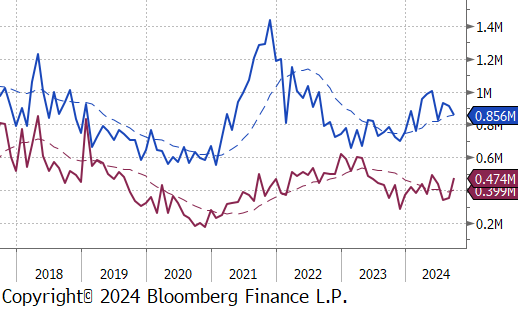
September Projection – Sheet 856k (down 53k MoM); Tube 474k (up 121k MoM)
August Projection – Sheet 909k (down 21k MoM); Tube 353k (up 15k MoM)
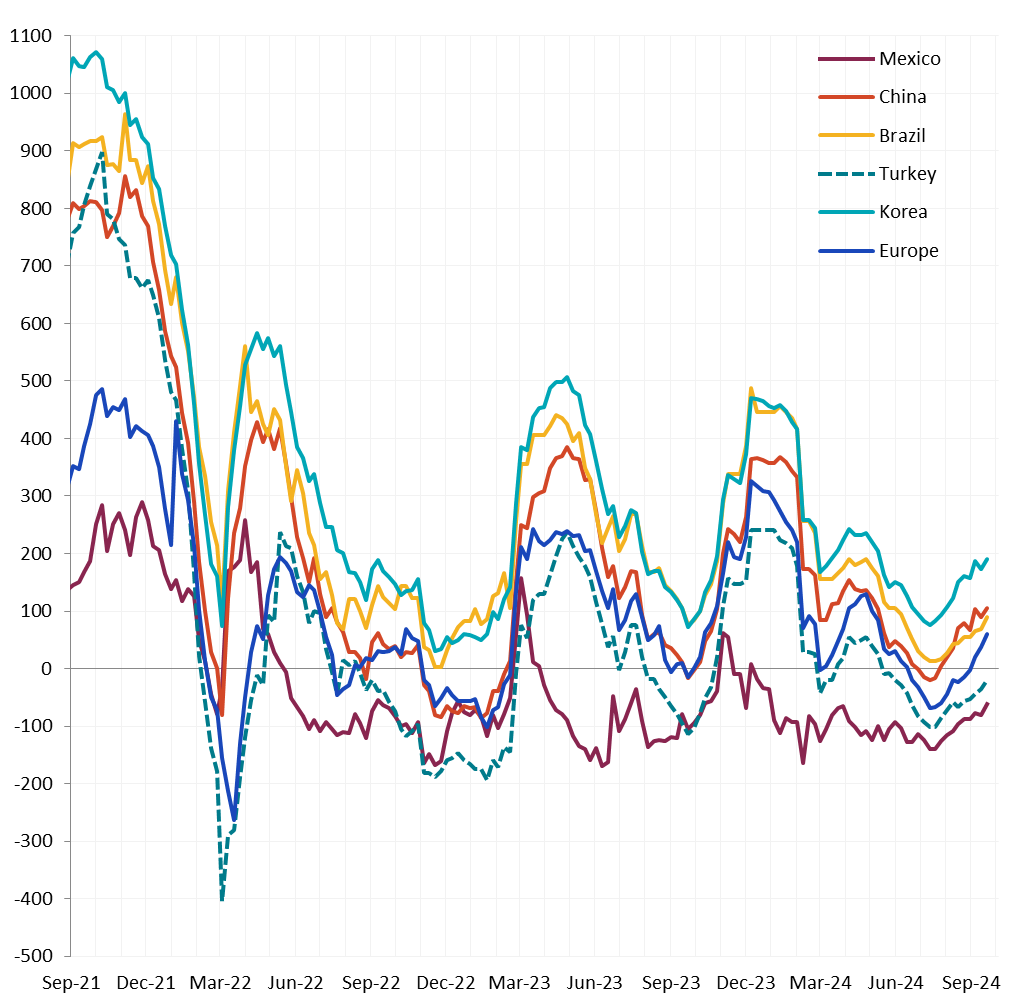
All watched global differentials expanded this week. Main movers this week were both China’s and Turkey’s export HRC prices rising by 0.9%, while North Europe’s HRC fell by -0.3%.
Scrap
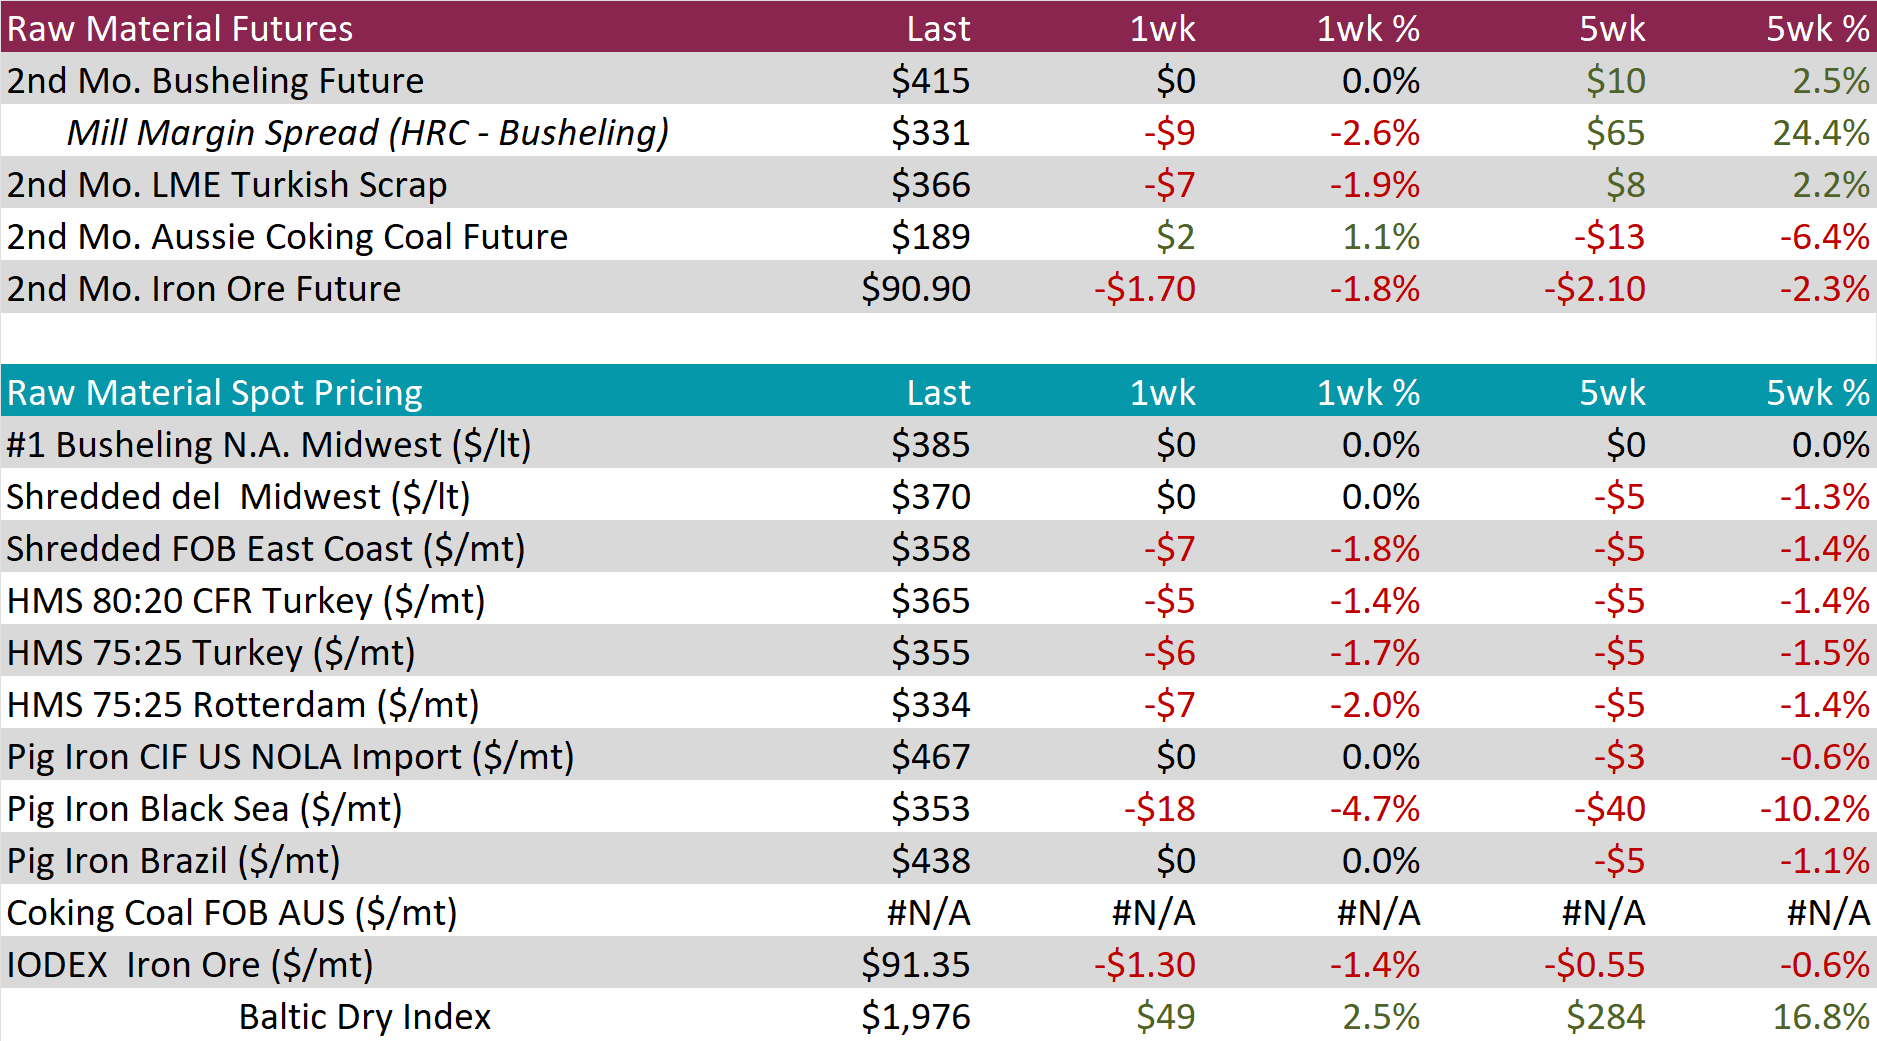
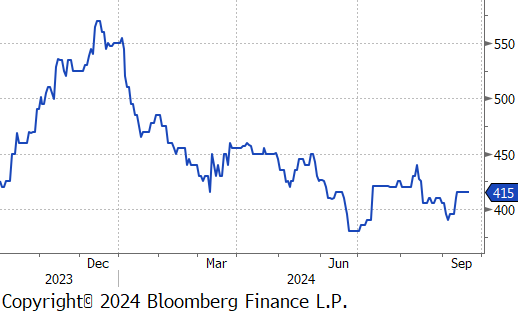
The busheling 2nd month future remained unchanged at $415, resulting in the 5-week price change to be up by $10 or 2.5%.
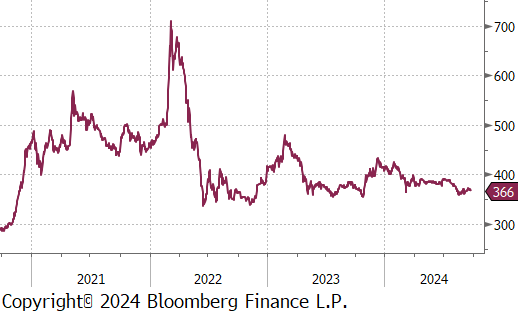
The LME Turkish scrap 2nd month future fell by $7 or -1.9% to $366, reversing last weeks gains.
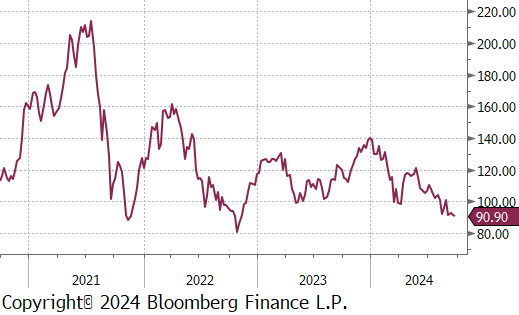
The iron ore 2nd month future edged lower by $1.70 or -1.8% to $90.90, continuing to stay just above the $90 price level.
Dry Bulk / Freight
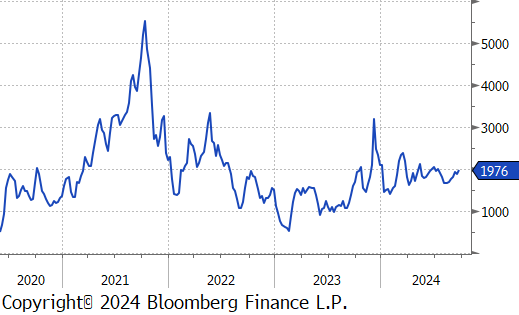
The Baltic Dry Index rose by $49 or 2.5% to $1,976, marking the third consecutive week of increases.
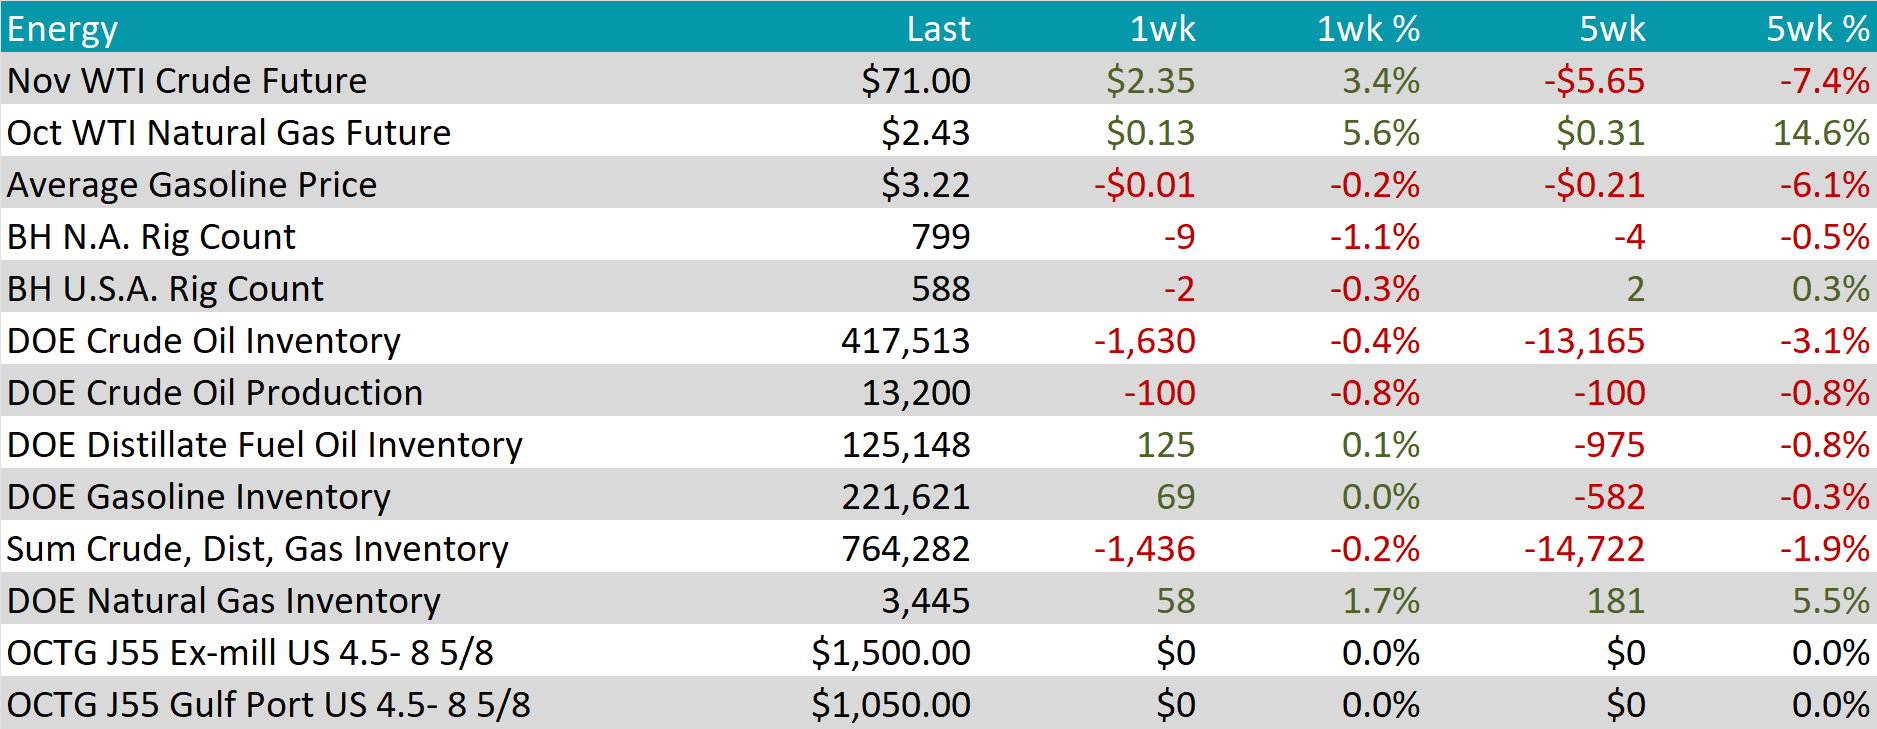
WTI crude oil future gained $2.35 or 3.4% to $71.00/bbl.
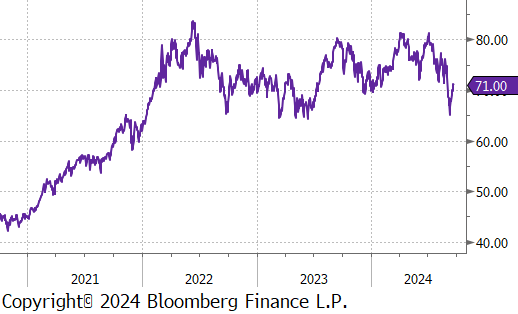
WTI natural gas future gained $0.13 or 5.6% to $2.43/bbl.
The aggregate inventory level slipped by -0.2%, returning to declining after briefly increasing last week.
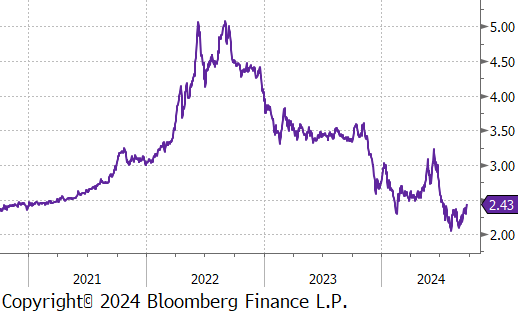
The Baker Hughes North American rig count reduced by 9 rigs, bringing the total count to 799 rigs, while the US rig count also feel, reducing by 2 rigs, bringing the total count to 588 rigs.

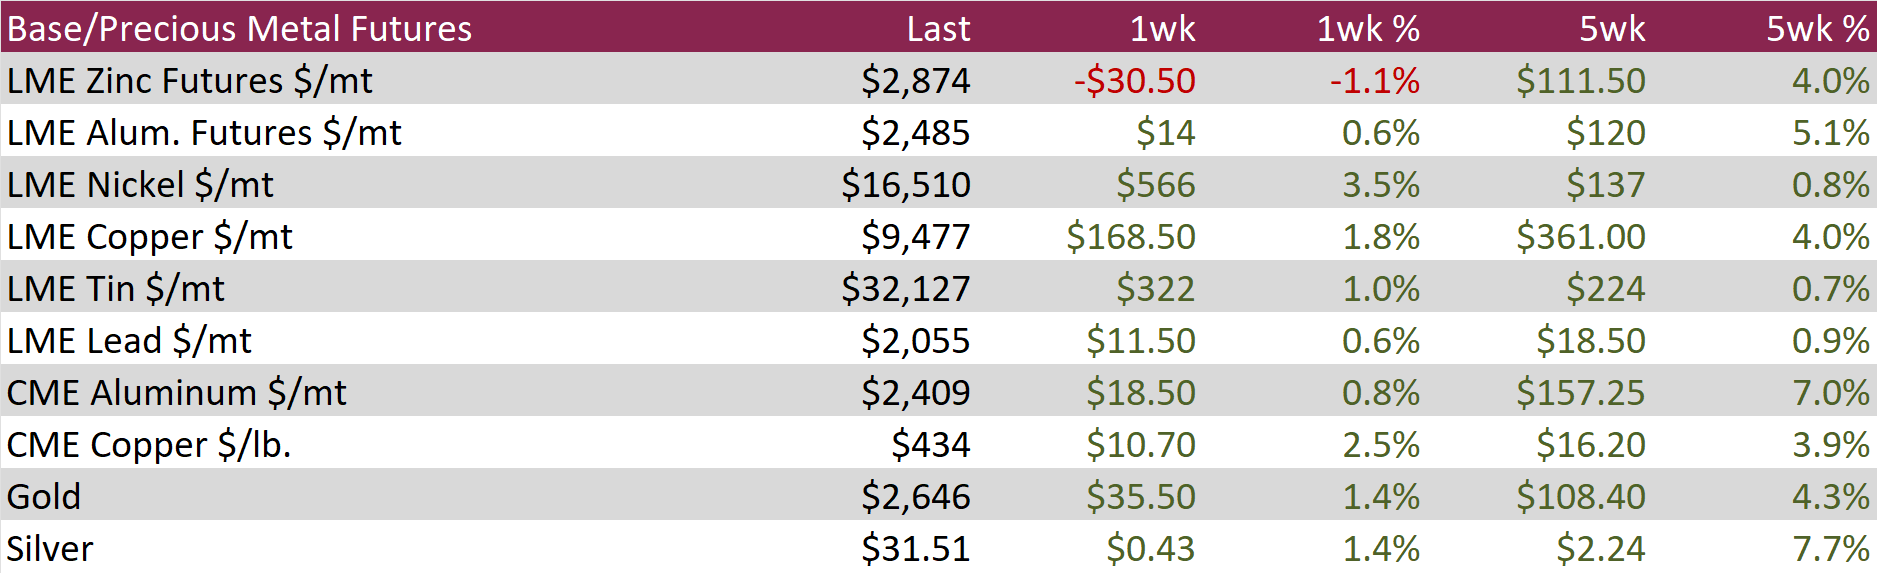
Aluminum futures increased by $14 or 0.6% $2,485, as the US Federal Reserve substantial rate cut bolstered the global economic outlook and sparked a rally. Furthermore, Saudi Arabia aimed to gain control of Bahrain’s aluminum smelter to further its plan for mining and metals to become a ‘third pillar’ of their economy.
Copper futures rose by $10.70 or 2.5% to $434, approaching two-month highs, amid the US Federal Reserve’s substantial rate. This move has raised hopes for a soft landing for the U.S. economy, as inflation trends back toward the target, and has increased the likelihood of similar policy easing in other major economies. Market participants are also closely monitoring potential economic support measures in China, the world’s largest copper consumer, following disappointing data on industrial output, retail sales, and fixed-asset investments, which highlighted the manufacturing sector’s vulnerability without additional stimulus. On the supply side, energy shortages in Zambia have constrained production, impacting one of the world’s key copper suppliers and adding further support to prices. Overall, the interplay between monetary policy shifts and supply-side constraints will be critical in shaping copper price dynamics in the coming months.
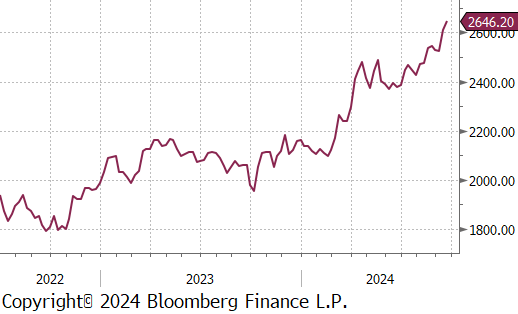
Gold soared by $35.50 or 1.4% to $2,646, maintaining its record highs. The metal’s appeal as a safe-haven asset was bolstered by expectations of further interest rate cuts and escalating geopolitical tensions. Last Wednesday, the Fed implemented its first rate cut in four years, reducing the benchmark rate by 50 basis points and indicating the possibility of another half-point cut by year-end. Investors are now focused on upcoming economic data, including PCE prices, personal income and spending reports, and comments from several Fed officials, which could provide additional insight into the future path of interest rates. At the same time, gold’s safe-haven status is being reinforced by rising tensions in the Middle East. Over the weekend, cross-border attacks between Israel and Hezbollah escalated, with leaders exchanging threats and the situation rapidly worsening.

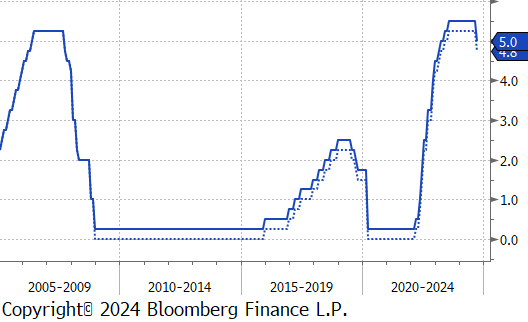
The FOMC (Federal Open Market Committee) met this week and announced a 50bps cut to the Federal Funds Rate, bringing the range down to 4.75-5%. The market was more divided than usual heading into a rate decision with 70% pricing in the likelihood of the jumbo cut versus 25bps. The much-watched dot plots also showed an abrupt turn and far more dovish outlook than their last release in June. Previously, the SEP (Summary of Economic Projections) showed a total of 25bps cuts in 2024, but Wednesday’s release showed a total of 100bps (suggesting an additional 50bps over the remaining meeting in November and December). Furthermore, the median dot also shows an additional 100bps in 2025, and another 50bps at some point in 2026. The FED has clearly signaled to the market that their concerns around inflation have fully subsided and they are now focused on keeping the labor market supported.
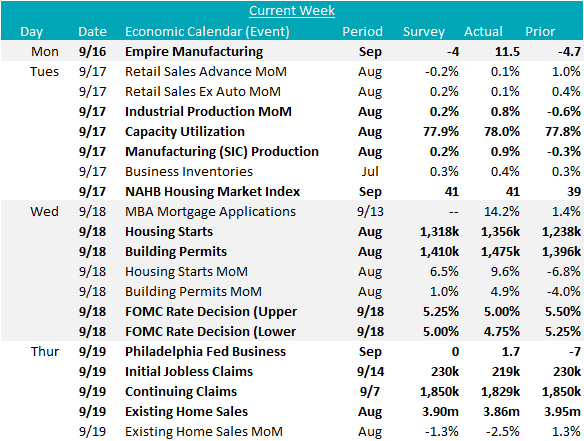
August housing starts and building permits rose 9.6%, and 4.9%, respectively, both beating expectations of more moderate increases. This was a promising signal ahead of the rate cut, as this sector is clearly the most interest rate sensitive. Existing home sales, on the other hand, came in at -2.5%, below the expected decline of -1.3%. Under the surface, the 30yr Fixed mortgage led the Fed decision and should support the market ahead, with the national average printing down to a 2-year low, this week.
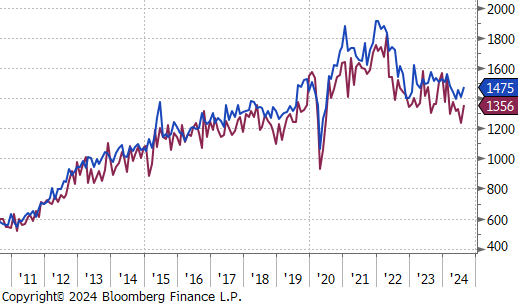
The industrial side also pro showed further signs of life. The August Empire (NY) and Philly FED manufacturing surveys both came in above expectations at 11.5 v expected -4, and 1.7 v expected 0. Furthermore, Industrial production jumped 0.8%, largely driven by a surge in manufacturing production, up 0.9%. Capacity utilization also improved to 78%, increasing by 0.6% from July.