Flack Capital Markets | Ferrous Financial Insider
September 29, 2023 – Issue #399
September 29, 2023 – Issue #399
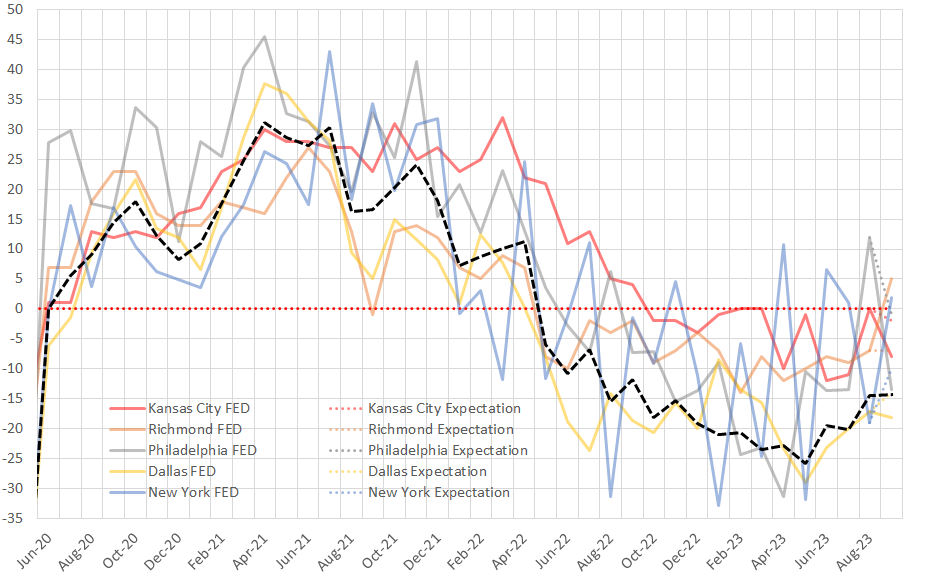
Ahead of the ISM Manufacturing PMI (next week), the Federal Reserve Manufacturing Surveys are released. The granularity of each regions subcomponents provides immense insight into how the sector is faring. The takeaway from the September data refresh is that the sector continues to recover and is trending towards expansion. The main driver of confidence in the recovery is the underlying data, where new orders, backlogs, and shipments are all clearly trending higher and among their highest levels in the last 12 months.
Taking a step back, the reason that this really matters is more in the context of the ongoing UAW/Big 3 strike. Our current estimations suggest that the preemptive production cuts by domestic mills have reduced supply below anticipated consumption levels given the fact that it was not a full strike, creating a mild shortage. If the strike continues as long as we anticipate, supply and consumption should come more into balance towards the end of November.
With that in mind, we anticipate very limited downside pressure from current spot levels and see the upside risks of 1) the manufacturing recovery materializing or 2) UAW strike resolution as not fully reflected in spot market sentiment.
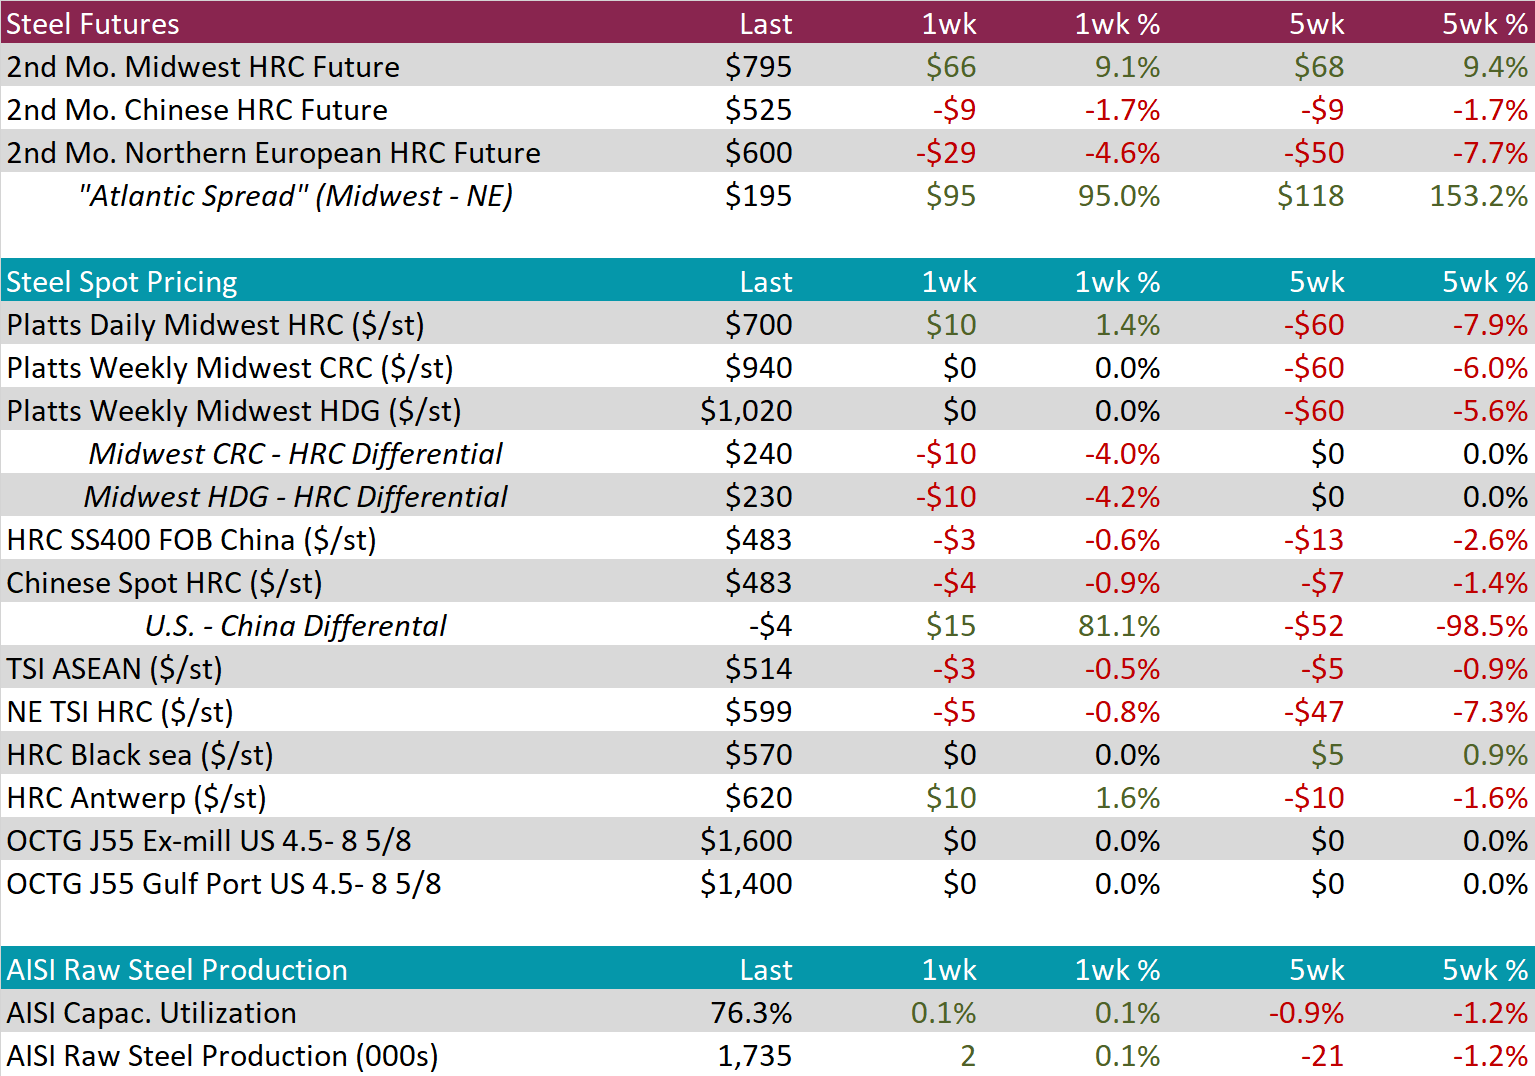
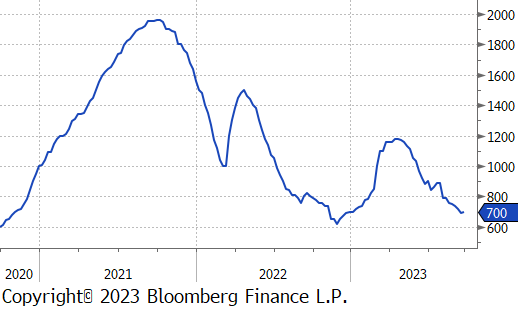
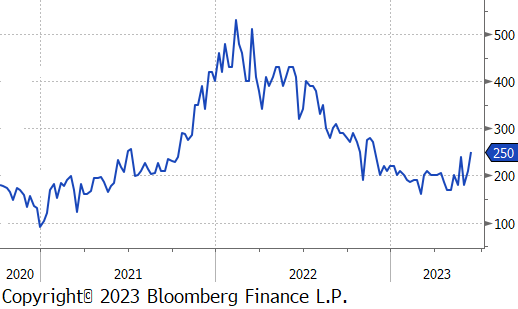
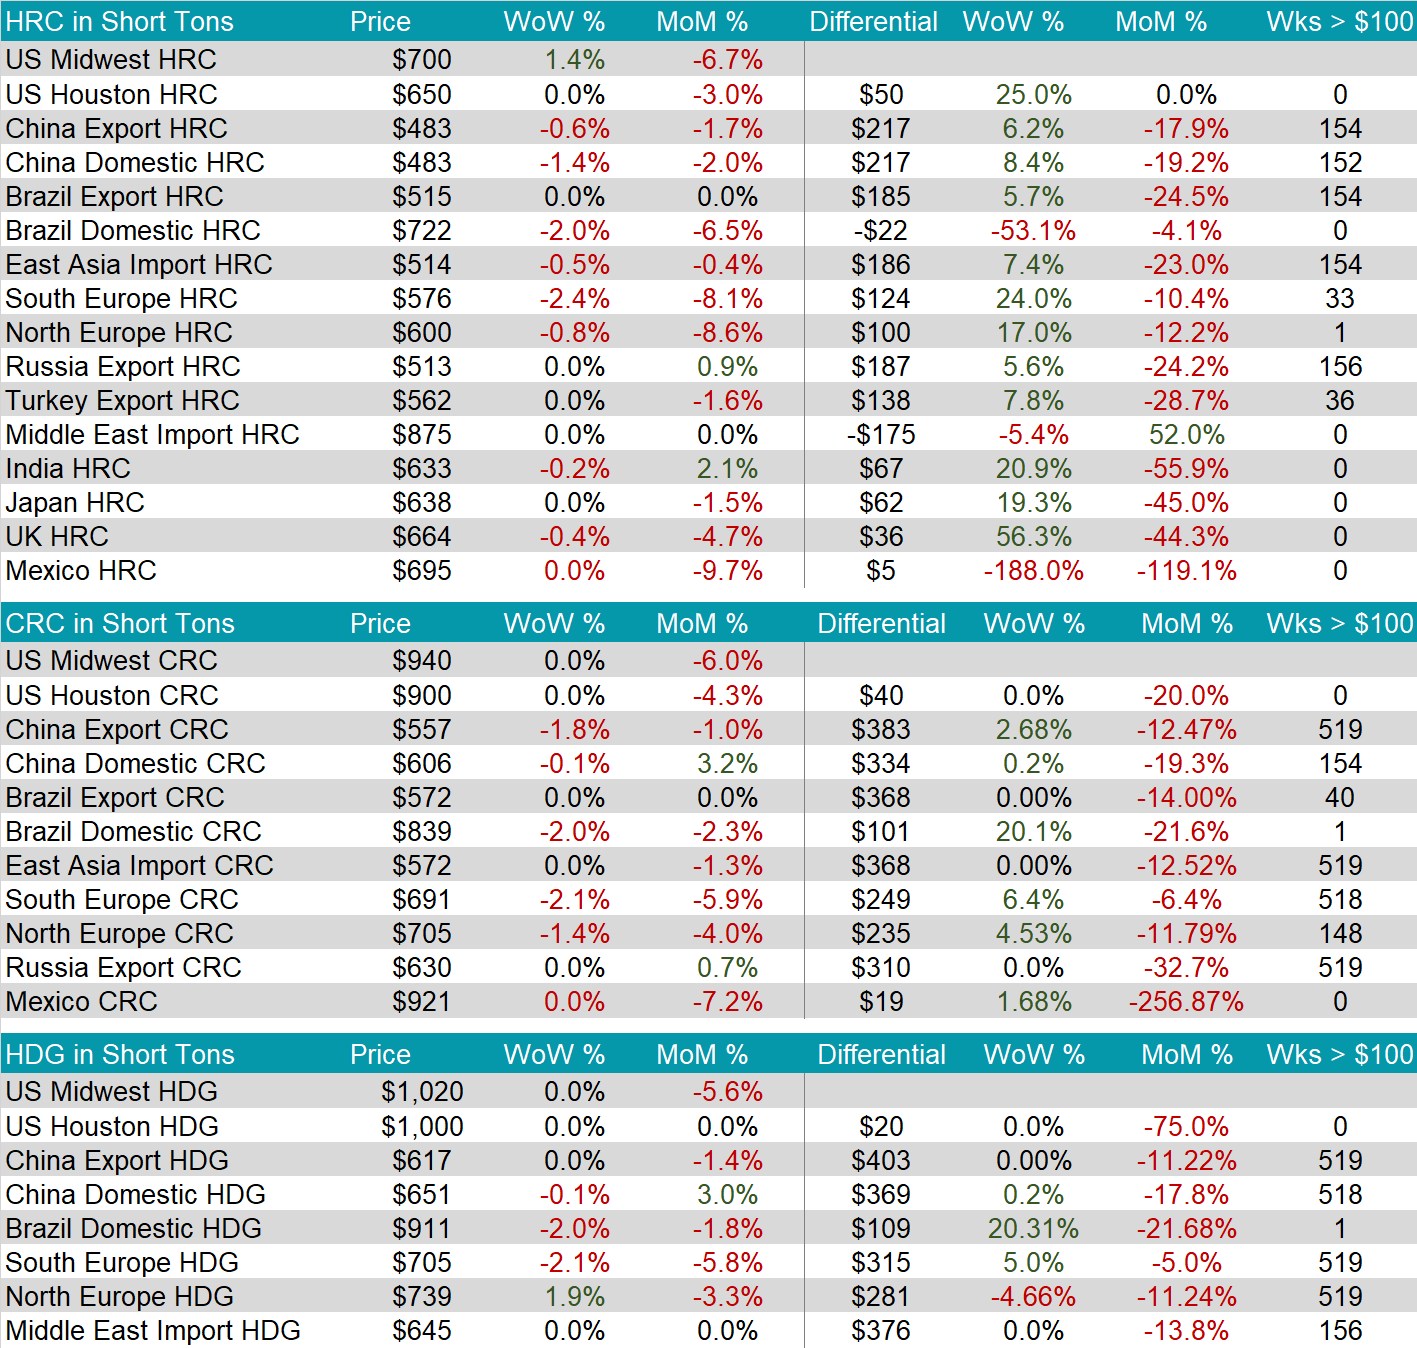
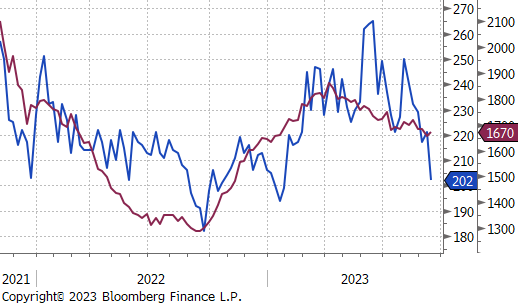
The HRC spot price rose this week to $700, up $10 or 1.4%, increasing for the first time since early July. This increase comes after last week’s decline resulted in the spot price hitting its lowest level of 2023. The rapid increase in lead times is a strong indication that we may be on the beginning on an upward trend.
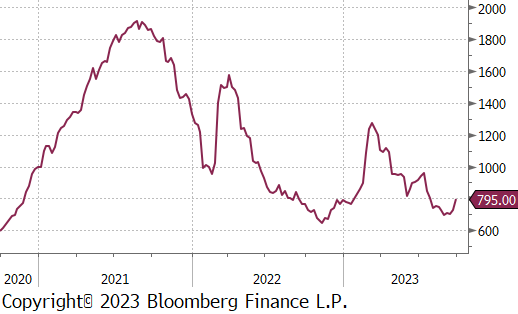
The 2nd month future rose again this week to $795, up $66 or 9.1%. This is the highest percentage increase since the curve rallied two weeks ago, indicating continued momentum.
Tandem products both continue to remain unchanged, resulting in the HDG – HRC Differential decreasing by $10.
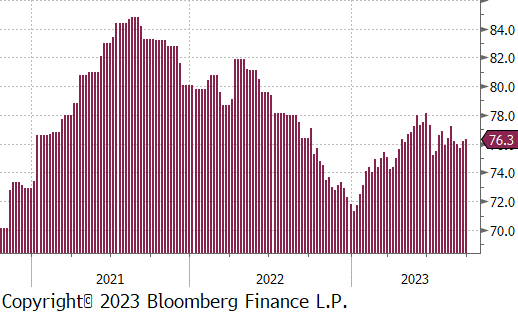
Mill production ticked a little bit up again this week, with capacity utilization increasing 0.1%, to 76.3%. The current level continues to remain within a neutral range as demand outlook becomes clearer.
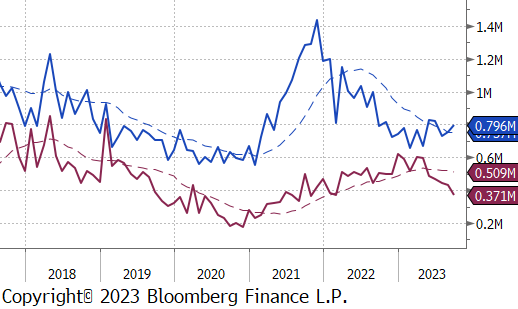
September Projection – Sheet 809k (up 42k MoM); Tube 425k (down 59k MoM)
August Projection – Sheet 765k (up 23k MoM); Tube 426k (down 12k MoM)
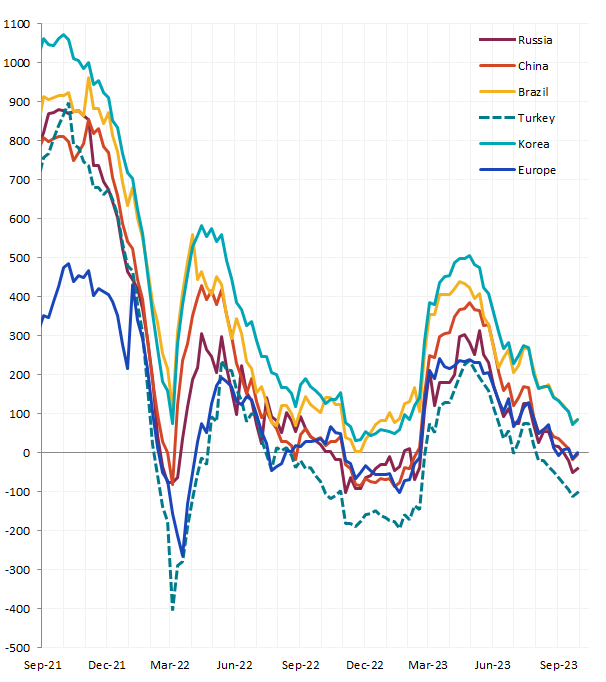
All of the watched global differentials were higher this week. The US domestic price was the only HRC price to increase. This sharp turnaround comes after last week, when the U.S. saw the biggest decline.
Scrap
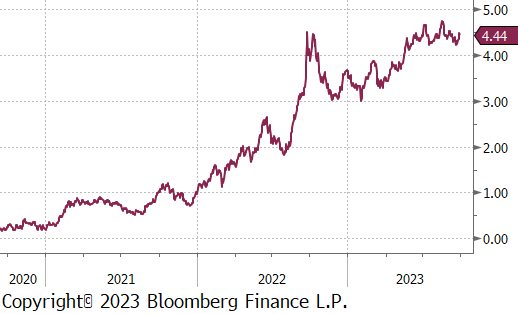
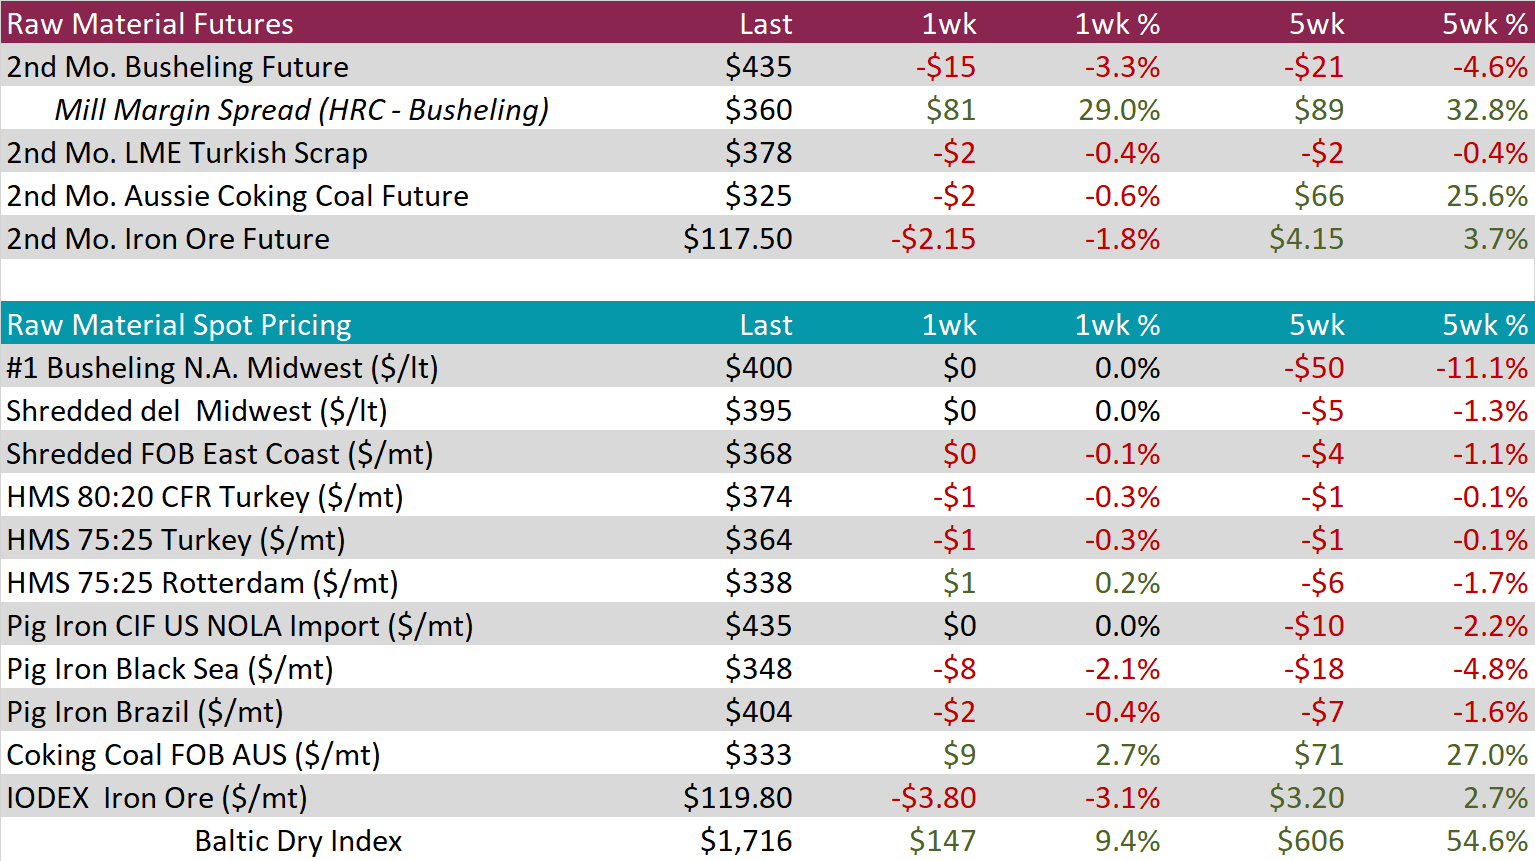
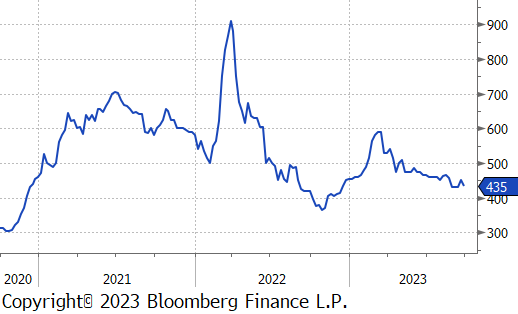
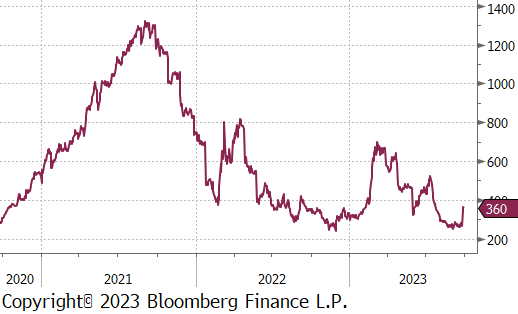
The 2nd month busheling future was down $15, or -3.3%, to $435. The mill margin spread increased again this week, albeit more significantly than the prior week, by $81 or 29%. This movement of divergence has most likely been caused by the heightened uncertainty around the UAW strikes.
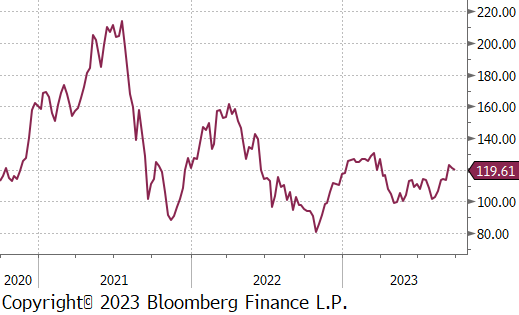
Ahead of China’s Golden Week, the 2nd month iron ore future experienced a $2.15 decline, amidst concerns about the Chinese property sector. Despite this volatility, market participants are monitoring market stimulus and property market developments for future insights, given indications of a potential Chinese industrial sector recovery.
Dry Bulk / Freight
The Baltic Dry Index was up again, this time by 9.4%, or $147. This move further suggests that demand for freight is increasing.
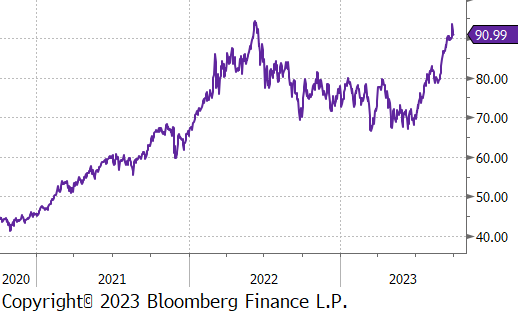
WTI crude oil future gained $0.76 or 0.8% to $90.79/bbl, nearing close to the recent price high in June 2022.
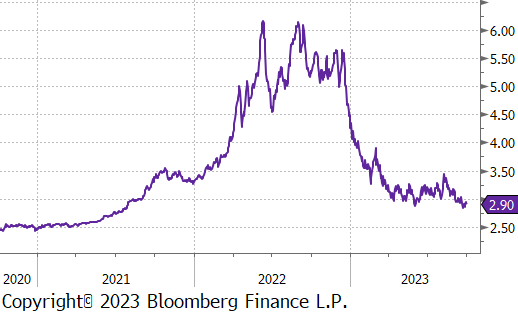
WTI natural gas future gained $0.29 or 11.1% to $2.93/bbl.
The aggregate inventory level was down slightly by 0.1%.
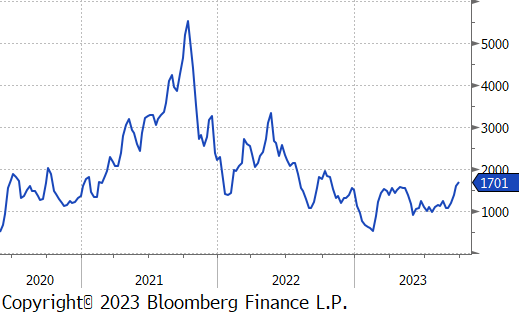
The Baker Hughes North American rig count was down by 6 rigs, and the US count was down by 7 rigs, a further reduction from the prior week.
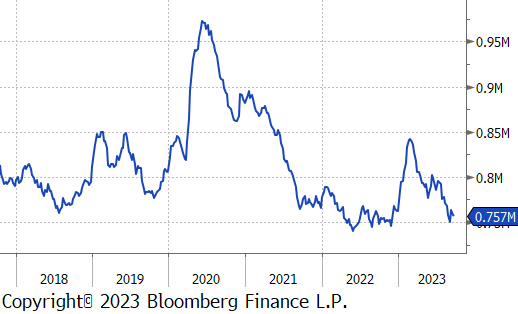
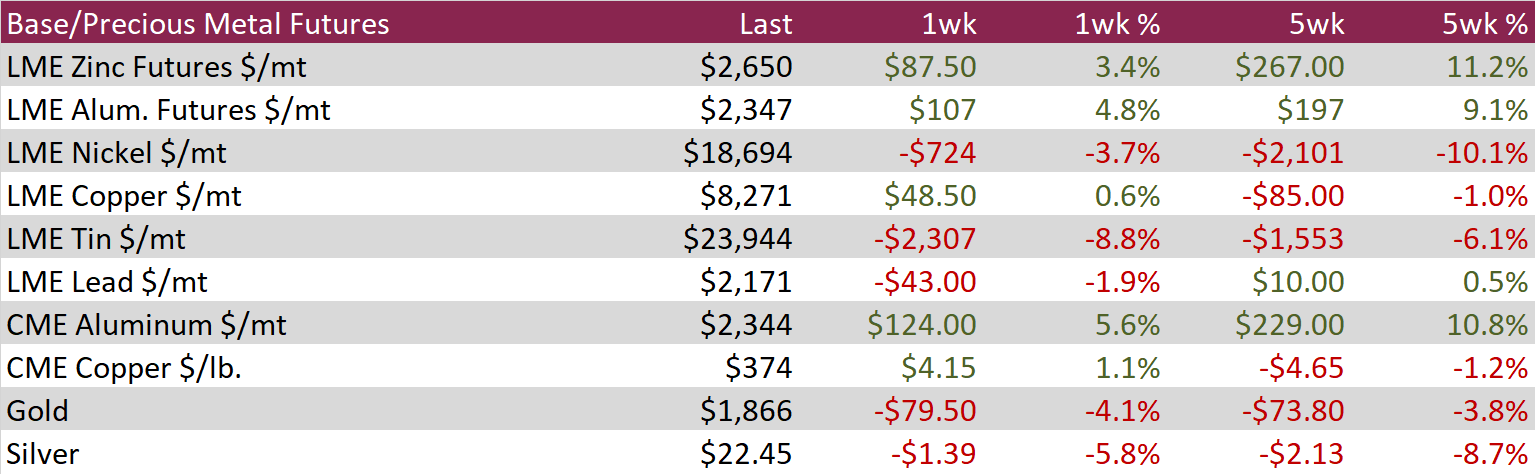
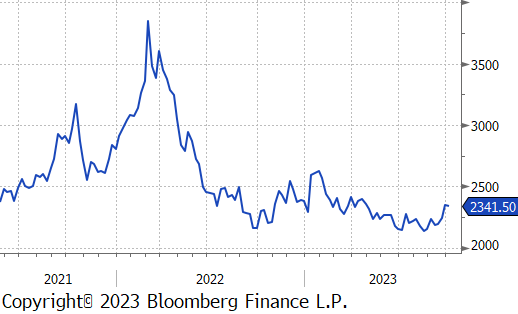
LME Aluminum futures rose by 4.8% during the week as readily available stocks fell toward historically low levels, prompted by substantial withdrawals from Asian warehouses. The dynamic shifts in LME inventory, often influenced by strategic repositioning of materials by traders and banks, can complicate the assessment of underlying demand. Speculators increased net bullish LME aluminum bets to an 8-week high through a combination of short-covering and adding fresh length.
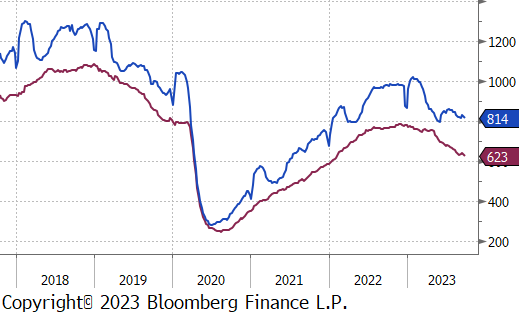
Copper futures ended the week mostly flat despite strong gains in other base metals, such as aluminum and zinc. The market did not experience significant changes in available inventories and was mostly focused on macro data from the US and China. The copper futures curve continues to move into steeper contango, with the cash copper contract trading at the steepest discount to the 3-month futures since December 2000 at $77.50 per ton, indicating a well-supplied physical market.
Silver
Losses in the silver futures market accelerated during the week, falling by 5.8% and bringing the 5-week decline to 8.7%. Silver futures have been under heavy selling pressure as interest rates and the US dollar rally on the back of economic data that continues to outperform expectations, fueling speculation of further hawkish policy by the Fed. The focus on inflation sets a bearish tone for silver, making the Federal Reserve’s monetary policy a dominant force in dictating the metal’s near-term performance.
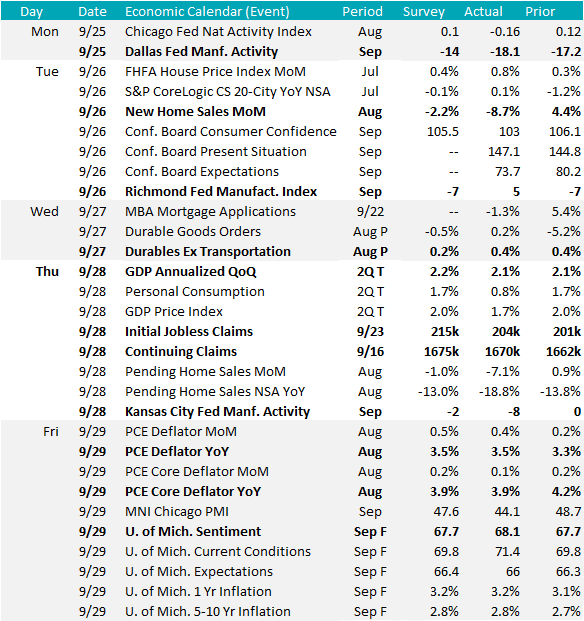
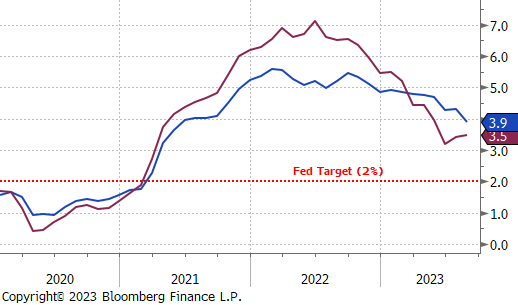
YoY topline PCE increased in August to 3.5%, up from 3.3% in July. More importantly, the less volatile YoY Core PCE (ex. food & energy) fell to 3.9%, matching market expectations, and down to its lowest level since September 2021. Although it is still higher than the Federal Reserve’s target of 2%, the decline from the previous month’s 4.2%, coupled with early signs of a cooling labor market, has led some investors to lower their probabilities of another interest rate hike by the end of year.
Looking to the weekly labor market data, Initial and continuing jobless claims both increased yet slightly and came in well below their expectations. This suggests that the labor market continues to remain at historically tight levels. However, this slight increase in claims from a decrease the previous week could be showing early signs that the labor market may be in the preliminaries of a softening.
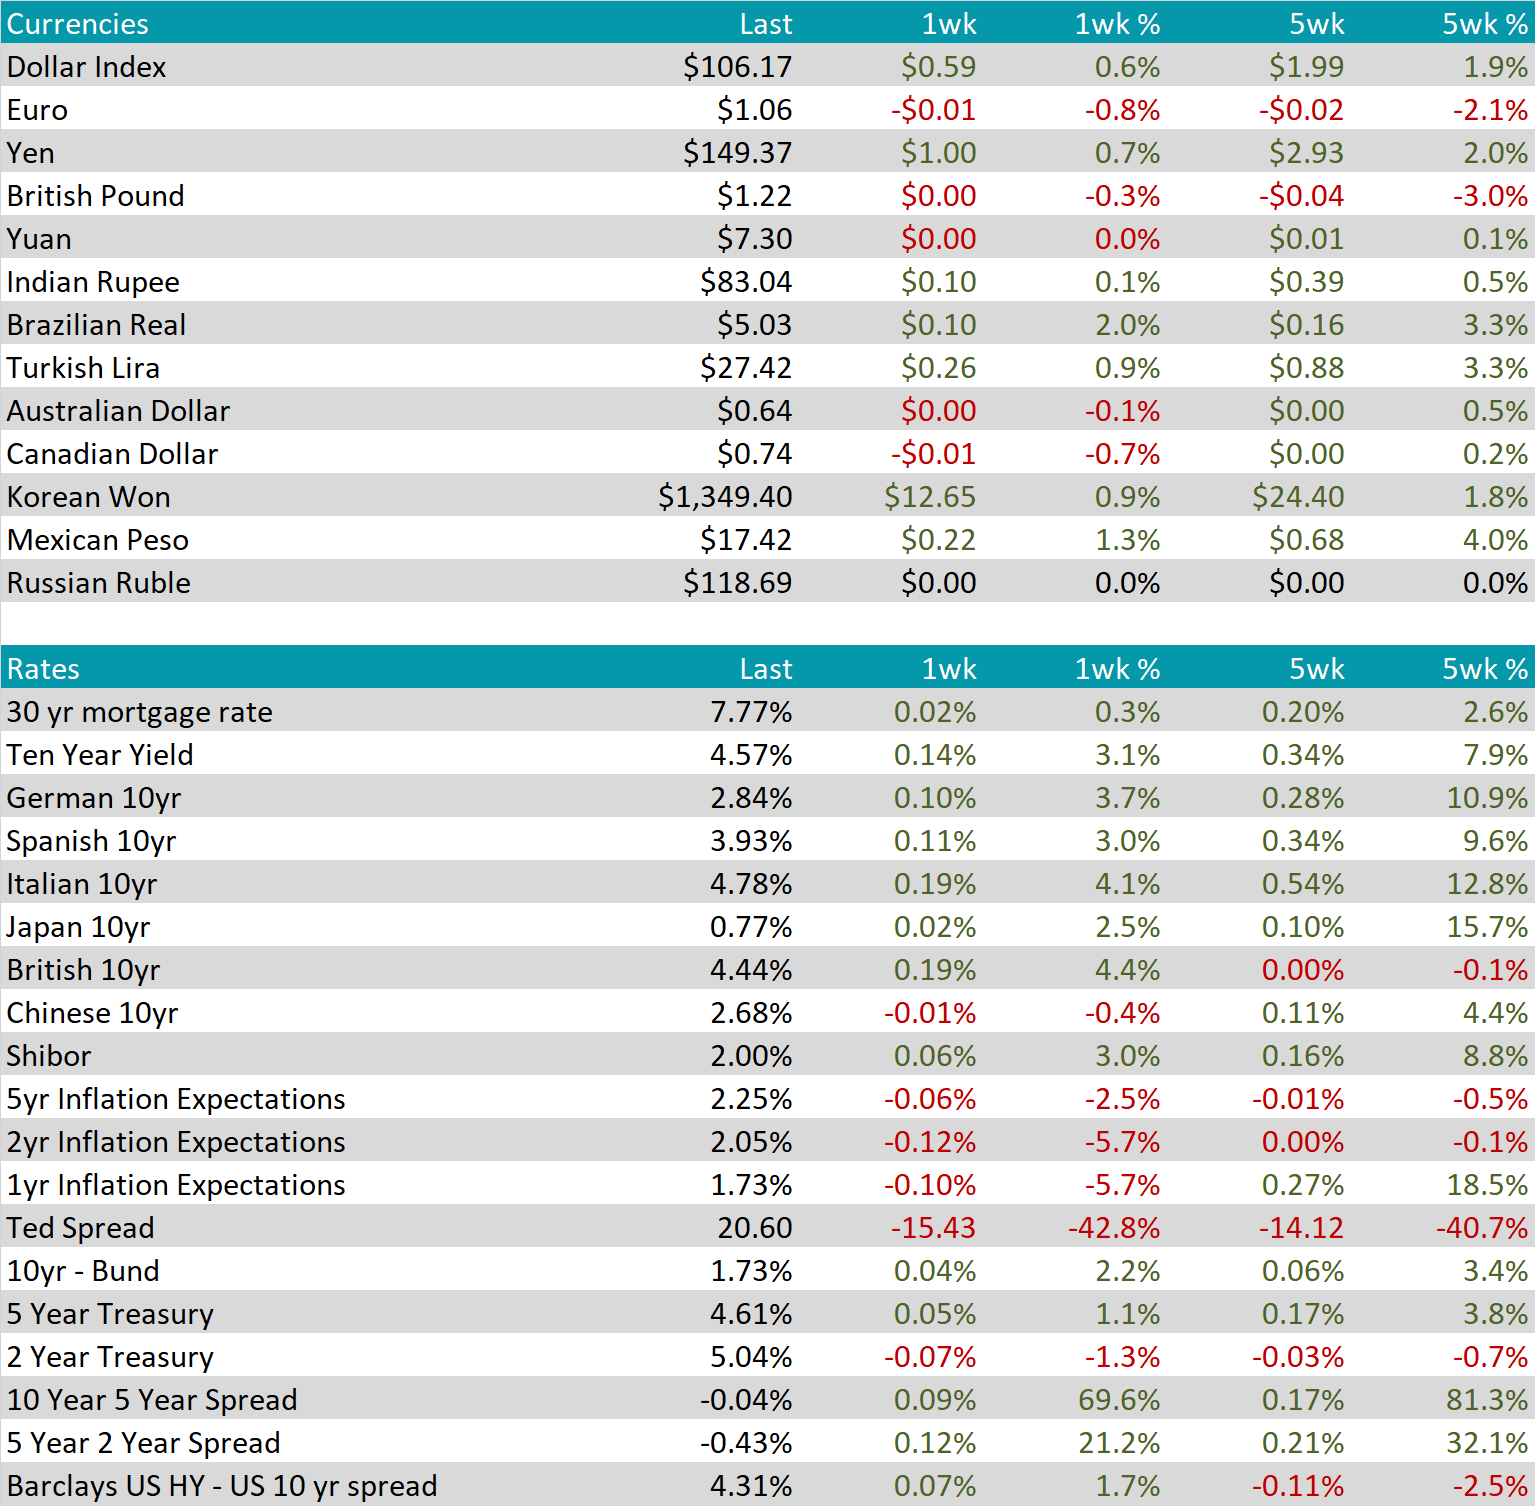
The EURUSD currency pair experienced a notable decline, with the euro reaching its weakest levels since December 2022. This drop is primarily attributed to investors’ growing preference for the US dollar, driven by the continuous release of stronger than expected economic data in the United States. On the other hand, concerns are mounting within the European Union as investors closely monitor easing inflation rates coupled with an increasing risk of recession. September’s CPI inflation figures fell below expectations at 4.3%, marking the lowest level since October 2021. Despite exceeding the European Central Bank’s 2% target, this decline signals economic challenges in the EU.
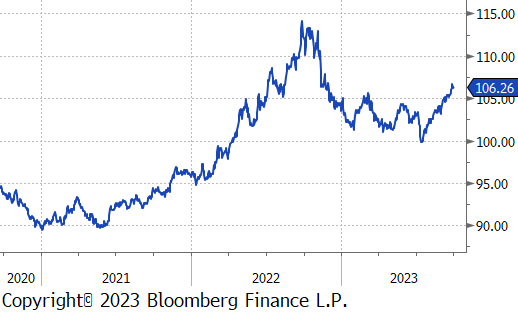
The Australian dollar continued its downward trajectory, concluding the week at an exchange rate of 0.64 USD. This depreciation comes as the Reserve Bank of Australia (RBA) opted to keep interest rates steady at 4.1% for the fourth consecutive month. The RBA’s decision is in line with its goal of returning inflation to the target range of 2-3% by late 2025.
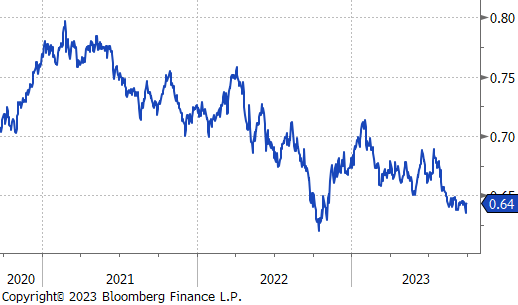
Longer-term treasury yields in the United States are currently under significant selling pressure, and the 10-year treasury yields is steadily approaching levels not seen since 2007. This trend is primarily driven by the performance of the US economy and growing concerns that the Federal Reserve will maintain higher interest rates for an extended period to combat inflation. Recent statements from several Fed members have underscored the possibility of another interest rate hike within the year, reinforcing the message of a “higher for longer” interest rate policy.