Midwest flat rolled prices continued the rally that began at $365/st in December, 2015. So far, prices have seen higher highs and higher lows. We remain positive on the domestic steel industry while watching some concerning developments in the domestic automotive industry and iron ore and Chinese finished steel prices. The past two weeks have brought a bit of a headwind to the market. It will be interesting to see how much of that is a result of the supply chain being disrupted spring breaks being spread across those two weeks or if demand is truly slowing. Regardless, the “buy the dip” theme remains intact as fundamental data continues to be very strong.
TSI Daily Midwest HRC Index

Steel industry specific fundamentals continue to be solid with robust momentum across multiple industries (see WoW report 3/31 for in depth analysis) including a strengthening rebound in the domestic energy sector. PMI data has been in a solid uptrend in not only the US, but also Europe and China.
The domestic steel industry has seen healthy and much improved shipment levels while imports remain subdued both as a result of better international demand and D.O.C. duties. Inventory levels are at multi-year lows as evidenced by the ISM Manufacturing PMI, Durable Goods Report and confirmed today with the latest release of MSCI’s Metals Activity Report.

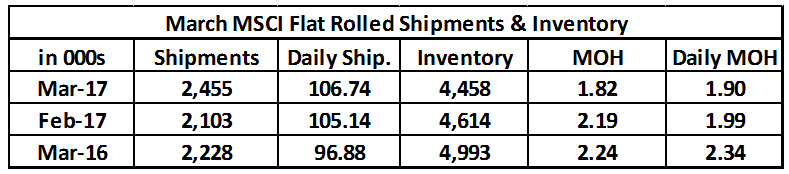

March MSCI flat rolled data continued its bullish run with shipments at 2.46m short tons (st) (left chart), up 16.75% MoM and 10% YoY. The chart on the right compares March shipments back to 2001.

YTD shipments are up 5.8% YoY. FYI, YTD Shipments through March of 2016 were down 5.7% vs. 2015.

The MSCI reported service centers continued to destock in March. Service centers shed 156k st to 4.46m (left), down 3.4% MoM and 10.7% YoY. The chart on the right compares March inventory levels back to 2001.

The March daily shipment rate (D.S.R.) of 106.7k st/day was up 1.5% MoM and 10% YoY.

March months-on-hand (M.O.H.) fell to 1.82 while M.O.H. D.S.R. adjusted fell to 1.9.

To summarize, this bullish report showed improving monthly shipments and daily shipments, lower inventory and M.O.H. below 2. This combination lays the foundation for the “buy the dips” theme as buyers should be quick to support prices should they correct.
Domestic flat rolled indexes were close to unchanged in the $650 area. However, HRC prices in Europe, Asia and Russia have been falling over the past couple weeks and were pushed lower again this past week.

The TSI ASEAN HRC Index fell almost $20/st or 4.23% to $411/st. The North European index fell almost 2% or $10 to $533/st. The differentials to US Midwest HRC prices are starting to expand to levels that could boost import transactions. However those imports won’t show up until the August – October period. At a certain point in the calendar, the attractiveness of imports collapses once they fall into late November and December delivery. This is especially true and the deadline is closer for CRC and HDG.

CME Midwest HRC futures were mixed. April futures were flat at $655, May slipped $5 to $630 and June was flat at $610. Q3 gained $5 to $605 while Q4 fell $7 to $580.

The TSI Daily Midwest HRC Index inched $2 higher to $652 falling below April futures at $655, but above May futures currently at $630/st.
May CME HRC Futures vs. TSI Daily Midwest HRC Price

Sheet imports remain subdued.

Tube imports have popped as the comeback in the energy market has gained steam.

AISI Steel Capacity Utilization Rate and TSI Daily HRC Price

AISI data rebounded nicely back to 73%.

Iron ore spot and futures prices sold off hard falling around 9%.


The iron ore curve shifted lower remaining steeply backwardated through 2018. The curve is flattening as prices fall.

Chinese rebar was under pressure again this week taking Black Sea billet and Turkish rebar down with it.

The March NFIB Small Business Optimism Index was in line with expectations falling to 104.7 from 105.3 in February. The March PPI was 2.3% YoY while PPI Ex Food, Energy and Trade was up 1.7% YoY. The March CPI was up 2.4% YoY, missing expectations of 2.6% while the CPI Ex Food and Energy was up 2% YoY, also missing expectations and down from 2.2% in February, but far from the deflationary concerns faced this time last year. The April University of Michigan Sentiment and Current Conditions Indexes were up MoM.

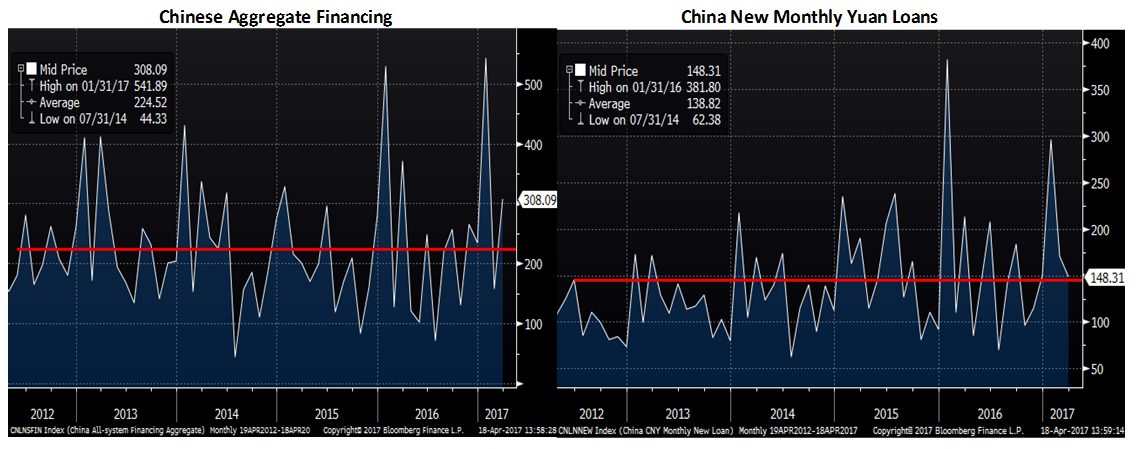
March Chinese Aggregate Financing of 2.12 trillion yuan was up sharply and much better than expected, however March New Yuan Loans were down MoM and missed expectations.
Chinese Q1 GDP of 6.9% beat expectations with March retail sales, fixed asset investment and industrial production all beating expectations. Chinese CPI was up 0.9% and PPI was up 7.6%.

The S&P 500 was down 1% with Europe down 1.3% and the Nikkei down almost 3%. China CSI 300 was down 1%, but the Shanghai Property Index gained 1%.

Steel stocks got hammered.

AK Steel

Iron ore miners were all lower.

Base metals fell across the board again last week with LME zinc down 3%, CME copper down 3% and LME Aluminum down 2.2%.

LME Zinc

LME Aluminum

The dollar index slipped to 100.5 while the Japanese yen screamed higher. The Russian ruble, British pound and Australian dollar all gained in excess of 1%.

US Dollar Index

Japanese Yen

Russian Ruble

Australian Dollar

Crude oil prices rallied again last week to $53.18/bbl after inventory levels fell 0.8%. US production continued to move higher as did the US rig count. Natural gas was quiet ending the week at $3.23/mbtu.

May WTI Crude Oil Futures

Aggregate Energy Inventory (Blue) vs. WTI Crude Oil Futures

D.O.E. Crude Oil Inventory

D.O.E. Crude Oil Inventory Perspective (1982 – Present)

Baker Hughes US Rig Count

D.O.E. Crude Oil Production

D.O.E. Crude Oil Production Perspective (1984 – Present)

The US 10-year Treasury yield fell 14 basis points to 2.24%. British, German and Japanese 10 yr yields fell as investors took cover while the more risky Spanish and Italian 10 yr rates gained. Inflation expectations moved lower. Some of the downward movement in rates and the dollar followed President Trump’s comments that he preferred lower rates and a weaker US dollar.

U.S. 10 Year Bond Yield

The list below details some upside and downside risks relevant to the steel industry. The bolded ones are occurring or look to be highly likely. Upside risks look to be in charge.
Upside Risks:
– China pumping up its “old economy”
– Energy industry rebound
– Border adjustment tax
– Big rally triggered by price increases/low inventory/restocking
– President Trump’s agenda
– Infrastructure bill/long-term solution to highway spending bill
– China getting serious about curtailing steel production
– Transportation supply constraints
– Essar labor issues
– Post-election economic pick up
– Massive restocking (domestic and/or global)
– Unplanned domestic supply side disruptions
Downside Risks:
– Political uncertainty – Reflation trade reversing
– Increasing oil and iron ore inventory levels
– Automotive industry under pressure
– US domestic producers bringing back on capacity
– Higher interest rates slowing residential construction and auto sales
– Tightening financial conditions pressuring auto sales driven by sub-prime financing
– Chinese restrictions in property market
– The Chinese Financial Crisis
– Unexpected sharp China RMB devaluation
– Rebound in import volumes
– Increasing import differentials
– Resumption of US dollar rally/currency issues/sovereign default
– U.S. (manufacturing) recession
– Falling ferrous raw materials and global finished steel prices
– Economic downturn, especially in China or Europe reverberating to U.S.A.
– Weak demand in housing or automotive