Looking at the data, it is hard to understand why there has been so much reluctance from the buying community, especially with respect to the steep backwardation in the HRC futures curve. The data is not perfect, but it’s pretty darn good. In fact, its’ probably the best collection of data we’ve seen in years.
The following charts summarize most of this constructive point of view which include:
- A rebounding domestic energy industry
- A sharp spike in Australian coking coal prices
- A global uptrend in manufacturing purchasing manager indexes
- Relatively low domestic flat rolled inventory and import levels
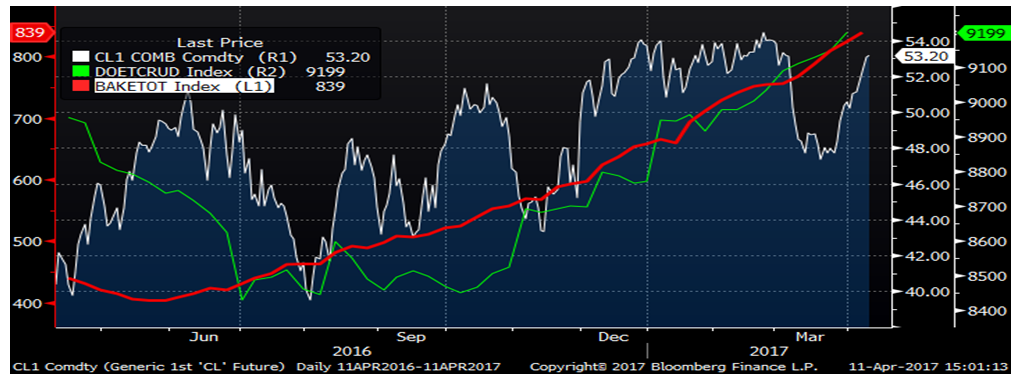
The chart below shows the rebound in production, rigs and crude prices with a nice uptrend in production and rig counts. The rebound in crude prices in the face of building inventory levels is very impressive. Buyers are rewarded when they buy the dips in bull markets and so far in 2017, buying crude oil when it fell in March has been very profitable. Regardless, what counts most to the steel industry is the rig count as it boosts pipe and tube purchases.
WTI Crude Oil Futures (white), US Crude Oil Production (green) and US Rig Count (red)
Coking coal is up 84% in a week! Last year, coking coal prices exploded after China restricted production. There was a lagged effect, but in the months that followed, iron ore and Chinese HRC rallied sharply
Australian Coking Coal (white), Chinese HRC Price (red), Second Month Iron Ore (green) and TSI US Midwest HRC Index (orange)

Purchasing manager’s indexes are trending higher in the world’s largest economies.
US (blue), Eurozone (yellow) and Chinese (red) Manufacturing PMI, April CME Midwest HRC Futures (white)

Flat-rolled inventory levels are very low. Barring a major correction or recession, opportunistic buyers could provide a floor resulting in shallow sell-offs.
Flat Rolled Imports (blue, left axis) and MSCI Flat Rolled Inventory (red)

But some data, such as March’s employment and auto sales, was very disappointing. However, one has to consider the effect the blizzard that hit the Northeast in March had on both of these data points as they have been in a long-term solid uptrend. Waiting to see April’s data will be key as these reports might show some mean reversion and provide an upside surprise. While March had twenty three business days vs. nineteen in February, 1.55m vehicles were sold sold vs. 1.33m in February. This led to a drop in auto inventory levels at dealerships to 72 days from 74 days.
Nonfarm Payrolls MoM (Orange) and US Auto Sales SAAR

Another concerning development is the fall in Chinese HRC and the the iron ore prices.
Chinese HRC (white) and Second Month Iron Ore Futures (orange)

Domestic flat rolled prices were mixed. The first signs of weakness in European prices emerged while Chinese HRC prices continued to fall.

The TSI North European HRC index remains range bound while the TSI ASEAN HRC Index was flat WoW.

CME Midwest HRC futures rallied sharply throughout most of the months in 2017. April futures gained $25 to $655, May gained $15 to $635 and June was flat at $610. Q3 gained $20 to $600 and Q4 gained $12 to $587, however the CME had settled prices aggressively below the market the week before explaining some of the rebound.

The TSI Daily Midwest HRC Index slipped $10 to $650 falling below April futures at $655.
May CME HRC Futures vs. TSI Daily Midwest HRC Price

Flat rolled imports continue to remain subdued.

Tube imports have popped as the comeback in the energy market has gained steam.

AISI Steel Capacity Utilization Rate and TSI Daily HRC Price


Coking coal spiked as discussed above. Last year it rallied from $100/t to $200/t and no one thought it would last. Then it rallied another $100/t to just above $300 and stayed up there for a month. Prices stayed above $200 from mid-September 2016 to early January 2017.
SBB Premium Hard Coking Coal Australian Export

Brazilian pig iron gained $80 to $380/t. The TSI Turkish Scrap Index gained $8 to $275/t. Iron ore was under serious pressure with the three month futures falling 7% to $71/t. Busheling settled at $370/lt, down $17.50 on the month.


The iron ore curve shifted lower remaining steeply backwardated through 2018.

Turkish rebar gained 2.4% to $432.50/t while Chinese rebar prices fell 1-1.5%.

Last week’s WoW report did a deep dive into March PMI reports, March auto sales and February construction spending. The March employment report showed an improved unemployment rate to 4.5% from 4.7%, however nonfarm payroll gains of 89k jobs grossly missed expectations of 170k. There is some controversy regarding the effect of March’s blizzard had on the job gains. February Factory Orders gained 1%, in line with expectations, while January data was revised higher to 1.5% from 1.2%. The ISM Non-Manufacturing report fell to 55.2 from 57.6 and missed expectations of 57.

The S&P 500 was unchanged. China saw nice gains while the Nikkei fell almost 1%.

AK Steel gained over 6% on takeover rumors. The rest of the complex was mixed to lower.

AK Steel

Iron ore miners were mixed.

Base metals fell across the board with zinc falling 2.25%, nickel losing 1.75% and copper slipping 1.5%.

LME Zinc

The dollar index rebounded back above 101 to 101.13. The British pound, Korean won, Australian dollar, Russian ruble and Turkish lira fell in excess of 1%.

US Dollar Index

Turkish Lira

Russian Ruble

Australian Dollar

Crude oil prices are back in rally mode gaining 3.25% to $52.24. The U.S. rig count gained 15 rigs to 839 while production continued higher. Crude oil inventory was up slightly while the aggregate inventory was flat. Natural gas gained 2.25% to $3.26/mbtu with inventory remaining flat.

May WTI Crude Oil Futures

Aggregate Energy Inventory (Blue) vs. WTI Crude Oil Futures

D.O.E. Crude Oil Inventory

D.O.E. Crude Oil Inventory Perspective (1982 – Present)

Baker Hughes US Rig Count

D.O.E. Crude Oil Production

D.O.E. Crude Oil Production Perspective (1984 – Present)

The US 10-year Treasury yield fell to as low as 2.27% initially following the employment report before rebounding to close the week at 2.38%. 10 year Treasury rates fell across Europe and in Japan.

U.S. 10 Year Bond Yield

The list below details some upside and downside risks relevant to the steel industry. The bolded ones are occurring or look to be highly likely. Upside risks look to be in charge.
Upside Risks:
– China pumping up its “old economy”
– Energy industry rebound
– Threat of President Trump using executive powers to further restrict imports
– Big rally triggered by price increases/low inventory/restocking
– President Trump’s agenda
– Infrastructure bill/long-term solution to highway spending bill
– China getting serious about curtailing steel production
– Transportation supply constraints
– Essar labor issues
– Post-election economic pick up
– Massive restocking (domestic and/or global)
– Unplanned domestic supply side disruptions
Downside Risks:
– Political uncertainty – Reflation trade reversing
– Increasing oil and iron ore inventory levels
– Automotive industry under pressure
– US domestic producers bringing back on capacity
– Higher interest rates slowing residential construction and auto sales
– Tightening financial conditions pressuring auto sales driven by sub-prime financing
– Chinese restrictions in property market
– The Chinese Financial Crisis
– Unexpected sharp China RMB devaluation
– Rebound in import volumes
– Increasing import differentials
– Resumption of US dollar rally/currency issues/sovereign default
– U.S. (manufacturing) recession
– Falling ferrous raw materials and global finished steel prices
– Economic downturn, especially in China or Europe reverberating to U.S.A.
– Weak demand in housing or automotive