Domestic physical flat rolled prices continued to be under pressure last week. In the steel market, we see downside risks outweighing upside risks warranting a prudent and risk-averse purchasing and inventory management strategy. The following issues provide the foundation of our view:
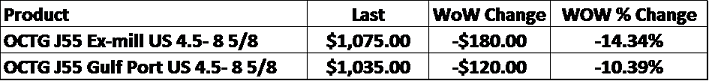
The January WTI crude oil future peaked at $76.55 on October 3rd and then fell 35% over the course of seven weeks. As the oil price collapsed, rumors of hedge funds long crude oil and short natural gas was discussed as a major reason for the sharp move lower. Too much production and supply was also thought to be contributing to the weakness. However, crude has failed to rebound, instead trading between $50 – $55/bbl since Thanksgiving. OPEC met and agreed to cut production to some extent, but this announcement failed to have any significant effect on the price of oil. One important development over the last week was the sharp drop in OCTG prices. SBB Platts OCTG pricing updates with a very low frequency. As of last Friday, OCTG prices fell 10% -14% in this latest update.
The fall in oil prices is now over 2 months long. The chart below shows the rig count has a strong lagged correlation to the oil price.
Front Month CME WTI Crude Oil Future & Baker Hughes U.S. Oil & Gas Rig Count

In other words, if oil prices remain at these levels or lower, expect rig counts to fall dramatically in kind and lead to weak demand for OCTG in 2019. While anecdotal, rumors of large purchase orders from the energy industry have helped to set a floor and provide domestic mills with a boost in lead times during weak markets. The energy industry, while only 8-10% of steel demand, punches above its weight and is a major player for the steel industry, especially when prices are falling. Compounding this issue, a number of domestic steel mills are not only highly dependent on producing steel for the energy industry, but have made recent expansions into downstream production for the energy industry. Moreover, imports from Korea are primarily HRC and OCTG products. Decreased demand for OCTG would likely lead to intensified competition to sell OCTG as well as an increase in Korean HRC imports to substitute for weak energy demand.
Oil prices are a reliable gauge of economic strength/weakness, so one has to consider if the sharp drop in oil is more than simply supply driven; that there is a weakening demand component as well contributing to the sharp price drop.
Similar to oil, the annualized U.S. new home sales (pictured below) has continued to trend lower with data in recent months seeing dramatic, almost vertical, drops lower.
U.S. Annualized New Home Sales

However, there still has been some economic data indicating the U.S. economy remains strong. Last week, there was better than expected ISM manufacturing and nonmanufacturing PMIs. The employment report continues to show strength with the unemployment rate falling to 3.7%. The October durable goods report showed some strength as well.
These mixed economic results likely indicates slowing growth rates at best, but being aware of data continuing to decline and the implications of that being a recession will be closely followed in this report.
Regardless of why, we have see domestic flat rolled prices falling since peaking in July. The Platts TSI Midwest HRC Index has shed $158 or 17.2% since peaking at $920 in July. When the market began to weaken over the summer, many assumed it was due to a buyer’s strike. As the year dragged on, it became clear that demand slowed due to tariffs, trade wars and higher interest rates. Further, buyer’s bearish expectations have been reinforced by falling flat rolled prices and lead times. Coupled with year-end destocking by service centers, domestic mills have struggled to build out lead times or regain pricing leverage. The HDG – HRC differential is at ultra-low levels is another indication of a weakening construction sector. Headlines like “Service Centers Take Another Step Closer to “Capitulation” in Sunday night’s Steel Market Update and consistent falling index pricing underpin that it is a buyer’s market.
The Platts TSI Midwest HRC Index


Rumors of a price increase announcement last week failed to materialize, which is likely a good thing as import offers, even tariff-adjusted offers, continue to offer lower prices week after week soaking up potential domestic purchase orders. Globally, economies and manufacturing continues to weaken with China’s economy hard hit by the trade war. As the U.S. dollar continues to strengthen and global flat rolled prices continue to fall, we expect timing of the bottom for the domestic flat rolled price will continue to move out.
As noted above, there has been a mixed bag of recent economic data providing for an opaque economic picture. The October U.S. Durable Goods New Orders Ex-Transportation grew 0.2% MoM, beating expectations of a 0.1% increase. This table shows the unadjusted new orders data in dollars comparing YoY and MoM performance. Since the data is in dollars, it doesn’t take into account the increased cost for raw materials such as steel. However, it does show which categories/sectors are strong and weak again indicating a mixed bag. Today’s economy is much different than that of 2017 when there was collective sector and global economic strength.
U.S. Durable Goods

The next series of charts compare the unadjusted new orders data to compare the last three years. The red line is 2018, green is 2017 and blue line is 2016.
U.S. Durable Goods New Orders Ex-Transportation NSA

U.S. Durable Goods New Orders Transportation Equipment NSA

U.S. Durable Goods New Orders Motor Vehicles & Parts NSA

U.S. Durable Goods New Orders Construction Materials & Supplies NSA

U.S. Durable Goods New Orders Fabricated Metal Products NSA

U.S. Durable Goods New Orders Machinery Manufacturing NSA

U.S. Durable Goods New Orders Motor Vehicle Bodies, Trailers & Parts

U.S. Capital Goods Nondefense Ex-Aircraft New Orders NSA

The November Employment Report saw a gain of 155k new jobs, which missed expectations of a 198k gain. The unemployment rate was steady at 3.7%. Average hourly earnings grew by 3.1% YoY in line with expectations.
The U.S. unemployment rate remained at 3.7%
U.S. Unemployment Rate

Manufacturing payrolls added 11k jobs.
U.S. Manufacturing Payrolls N.S.A.

Upside Risks:
– Sharp drop in steel imports
– Increased risk of domestic supply disruption
– Further section 232 tariffs and quotas restricting supply
– Chronically low inventory levels
– Chinese economic stimulus measures
– U.S. Infrastructure bill
Downside Risks:
– Declining rates of growth in manufacturing/demand destruction
– Weakening global economics/PMIs
– Crude oil prices falling sharply
– Higher interest rates
– Strengthening U.S. dollar
– Falling global flat rolled prices
– Tariff resolution and/or 232exclusions, especially Turkey reverting to original 25%
– Increased domestic production capacity
– Trade War Fallout
– Turkey/emerging market contagion
– Political & geopolitical uncertainty
– Stock Market Crash
The December CME HRC future decreased by $11 to $760 and the Platts TSI Daily Midwest HRC Index fell $11.25 to $761.75.
December CME HRC Future (orange) vs. Platts TSI Daily Midwest HRC Index (white)

The CME Midwest HRC futures curve is below with last Friday’s settlements in orange. The curve was under pressure falling $15 – $20 through 2019.

January ferrous futures are listed below. Chinese HRC and rebar futures were up 6.9% and 4.8%, respectively. Busheling, Midwest HRC, and Turkish scrap futures were all down around 1.5%.

Flat rolled indexes were mostly lower except Chinese HRC, which gained 2.5% and Chinese spot HRC gained 5.2%. OCTG prices got crushed.


The AISI Capacity Utilization Rate fell to 80.7%.
AISI Steel Capacity Utilization Rate and TSI Daily HRC Price

Last week’s latest November flat rolled import license data is forecasting a MoM decrease of 180k tons to 821k.

Last week’s November tube import license data is forecasting no change MoM.

November’s combined flat rolled and tube import license data is forecasting a 180k ton MoM decrease.
Flat Rolled (blue) and Tube (red) Imports

November AZ/AL import licenses are projecting a decrease of 17k tons MoM to 80k.
Galvalume Imports (blue) w/ 3 Mo. Moving Average (red)


Below are HRC and CRC Midwest vs. each country’s export price differentials using pricing from SBB Platts. HRC and CRC differentials continued to shrink.

SBB Platt’s HRC, CRC and HDG WoW pricing is below. The U.S. Midwest HRC was down 1.5% and the U.S. Houston HRC price was down 5.5%. The Midwest HDG price fell 1.1% and the Houston HDG price fell 8.4%. The Chinese domestic HRC price rebounded 5.4%. East Asian imported CRC was down 11.5%. Chinese export and domestic HDG were both down over 12%.


Listed below are ferrous raw materials WoW price changes. The IODEX and SGX 2-month Ore futures gained 2.3% and 1.4%, respectively. Turkish scrap prices moved lower and East Coast shred was down 5.2%.

The December SGX iron ore future gained $2.53 to $66.62 while the January Turkish scrap future gained $2 to $298.


Ex-flat rolled prices were mostly lower with the January Chinese rebar future falling 1.9% WoW, while April Chinese rebar futures rose 4.4% WoW.

Last week’s WoW covered the ISM, construction spending and auto data listed below. The U.S. Durable Goods and Employment Reports were discussed above.

October factory orders fell 2.1% while September orders were revised lower. Excluding transportation, October factory orders grew 0.3%, while Septemer orders were revised lower to a 0.1% gain from a 0.4% gain. The YoY growth rate in U.S. factory orders fell to 6.0% after peaking at 9.1% in June. The chart below shows the seasonally adjusted YoY growth rate with a three and twelve month moving average. The three month moving average has crossed below the twelve month indicating factory orders will continue to slow.
U.S .Factory Orders Ex-Transportation YoY SA

On the other hand, the November ISM Non-Manufacturing Index gained 0.4 points to 60.7, easily beating expectations of a drop to 59.
ISM Non-Manufacturing Index

Both ISM PMIs had strong November prints. The sum of both indexes rose two points to 120.
ISM Manufacturing + ISM Non-Manufacturing Index

The S&P 500 fell 4.4% following mixed signals from the China trade war and increased concerns of a global and domestic economic slowdown. The major stock indexes in Europe and Japan also fell sharply.

S&P 500
Steel mill stocks were down sharply with Steel Dynamics, AK Steel and U.S. Steel losing 8.2%, 7.8% and 7.6%, respectively.

Steel Dynamics

Service center’s stocks were all down WoW with Worthington leading the group lower falling by 7.6%

Worthington

Mining’s stocks were mostly lower.

Vale

LME base metal prices were mixed. The LME 3-month zinc future gained 1.8%, while the LME 3-month Nickel future was down 2.6% WoW.

LME 3-Month Rolling Zinc Future

LME 3-Month Rolling Nickel Future


The U.S. dollar was down 0.76 to 96.51. The Chinese yuan saw gains following the G-20. The Indian rupee, Turkish lira and Australian dollar all fell by over 1%.
US Dollar Index

Turkish Lira

The January WTI crude oil future added $1.68 to $52.61/bbl. Crude oil inventory fell 1.6%, while distillate inventory increased by 2.2% and gasoline inventory added 0.8%. The aggregate inventory level decreased 0.2%. Crude oil production remained at 11.7m bbl/day. The U.S. rig count and the North American rig count decreased by one and fourteen rigs, respectively. The January natural gas future fell by $0.12 or 2.7% to $4.49/mmBtu. Natural gas inventory fell 2.1%.

Jan. WTI Crude Oil Future (orange) and Jan. Crude 15 Delta Put Volatility (white)

Aggregate Energy Inventory (white) vs. Jan. WTI Crude Oil Futures (orange)

D.O.E. Crude Oil Inventory

D.O.E. Crude Oil Inventory Perspective (1982 – Present)

Baker Hughes U.S. Rig Count

Baker Hughes North American Rig Count

D.O.E. Crude Oil Production

D.O.E. Crude Oil Production Perspective (1983 – Present)

Risk-off behavior prevailed as buyers flooded into treasuries. The U.S. ten-year treasury yield fell fourteen basis points closing the week at 2.85% while the Japanese ten-year bond yield fell by three basis points and the German ten year by six.

U.S. Ten-Year Bond Yield

Japanese Ten-Year Bond Yield

German Ten-Year Bond Yield

The list below details some upside and downside risks relevant to the steel industry. The bolded ones are occurring or highly likely.
Upside Risks:
– Sharp drop in steel imports
– Increased risk of domestic supply disruption
– Further section 232 tariffs and quotas restricting supply
– Chronically low inventory levels
– Chinese economic stimulus measures
– U.S. Infrastructure Bill
– Potential Russian sanctions cutting off Russian steel
– China strict steel capacity cuts/China getting serious about curtailing steel production
– Energy industry rebound
– Graphite Electrode Shortage
– Unexpected inflation
– Weaker dollar
– Flatbed trucking availability/transportation supply constraints
– Infrastructure bill/long-term solution to highway spending bill
Downside Risks:
- Declining rates of growth in manufacturing/demand destruction
- Weakening global economics/PMIs
- Crude oil prices falling sharply
- Higher interest rates
- Strengthening U.S. dollar
- Falling global flat rolled prices
- Tariff resolution and/or 232 exclusions, especially Turkey reverting to original 25%
- Increased domestic production capacity
- Trade War Fallout
- Turkey/emerging market contagion
- Political & geopolitical uncertainty
- Stock Market Crash
– Crashing iron ore, scrap and finished steel prices
– Domestic automotive industry under pressure
– Sharp and persistent drop in oil and/or iron ore prices
– Tightening financial conditions pressuring auto sales driven by sub-prime financing
– Chinese restrictions in property market
– The Chinese Financial Crisis
– Unexpected sharp China RMB devaluation
– Increasing import differentials
– Economic downturn; especially in China or Europe reverberating to U.S.A.
– Weak demand in housing or automotive
Crude oil prices falling sharply
Higher interest rates
Strengthening U.S. dollar
Falling global flat rolled prices
Tariff resolution and/or 232 exclusions, especially Turkey reverting to original 25%
Increased domestic production capacity
Trade War Fallout
Turkey/emerging market contagion
Political & geopolitical uncertainty
Stock Market Crash
Declining rates of growth in manufacturing/demand destruction
Weakening global economics/PMIs
Crude oil prices falling sharply
Higher interest rates
Strengthening U.S. dollar
Falling global flat rolled prices
Tariff resolution and/or 232 exclusions, especially Turkey reverting to original 25%
Increased domestic production capacity
Trade War Fallout
Turkey/emerging market contagion
Political & geopolitical uncertainty
Stock Market Crash