It was another very strong week for the domestic steel market.
January MSCI flat rolled daily shipments rebounded sharply to 108.25k t/day, the highest since March 2014. Shipment data swings sharply from December to January, so keep perspective when you see a 34% MoM increase in shipments.

The more reliable data this month is YoY data showing a 4.5% gain in the daily shipment rate and a 9.7% gain in total shipments.


Strong January shipments translated into months-on-hand of 1.94 when adjusted to a daily shipment rate and 2.03 using raw data. M.O.H. hasn’t been this low since the first half of 2014.

Inventory is near multi-year lows.

The bullish MSCI data gets priority this week because of its domestic nature, but last week’s juggernaut Chinese aggregate financing data is the real headliner. To be clear, a juggernaut is defined as a huge, powerful and overwhelming force. China aggregate financing tracks the outstanding amount of credit extended to businesses and consumers. January data shows an explosion to $544 billion of aggregate financing and almost $300 billion of new loans.
January China Aggregate Financing and New Monthly Loans (USD)

Demand Pull Inflation – “Too much money chasing too few goods”
Goldman Sachs Commodities Research published a report on February 16th titled “China’s ‘Old Economy’ credit demand sends a remarkably bullish signal” highlighting strength in medium and long term loans for property developments, manufacturing capacity additions and infrastructure projects. The authors expect the lagged effect of these credit flows will provide a consistent and reliable boost to fixed asset investement and manufacturing in the coming months.
2016 Chinese Aggregate Financing, Chinese Iron Ore and TSI Midwest HRC

The chart above shows the spike in Chinese aggregate financing from January 2016 follwed by a strong run up in iron ore prices and then followed by last years 50% rally in US Midwest HRC prices. In the first quarter of 2016, HRC prices were in the doldrums and FGM was very concerned about the health of the domestic steel industry. As global ferrous prices started to rally and international availability plummeted, FGM identified this spike in aggregate financing as the catalyst that kicked off the global commodity reflation. It was this number that gave us confidence that the rally that was occuring across the ferrous landscape might have legs.
Now it is happening again, but this time at much lower inventory levels. Remember this……


Last week was our first look at February regional manufacturing PMIs and they were off the charts. The Empire Manufacturing Index jumped 12.2 points to 18.7 crushing expectations of 7.5 while the Philadelphia Fed outlook exploded to 43.3, the highest since 1984!!!!

Empire Manufacturing and Philadelphia Fed Business Outlook

The January NFIB Small Business Index remained at its multi-year high of 105.9 reached last month.
NFIB Small Business Index

January housing starts of 1.246m annualized beat expectations and were down from last month, but last month’s data was revised higher to 1.279m from 1.226m.
January Housing Starts

January building permits of 1.285m annualized units also beat expectations and were up from December’s upwardly revised 1.228m units.
January Building Permits

Inflation data is picking up with January CPI ex-food and energy at 2.3%. January unadjusted CPI printed 2.5%.
YoY January CPI Ex Food & Energy (left) & CPI (right)

It was a quiet week on the flat rolled front. SBB Platts and TSI kept Midwest HRC prices at $625/st.

European and Asian prices have persisted in a tight range at their highs for three months now.

HRC futures jumped last week.

Q2 moved up to $605/st, Q3 settled at $590/st and Q4 at $585/st.
March CME HRC Futures vs. TSI Daily Midwest HRC Price

Imported tons have been stuck in a tight range and have yet to influence the markets the way they did in 2015.

AISI Steel Capacity Utilization Rate and TSI Daily HRC Price

Utilization and production increased slightly to the highest levels since mid-2016.

A huge rebound in scrap prices dwarfed solid advances in iron ore.


The iron ore curve shifted $9/t higher remaining backwardated through 2017.

Turkish rebar gained 5%, Chinese rebar futures gained 4% and Black Sea billet gained 3.5%.

A solid week on the economic front as discussed above. Also of note was an increase in January industrial production. There were some disappointments with a drop in January capacity utilization, a weak YoY Core PPI report and a drop in mortgage applications.

The S&P 500 continued to move higher as did Europe. The Nikkei fell 1%.

Steel related stocks saw nice gains.

Schnitzer Steel Industries

Iron ore miners all gained with ore prices.

Base metals were mixed with nickel up 3.6%, while copper and zinc fell 2% and 4%, respectively.

LME Nickel

The dollar index remained quiet just below 101. The Turkish lira rebounded, while most other currencies were unchanged.

US Dollar Index

Turkish Lira

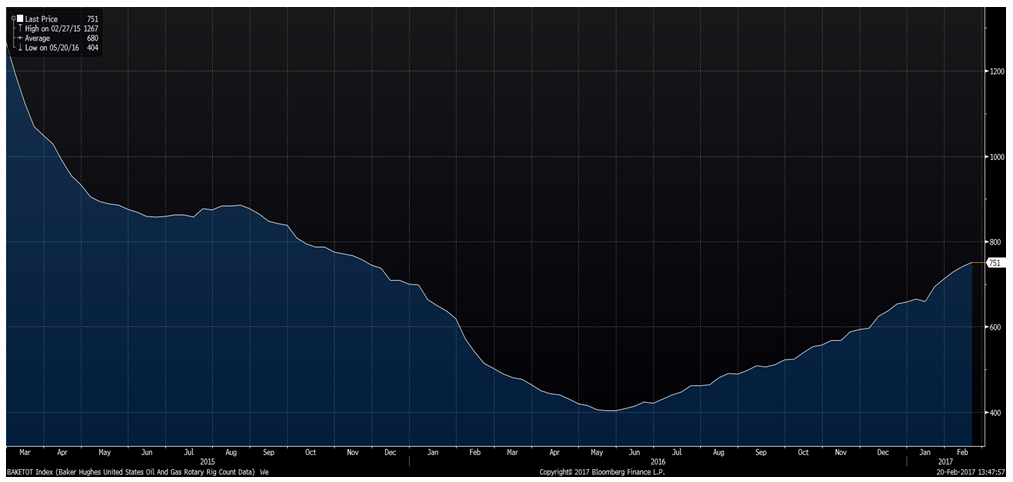
WTI crude oil futures were down about 1% to $53.40/bbl even as inventory levels continued to gain to new highs. Both the crude oil and iron ore inventory levels are making new highs at the same time prices continue higher. US rig counts continued higher to 751 while production was flat at 8.98m bbl/day. Natural gas slipped 6.5% while natural gas inventory fell as record warm February weather hit the country.

WTI Crude Oil Futures

Aggregate Energy Inventory (Blue) vs. WTI Crude Oil Futures

D.O.E. Crude Oil Inventory

D.O.E. Crude Oil Inventory Perspective (1982 – Present)

Baker Hughes US Rig Count
D.O.E. Crude Oil Production

D.O.E. Crude Oil Production Perspective (1984 – Present)

The US 10-year Treasury yield was flat at 2.41% while European rates fell.

U.S. 10 Year Bond Yield

The list below details some upside and downside risks relevant to the steel industry. The bolded ones are occurring or look to be highly likely. Upside risks look to be in charge.
Upside Risks:
– China pumping up its “old economy”
– Sharp raw materials rally
– Energy industry rebound
– Big rally triggered by price increases/low inventory/restocking
– President Trump’s agenda
– Infrastructure bill/long-term solution to highway spending bill
– China getting serious about curtailing steel production
– Transportation supply constraints
– Essar labor issues
– Post-election economic pick up
– Massive restocking (domestic and/or global)
– Unplanned domestic supply side disruptions
Downside Risks:
– Increasing oil and iron ore inventory levels
– US domestic producers bringing back on capacity
– Higher interest rates slowing residential construction and auto sales
– Tightening financial conditions pressuring auto sales driven by sub-prime financing
– Chinese restrictions in property market
– The Chinese Financial Crisis
– Unexpected sharp China RMB devaluation
– Rebound in import volumes
– Increasing import differentials
– Resumption of US dollar rally/currency issues/sovereign default
– U.S. (manufacturing) recession
– Falling ferrous raw materials and global finished steel prices
– Economic downturn, especially in China or Europe reverberating to U.S.A.
– Weak demand in housing or automotive