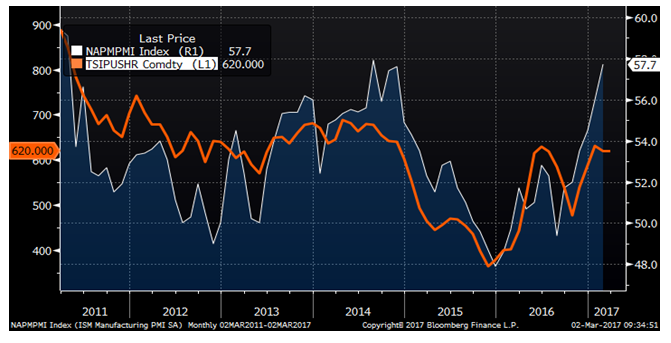
The February ISM PMI added 1.7 points to 57.7 from 56 in January and beat expectations of 56. 57.7 is the highest index print since 57.9 in August, 2014.
ISM Manufacturing PMI

The February 3rd WoW report did a deep dive into January’s ISM PMI report noting these points:
- Look for backlogs to improve over the next couple months.
- The backlog sub-index is 10.9 points below the new orders sub-index
- Producer and customer inventories are too low
- Manufacturing is much improved YoY
New orders and backlog of orders boomed to 65.1 and 57, respectively. Parsing through this data is worthwhile as it explains a lot of what is happening in the supply chain and what the near-term might look like. The new orders sub-index has been leading the index, while backlog has been stuck in contraction since last July.
ISM Manufacturing PMI New Orders (White) and Backlog (Orange)

Last month’s report examined the relationship between new orders and backlog concluding the relationship between the two sub-indexes was mean reverting, that the differential was reaching its limits and was likely to converge in the near term.
ISM Manufacturing PMI New Orders Minus ISM Backlog

It has converged 2.8 points in Feb. and in a very bullish way. New orders moved up to 65.1 and backlogs jumped to 57 signifying that production capacity limits are being breached overflowing into a seven point jump in backlog.
January ISM Manufacturing PMI

The (producer) inventories sub-index gained 3 points to 51.5 indicating some restocking has begun for the first time since June, 2015. This data point might be telling that producers are seeing and feeling strengthening demand. In response, producers look to be increasing inventory in preparation for an expected improvement in demand.
ISM Manufacturing PMI Business (White) and Customer Inventories (Orange)

One of the major continuing themes in this report has been how the low inventory levels across the manufacturing industry evidenced in the MSCI, ISM and Durable Goods reports could fuel a sharp flat rolled steel price rally if demand suddenly shifts higher. The latest PMI readings discussed so far may be early indications that the manufacturing industry’s supply chain has begun to shift back to historical norms.

Above is the January durable goods inventory data further confirming inventory levels have declined YoY. This data shows total inventory values are down 0.8% YoY, however, MSCI flat rolled inventory data was down 12% YoY. Flat rolled steel and other commodity prices are up significantly YoY. For instance, HRC was below $400/st in January 2016 and is now above $600/st. So this data confirms the inventory assumption discussed throughout, while also explaining the discrepancy being due to comparing dollars vs. tons.
If this restocking occurs, expect
- A big boost to GDP for a quarter or two
- A positive feedback loop that will push prices higher as lead times push out necessitating a reaction to increase inventory levels further perpetuating the loop
- Availability will become an important factor
The table below shows the ISM PMI and sub-indexes consistently strengthening across the board with customer inventories the lone hold out. Look at the difference between this report and December 2015!
ISM Manufacturing PMI with Sub-Indexes

The matrix below shows the ISM PMI released today and the regional PMIs released in the back half of February. Every regional report improved. In fact, there was surprising MoM growth in every report except Dallas. The Philadelphia Fed was the highest it been since 1984.

The ISM PMI and the regionals PMIs are charted below with the chart on the left normalized at 100 starting in February 2015 and the chart on the right using nominal data.
ISM Manufacturing PMI and Regional PMIs

The data shows a strong continued uptrend. Dallas stands out the most going from -31.8 to 24.5 YoY due to the healing of and nascent resurgence in the energy industry. The energy industry played a large role in steel demand from 2012-2015. Large volume buyers of pipe and tube would step in to set a floor during a number of flat rolled sell offs during these years. Also, the boom in tank car manufacturing led to record multi-billion dollar backlog for companies such as Trinity Industries and their competitors. The nascent rebound in the energy industry has been an upside surprise in past months and will continue to play an important role in steel prices.
China’s February Official Manufacturing PMI rose to 51.6 from 51.3 in January. The Caixan Manufacturing PMI gained 0.7 to 51.7 from 51 in January.
China Official Manufacturing PMI & Caixan Manufacturing PMI

The table below shows China’s Official Manufacturing PMI with sub-indexes. China’s profile is similar to the US in that inventory level (inventories of raw materials & stocks of finished goods) have been in contraction for years. Backlogs have also been retrenching since early 2012. The PMI continues to build with output and new orders near highs.

Last week’s report highlighted the importance of January Chinese aggregate financing data showing $544 billion was pumped into China’s economy, much of which was reportedly loaned to China’s “old economy” through medium and long term financing deals.
January China Aggregate Financing and New Monthly Loans (USD)

Consider the conclusions and expectations discussed above regarding February’s US ISM PMI data and the US manufacturing industry’s relatively low inventory level. If that plays out in China, look out!
Concerns over China’s economic health, the devalutation of the yuan, 250% debt to GDP ratio, ghost cities, wealth management products borrowing short and lending long, shadow banking issues, etc., etc. have been discussed as major concerns in this report through the years. Yet, so far there has been no Chinese financial crisis.
Following the 2008 financial crisis, the individual and collective global response was to boost liquidity via sharp increases in central bank asset purchases, also known as quantitative easing. Below is a chart of assets on the People’s Bank of China’s balance sheet.
China Central Bank Balance Sheet Assets

China’s leaders have either concealed from the world a financial crisis, or more likely, have taken preemptive measures to get ahead of a crisis by flooding the economy with liquidity.
Demand Pull Inflation – “Too much money chasing too few goods”
BUY THE DIPS!!!!
The tables below are this month’s PMI’s per country with the left side sorted highest to lowest and the right side sorted by region. The JP Morgan Global Manufacturiing PMI moved up two points to 52.9. The PMIs of Germany, Italy, Spain, Canada and the UK look strong all at or above 54. Brazil, South Korea and Turkey are in contraction.

Below is the same data as above filtered to the countries most relevant to the steel industry.

January construction spending fell 1% MoM, missing expectations of a 0.6% gain while December’s 0.2% drop was revised to a 0.1% gain. YoY, construction spending continues to trend higher.

Private nonresidential construction spending has been the strongest segment, now reaching all-time highs. Total nonresidential gained only 1.5% weighed down by weak government spending. This could change dramatically if President Trump is able to pass a robust infrastructure bill.

Private residential growth of 5.9% continues to be a positive for the economy. January new housing starts of 1.25 million annualized have plent of room for growth still remaining well below the multi-decade average of 1.45 million annualized starts

February U.S. auto sales were unchanged at 17.47m annualized units, in line with January’s sales.
US Auto Sales SAAR

February sales totalled 1.326 million units. The daily sales rate was down 1.1% YoY while YTD sales of 2.463m units was down 1.4%.

January inventory data was concerning at 85 days. February data fell 11 days to 74 days on hand, a big improvement. As long as employment stays strong, auto sales should remain near current levels.

This week’s report was held up to include the first day of the month data dump. The data below is the typical end of week data from last Friday.
Last week’s domestic flat rolled pricing was flat to mixed as the price increases work through the system. China and Black Sea HRC both rallied 2% while the TSI North European index fell 1%.

European and Asian prices have persisted in a tight range at their highs for three months now.

HRC Futures Curve
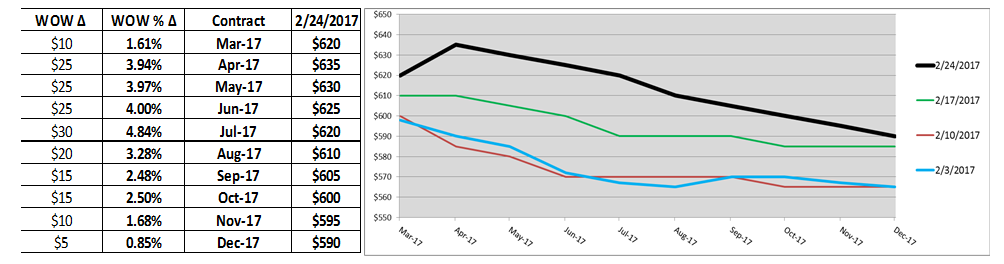
HRC futures were on the move higher last week with Q2 at $630, Q3 at $610 and Q4 at $595.
March CME HRC Futures vs. TSI Daily Midwest HRC Price

The February import license forecast plummeted to 763k flat rolled short tons.

AISI Steel Capacity Utilization Rate and TSI Daily HRC Price

Utilization and production increased to the highest levels since mid-2016.

There were huge gains in scrap prices last week. East Coast shred gained $56 or 21% to $317.5/mt and busheling prices rallied $47.5 or 15% to $372.5/lt. Coking coal gained 3.7%.


The iron ore curve shifted lower remaining backwardated through 2017.

Black Sea billet and rebar prices saw gains.


January’s Architectural Billing Index fell into contraction at 49.5. January existing home sales of 5.69 million improved MoM and beat expectations. January new home sales of 555k missed expectations, but improved MoM. New home supply is right at its twenty year average.
US New Single Family Supply Month on Hand

The January Durable Goods Report is detailed below. Black/red writing indicates a MoM increase/decline. Previous data revised up/down is colored green/red. If a cell has a red background with yellow writing, it indicates declining data that was revised even lower.

January new orders gained 1.8%, new orders excluding transportation slipped 0.2% and new orders excluding defense gained 1.5%. Shipments were down slightly or flat. Nondefense capital goods orders ex-aircraft slipped 0.4%.
YTD new orders were mostly up YoY, however, nondefense capital goods ex-aircraft slipped 5.3%.

China’s stock markets saw nice gains while the R.O.W. was quiet.

Steel related stocks were down with AKS falling almost 10%.

AK Steel

Iron ore miners fell with ore prices.

Base metals were mostly lower with nickel falling sharply.

LME Nickel

The dollar index remained quiet just above 101. The Mexican peso and South Korean won gained.

US Dollar Index

Mexican Peso

WTI crude oil futures gained back 1% to $54/bbl. Aggregate inventory fell while US production moved above nine million barrels per day for the first time since April, 2016.

April WTI Crude Oil Futures

Aggregate Energy Inventory (Blue) vs. WTI Crude Oil Futures

D.O.E. Crude Oil Inventory

D.O.E. Crude Oil Inventory Perspective (1982 – Present)

Baker Hughes US Rig Count

D.O.E. Crude Oil Production

D.O.E. Crude Oil Production Perspective (1984 – Present)

European treasury yields were under pressure as uncertainty in France’s upcoming election forced investors to the safe haven of German bunds. Yield fell globally in sympathy. The US Ten Year yield approached a pivotal post trump support level of 2.3%.

U.S. 10 Year Bond Yield

The list below details some upside and downside risks relevant to the steel industry. The bolded ones are occurring or look to be highly likely. Upside risks look to be in charge.
Upside Risks:
– China pumping up its “old economy”
– Scrap rally – another price increase coming?
– Energy industry rebound
– Border adjustment tax
– Big rally triggered by price increases/low inventory/restocking
– President Trump’s agenda
– Infrastructure bill/long-term solution to highway spending bill
– China getting serious about curtailing steel production
– Transportation supply constraints
– Essar labor issues
– Post-election economic pick up
– Massive restocking (domestic and/or global)
– Unplanned domestic supply side disruptions
Downside Risks:
– Political uncertainty
– Increasing oil and iron ore inventory levels
– US domestic producers bringing back on capacity
– Higher interest rates slowing residential construction and auto sales
– Tightening financial conditions pressuring auto sales driven by sub-prime financing
– Chinese restrictions in property market
– The Chinese Financial Crisis
– Unexpected sharp China RMB devaluation
– Rebound in import volumes
– Increasing import differentials
– Resumption of US dollar rally/currency issues/sovereign default
– U.S. (manufacturing) recession
– Falling ferrous raw materials and global finished steel prices
– Economic downturn, especially in China or Europe reverberating to U.S.A.
– Weak demand in housing or automotive