Effective immediately, Flack Steel has changed its name to Flack Global Metals. This move reflects a consolidation of recent acquisitions that include Consolidated Metal Products (CMP) in Columbia, SC, and JD Steel Products in Toledo, OH. In a move toward increasing global reach and an expanded product line, Flack Global Metals now offers bare, pre-painted and coated metals, including aluminum, stainless, and galvalume. The new website, www.flackglobalmetals.com, focuses on the company’s positioning as The Next Generation Service Center.
December MSCI flat rolled data released last week showed flat rolled shipments collapsing to 80.75 tons per day. That is the lowest December daily shipment rate since 2012. Shipments were down 15.7% MoM and 6.3% YoY. Daily Shipments were down 15.67% MoM but only 1.85% YoY.
Inventory levels increased 150k tons to 4,595,000 up 3.4% MoM, but down 15% or 818k tons YoY. It will be interesting to see if this build is the beginning of something or just a result of a poor shipping month.

M.O.H. jumped to 2.71 from 2.21. This is a bit shocking but it is also down a good amount YoY.

Months on hand is calculated by dividing inventory by shipments. So this big pop in the M.O.H. is not only a result of an increase in inventory, but more so because of the very low shipments in the denominator.
Let’s examine the MoM change in daily M.O.H. from November to December going back to 2006. There is a reliable seasonal jump of 0.55 weeks on average.

Here is what happens from December to January….

On average, adjusted M.O.H. falls 0.58 months from December to January so expect M.O.H. to revert back to November levels reflecting hopefully a strong shipping month and resulting in a reversion to the relatively very low inventory levels across the manufacturing supply chain.
The takeaway is don’t read too much into this report as showing a material change in the low inventory levels discussed regularly as a major issue and bullish theme in The Feldstein. There is a historically low level of inventory, which will likely put a bid in the market with the potential for a price spike if availability is threated due to a jump in demand, restocking push or some type of supply side disruption.
Speaking of which, it was reported in the SMU that “Essar Steel Algoma offered a new contract to the United Steelworkers Local 2251 asking hourly workers to accept a 10% wage cut, elimination of cost of living increases and cuts to paid vacations. The local union president says a strike vote is likely.” The time line is uncertain, but according to the article, February 20th would be when things could get hairy. While a strike or lock-out toward the end of February would affect the market, perhaps some tons that would be headed to Essar this and in coming weeks are pre-emptively pulled by buyers worried about the reliability of those tons. How many of those tons end up at Midwest mills in response to this news is something to consider.
In and of itself, this news probably isn’t going to have a major effect. The domestic market hasn’t seen a major supply side disruption or wave of disruptions since the spring of 2014. If you believe these supply side disruptions tend to occur in waves and it’s been a while, it might be worth watching if this is a one off event or the start of something larger. Considering the current state of inventory and consolidated producers, any material supply disruptions would wreak havoc on the industry.
Donald Trump was inaugurated as the 45th President of the USA last Friday. There is a tremendous amount of uncertainty surrounding Trump’s presidency. One issue I have seen discussed repeatedly is regarding some of Trump’s contradicting viewpoints. For instance, his economic advisers include members with a free market view while others have an (opposing) protectionist/nativist point of view. It will be interesting to see how this plays out, but maybe it is balanced so at the end of the day, President Trump can make the call.
Broad deregulation, some form of a tax cut, fiscal stimulus, including major infrastructure spending, and the repatriation of international profits are some of the fiscal policies publicized by President Trump. Regardless of which policies are implemented and how fast they take effect, the economy should have the wind at its back for a good 12-18 months as these different policies stimulate the economy.
It is worth noting that on the first Monday of his presidency, Trump focused on the US economy, trade and jobs. As you can see below, Mario Longhi, CEO of US Steel is seated three chairs to the left of the President. There seems to be a vacuum surrounding the Presidents politics and you are either with him or against him. So it’s clearly a positive for the steel industry to see Mr. Longhi at this table.

If you have ever heard the trading adage “don’t fight the fed,” then perhaps it is good to apply that same concept to the steel industry today. Like the “Bernanke Put” in the stock market during the QE years, is there now a “Trump Put” in US steel prices?
*Just before publication of this report, the Trump Administration announced they aim to rebuild infrastructure with American goods (i.e. American made steel). Also, that the Keystone pipeline with be built with US made steel.
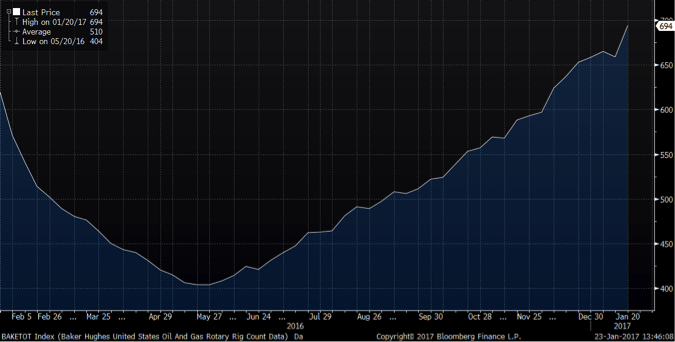
The Baker Hughes Rig Count added 35 rigs; the most rigs in a week since August of 2011. According to a Wall Street Journal article, “preliminary capital-spending plans released in recent weeks by more than a dozen American shale drillers show an average 60% budget increase for the group.”
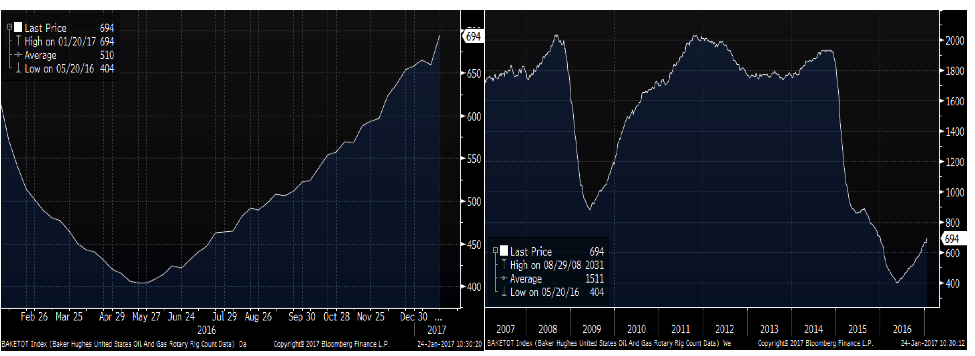
On another front, this past Sunday OPEC and Russian officials reported making progress on their promises to cut back production to allow prices to rise. Of course, rising oil prices have been a major catalyst behind the increase in rig counts.
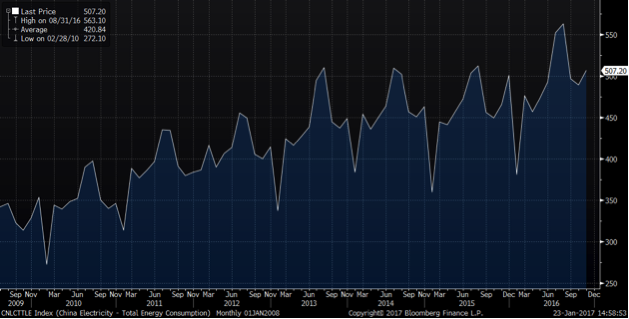
Another big YoY change is that China’s economy seems to be in much better shape. Fourth Quarter GDP beat estimates at 6.8%. Iron ore and rebar prices remain near their highs. Property prices in tier I cities are booming. Electricity consumption, a favorite metric for evaluating China’s economic health, has shifted to another level with strong YoY growth.
China Electricity Consumption
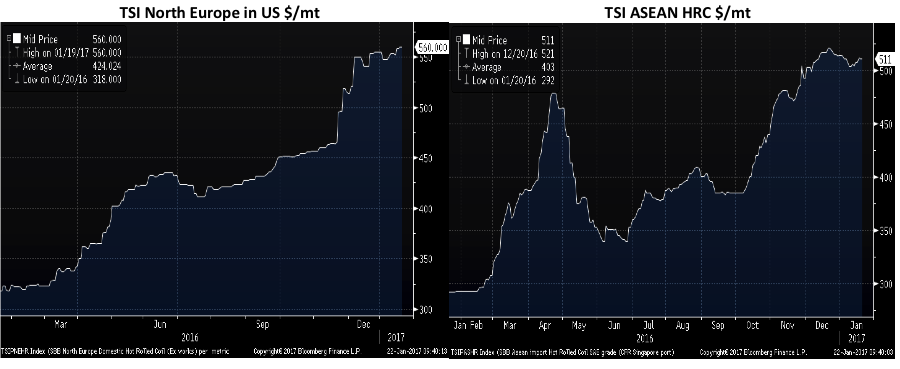
Global flat rolled prices gained again with only the SBB Platts Black Sea HRC down. SBB Platts, who did the best job tracking HRC prices in 2016, bumped the US Midwest HRC price to $630/st.

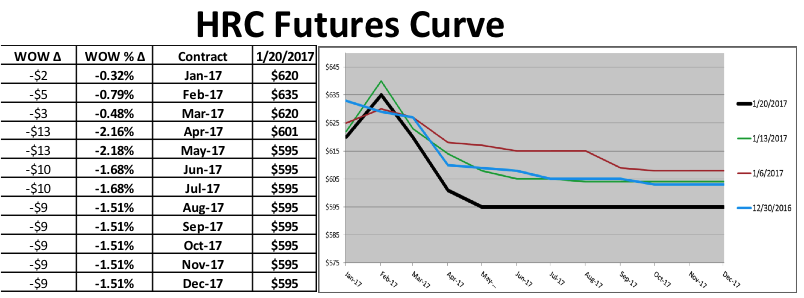
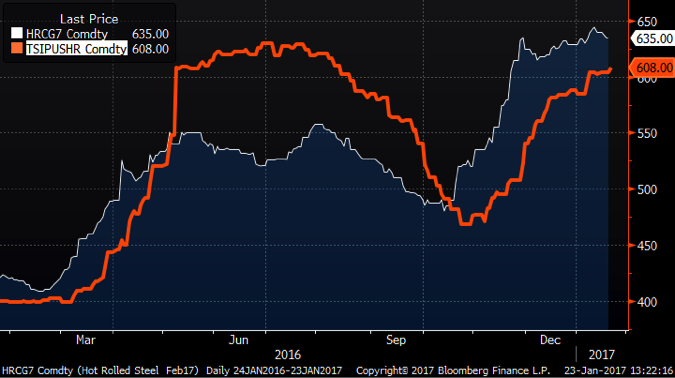
HRC futures were under pressure last week.
February CME HRC Futures vs. TSI Daily Midwest HRC Price
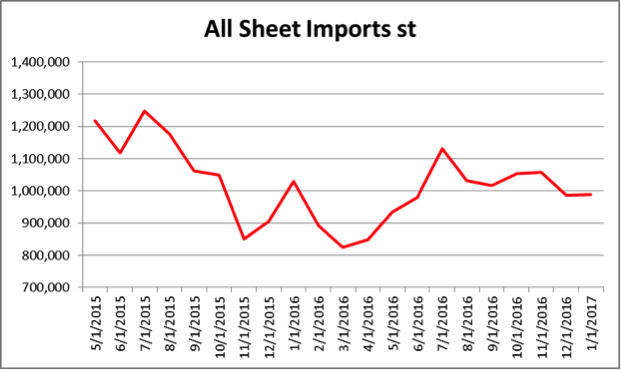
Import data continues to be weak with the fall in HRC imports eye-opening. HRC imports averaged 246k st per month from Jan. – Nov. 2016. December’s data is forecast to be almost 90k tons and January 133k tons below this monthly average.
AISI Steel Capacity Utilization Rate and TSI Daily HRC Price
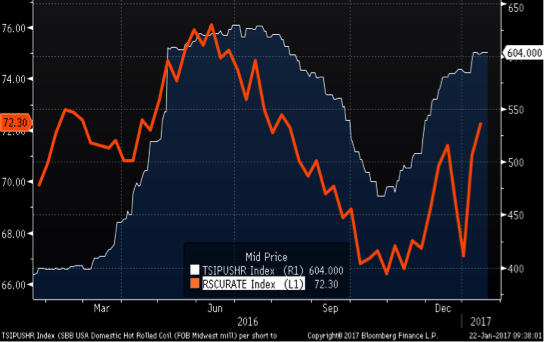
Utilization and production gained nicely.

Coking coal and European scrap prices fell.


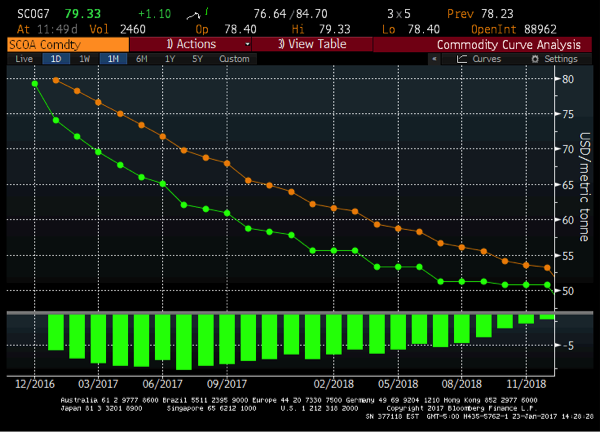
US rebar gained along with Chinese physical rebar prices, while May Chinese rebar futures fell with Black Sea billet.

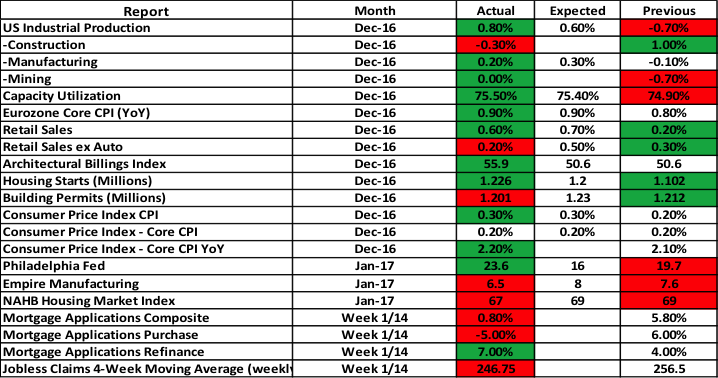
Economic data continues to impress with December Industrial Production rebounding, a big gain in the ABI Index and a solid increase in housing starts. The Philadelphia Fed surprised to the upside while the Empire Manufacturing Index fell back a bit. The Core CPI Index gained 2.2% YoY, up 0.1% MoM.
The S&P 500 was flat and China gained. Europe and Japan slipped less than 1%.

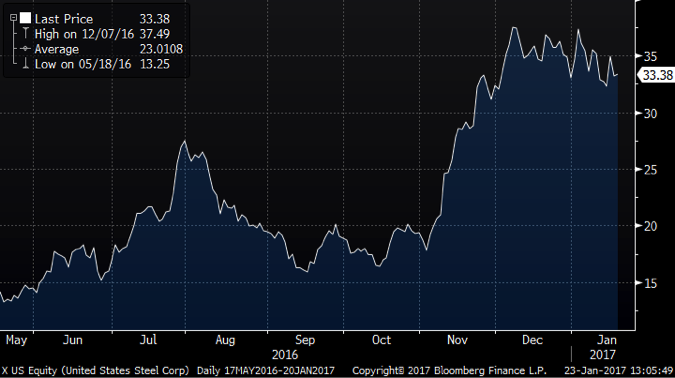
Steel stocks were mixed.

US Steel
Iron ore miners rallied except for CLF.

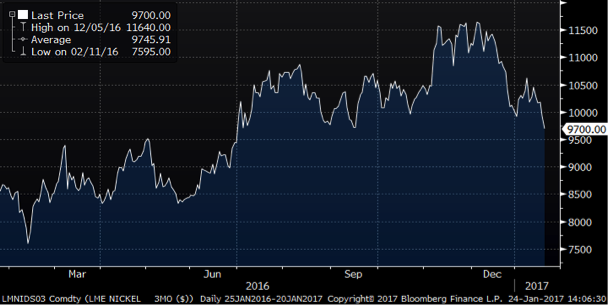
Nickel fell 7% and copper was down about 2.5%. Aluminum gained 2% as it moves to new highs.

LME Nickel
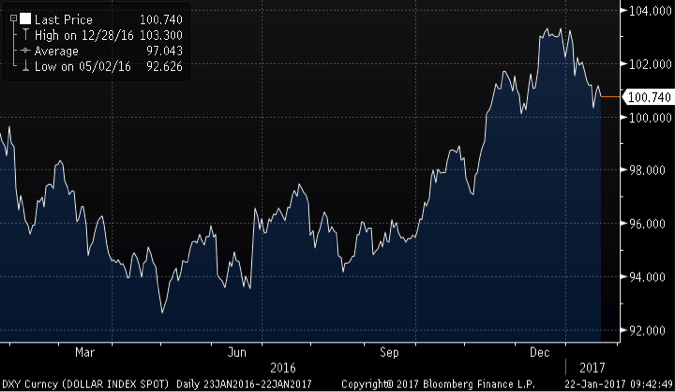
The dollar rally continued to come off highs with the euro a major benefactor. The British pound gained 3% and the Brazilian real was up 1.35%. The Turkish lira and Canadian dollar both fell just over 1%.

US Dollar Index
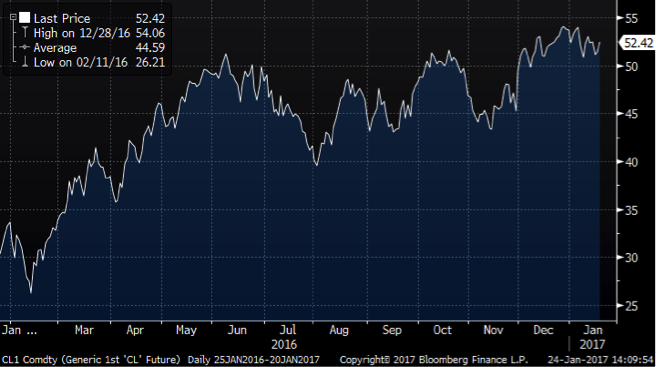
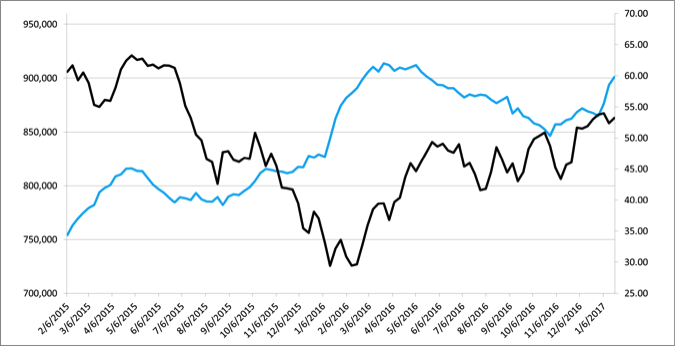
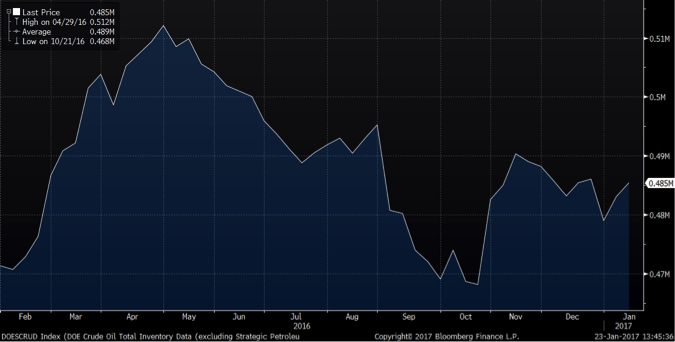
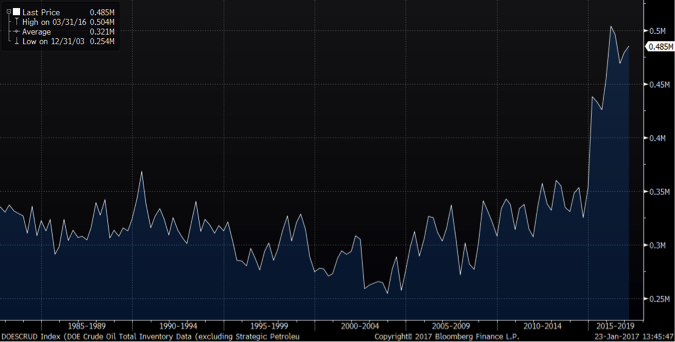
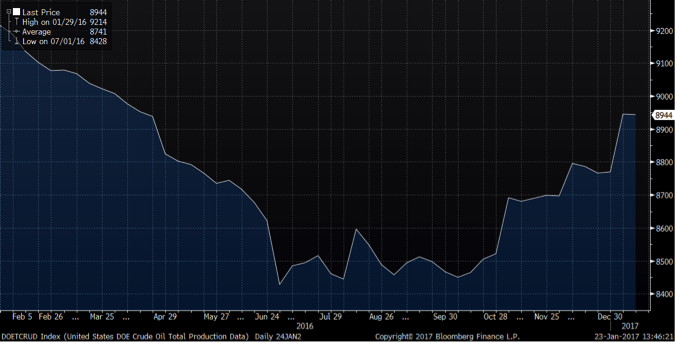
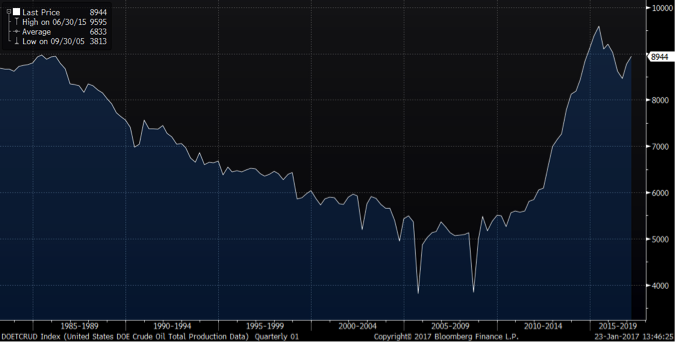
WTI crude oil futures headed back up to close the week at $53.22/bbl, while natural gas futures fell to $3.20/mbtu. The US rig count gained 35 rigs to 694, the highest since January 1st, 2016. There was a noticeable build in gasoline inventory and the aggregate inventory levels. Production was flat.

WTI Crude Oil Futures
Aggregate Energy Inventory vs. WTI Crude Oil Futures
D.O.E. Crude Oil Inventory
D.O.E. Crude Oil Inventory Perspective (1982 – Present)
Baker Hughes US Rig Count
D.O.E. Crude Oil Production
D.O.E. Crude Oil Production Perspective (1984 – Present)
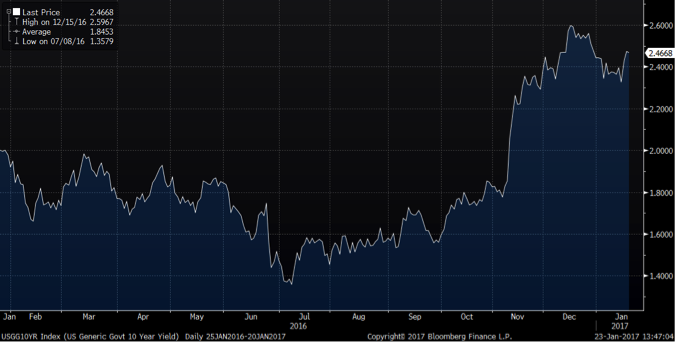
The US ten year rose off the 2.4% level to 2.47%. Rates gained across the board. Five year inflation expectations are getting very close to 2%.

U.S. 10 Year Bond Yield
The list below details some upside and downside risks relevant to the industry. The bolded ones are occurring or look to be highly likely. Upside risks look to be in control at the moment.
Upside Risks:
– Big rally triggered by price increases/low inventory/restocking
– President Trump’s agenda
– Energy industry rebound
– Essar labor issues
– Infrastructure bill/long-term solution to highway spending bill
– China getting serious about curtailing steel production
– Post-election economic pick up
– Massive restocking (domestic and/or global)
– Unplanned domestic supply side disruptions
– China pumping up its “old economy”
– El Nino weather disrupting logistics in the southern hemisphere
Downside Risks:
– The Chinese Financial Crisis
– China RMB devaluation
– Rebound in import volumes
– Increasing import differentials
– Resumption of US dollar rally/currency issues/sovereign default
– Higher interest rates slowing residential construction and auto sales
– Tightening financial conditions pressuring auto sales driven by sub-prime financing
– Oil and/or iron ore slide
– U.S. (manufacturing) recession
– Falling ferrous raw materials and global finished steel prices
– US domestic producers bringing back on capacity
– Economic downturn, especially in China or Europe reverberating to U.S.A.
– Weak demand in housing or automotive
