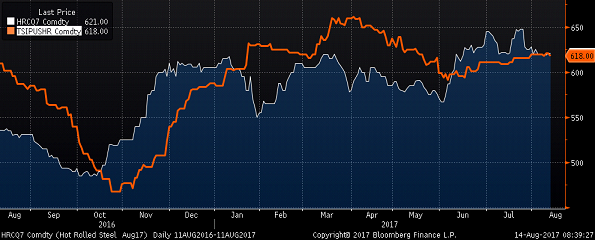
The Midwest HRC price continued the rally that began at $365/st in December, 2015. After correcting 10% from the $660 high set on March 20th, 2017, the TSI Daily Midwest HRC Index has bounced off a low of $591 closing this past week flat at $611 while the July CME future price settled at $625 at week’s end. The rebound is largely due to a mix of the recent domestic mill price hike announcements and pending uncertainty caused by the Section 232 Investigation. Last week’s much better than expected ISM PMI at 57.8 was up 2.9 point MoM indicating a second wave of strength is ahead. Lead times look to have moved out a full week and held since the first announcement, a positive sign that the price increase is holding and that another hike may be coming soon.
July CME HRC Futures vs. TSI Daily Midwest HRC Price

Grounded in the conclusion that Midwest HRC prices have been in a multi-year bull market, the “buy the dip” theme discussed since January remains intact as fundamental data continues to be constructive. An announcement regarding the Section 232 Investigation into steel is anxiously expected by all those attached to the steel market. However, the investigation itself has already had a strong effect on the market. Concerns over the outcome have led steel buyers to shift to a more domestic focused purchasing strategy while importers are faced with having to evaluate their willingness to share or take on policy risk. June imports are forecast to see a sizable increase, perhaps in an attempt to get tons into the country ahead of a punitive policy. However, the current uncertainty should result in a sharp drop off in imports in the coming months.
We see the following issues as the foundation of our current view:
As of Friday’s settlement, July CME Midwest HRC futures fell $15 to $625/st following July’s first CRU print. August was down $13 to $632 and September fell $10 to $630. Q4 2016 slipped $5 to $635. Q1 2018 was flat at $630 and Q2 2018 gained $2 to $627.

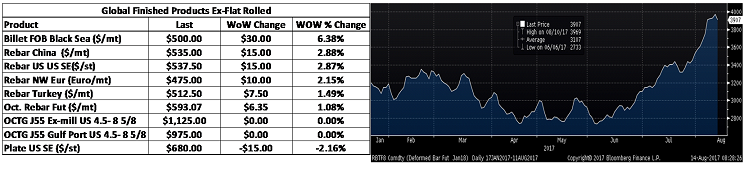
Asian HRC prices continue to rally and Black Sea HRC played some catch up gaining almost 4% on the week.

The TSI ASEAN price has quietly rallied within spitting distance of highs seen last December. It’s been quite a stealth rally and US buyers should pay attention. The TSI North Europe flattened last week along with the euro currency.

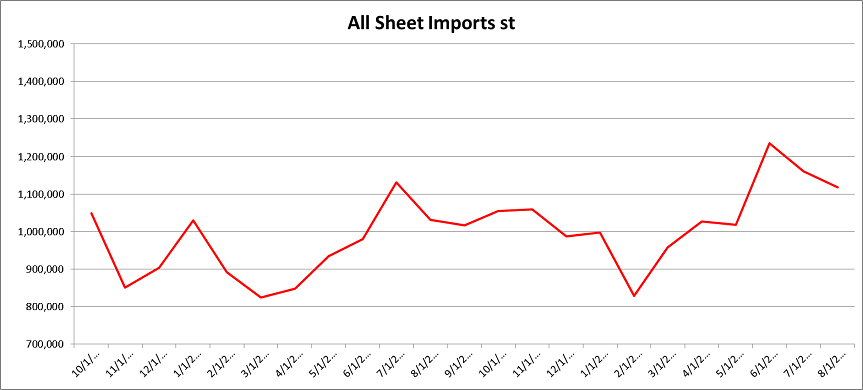
June import licenses are forecasting a huge MoM gain, most likely in anticipation of tariffs to be applied by the Trump administration. We are expecting a sharp drop off in flat rolled imports in the short-term as import deals have been readily declined due to the complications surrounding the uncertainty of the 232 Investigation.

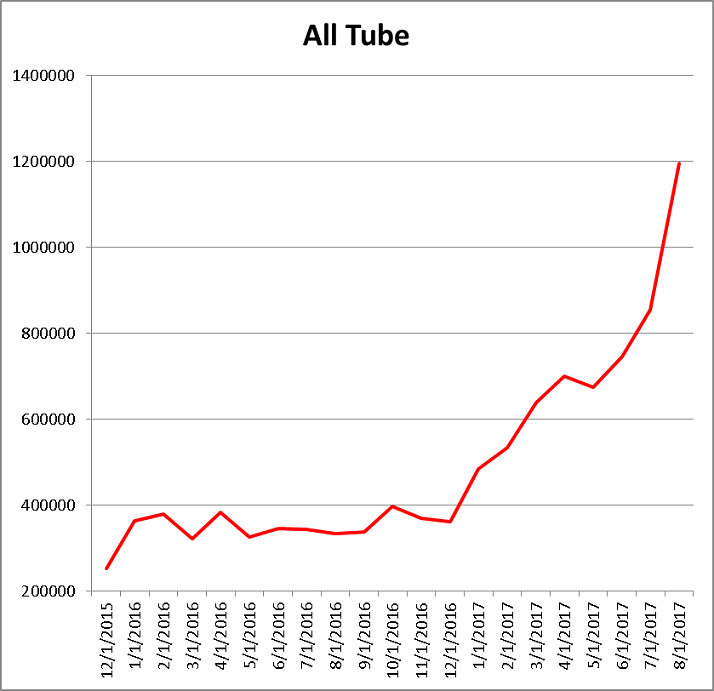
Tube imports have exploded this year and look to continue to reach news highs in June. This could be an area where the government policy cracks down. We expect tube imports to reverse in the short term as well.
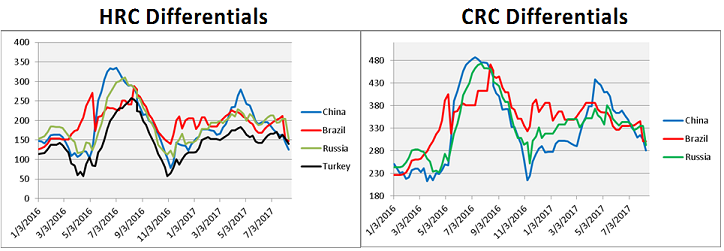
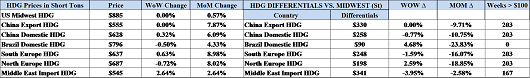
Below are HRC, CRC and HDG prices and differentials using pricing from SBB Platts. US/China differentials have declined dramatically since May. The US/Brazil differential moved up about 3.5% to $197.
HRC prices in Mexico, China and East Asia moved up while prices in Japan and Brazil were under pressure.
Chinese, East Asian and Mexican CRC was higher.
Chinese and European HDG prices moved higher.
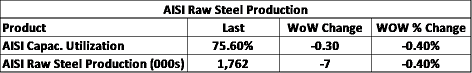
AISI Steel Capacity Utilization Rate and TSI Daily HRC Price
AISI capacity utilization slipped again to 73.6%.

Raw materials, except Brazilian pig iron, were flat or moved higher.

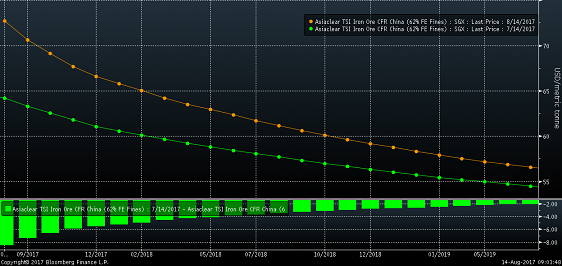
Ore and scrap continued to rally last week.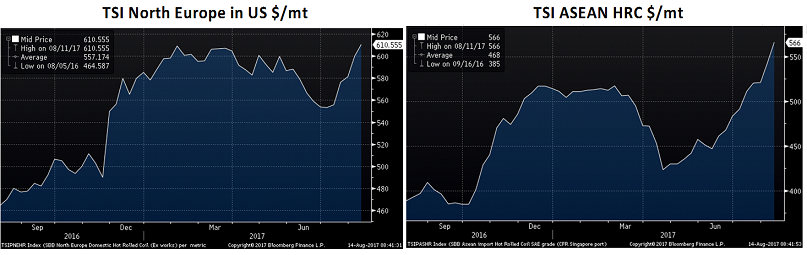
The iron ore curve has shifted higher vs. early June and the curve continues to move towards a steeper backwardation.
Rebar was strong. OCTG slipped 4%.
Last week’s Week Over Week Report did a deep dive into the ISM PMI, US auto sales, construction spending and global PMIs. The ISM Non-Manufacturing Index was also better than expected at 57.4. The June Employment Report surprised to the upside with a gain of 222k jobs and two-month net revisions adding 47k jobs. The unemployment rate worsened to 4.4% due in part to the participation rate increasing to 62.8% from 62.7%.
US Employees Nonfarm Payroll Index

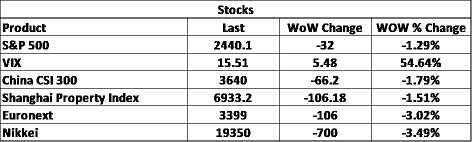
Stock markets were quiet across the globe.

Steel stocks were little changed except for AK Steel slipping 9.5% and US Steel down 3%.
AK Steel

BHP and Rio Tinto gained while Cleveland Cliffs was off 3%.
Base metals were mixed with nickel and copper down and zinc adding 1.75%.

LME Nickel 3 Month Rolling Forward

September CME Copper Futures
Currencies were quiet. The Japanese yen fell 1.4% after Governor Kuroda made dovish statements. There was pressure on the Turkish lira and Russian ruble.
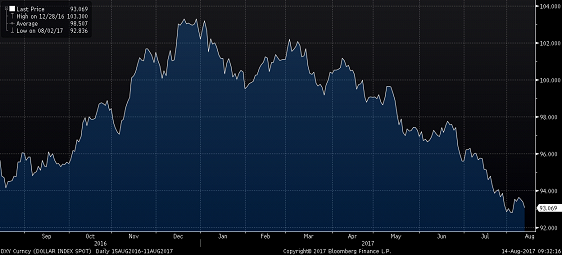
US Dollar Index

Japanese Yen
Turkish Lira


WTI crude oil gave back 4% on the week to close at $44.23/bbl. Despite the drop in price, the US rig count added 12rigs. Oil inventory was down sharply with crude inventory down 1.25% and aggregate inventory down 1.3%. Production was up almost 1%. Natural Gas was down 5.6% to $2.86/mbtu.
August WTI Crude Oil Futures

Aggregate Energy Inventory (Blue) vs. WTI Crude Oil Futures

D.O.E. Crude Oil Inventory

D.O.E. Crude Oil Inventory Perspective (1982 – Present)

Baker Hughes US Rig Count

D.O.E. Crude Oil Production
D.O.E. Crude Oil Production Perspective (1983 – Present)

10 year Treasury rates continued to move higher with the German 10 year Treasury yield breaking above 50 basis points. The US 10 year Treasury yield followed higher at 2.39%.

U.S. 10 Year Bond Yield

German 10 Year Bond Yield

The list below details some upside and downside risks relevant to the steel industry. The bolded ones are occurring or look to be highly likely. The upside risks look to be in control.
Upside Risks:
– Section 232 Investigation
– Low inventory levels/domestic or global restocking
– Flatbed trucking availability
– China pumping up its “old economy”
– Energy industry rebound
– Weaker dollar
– Border adjustment tax
– Big rally triggered by price increases/low inventory/restocking
– President Trump’s agenda
– Infrastructure bill/long-term solution to highway spending bill
– China getting serious about curtailing steel production
– Transportation supply constraints
– Post-election economic pick up
– Unplanned domestic supply side disruptions
Downside Risks:
– Political uncertainty – Reflation trade reversing
– Increasing oil and iron ore inventory levels
– Sharp and persistent drop in oil and iron ore prices
– Automotive industry under pressure
– US domestic producers bringing back on capacity
– Higher interest rates slowing residential construction and auto sales
– Tightening financial conditions pressuring auto sales driven by sub-prime financing
– Chinese restrictions in property market
– The Chinese Financial Crisis
– Unexpected sharp China RMB devaluation
– Rebound in import volumes
– Increasing import differentials
– US dollar rally/currency issues/sovereign default
– Falling ferrous raw materials and global finished steel prices
– Economic downturn, especially in China or Europe reverberating to U.S.A.
– Weak demand in housing or automotive