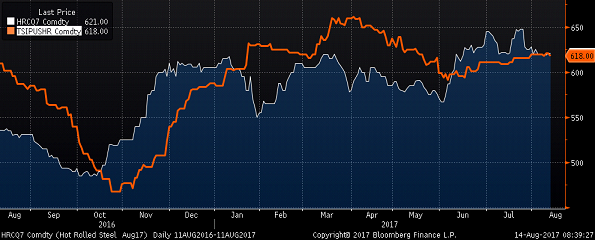
The Midwest HRC price continued the rally that began at $365/st in December, 2015 with a second round of price increase announcements kicked off by California Steel on July 18th. After correcting 10% from the $660 high set on March 20th, 2017, the TSI Daily Midwest HRC Index has bounced off a low of $591 closing this past week unchanged at $616 while the August CME future settled at $625 down $20. Last week brought significant gains in scrap and iron ore prices.
August CME HRC Futures vs. TSI Daily Midwest HRC Price
Expectations grew that a resolution or comment about the Section 232 investigation would occur at President Trumps July 25th rally in Youngstown, Ohio. That night, President Trump told the Wall Street Journal his administration was “waiting till we get everything finished up between healthcare and taxes and maybe even infrastructure” before a decision on steel trade policy. While the issue still hangs over the industries head, the new time line has raised significant doubts about the likelihood of a material change in policy.
We see the following issues as the foundation of our current view:
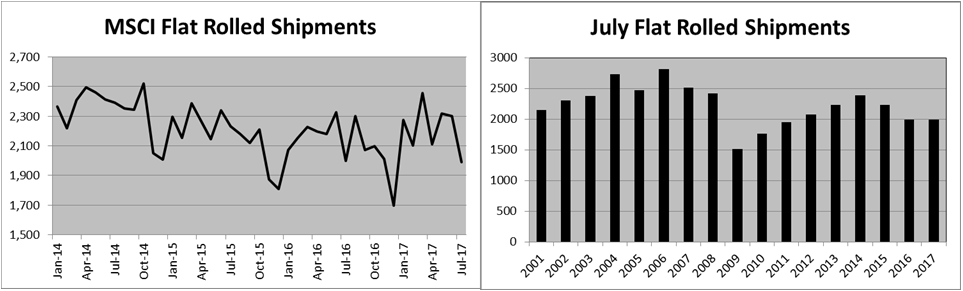
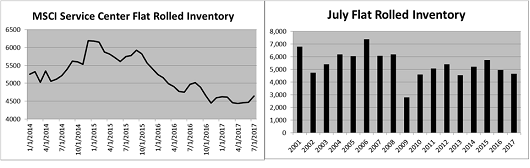
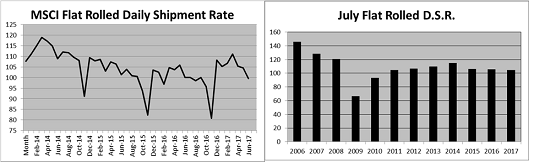
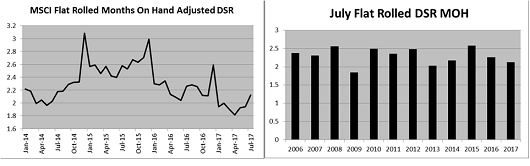
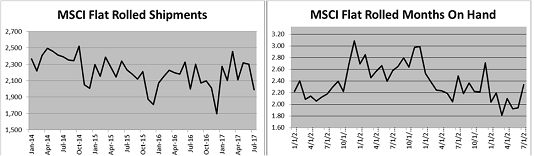
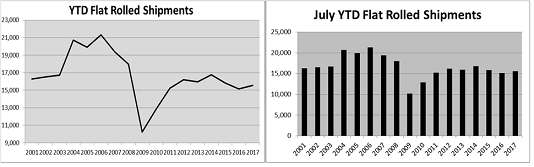
-Persistently low flat rolled inventory evidenced in the MSCI, ISM and Durable Goods reports
-A global uptrend in manufacturing purchasing managers indexes
-Conditions ripe for a restocking
-A rebounding US energy industry
-Sharp drop in imports in the second half of 2017
July’s ISM Manufacturing PMI was down 1.5 points to 56.3, but remains near multi-year highs.
ISM Manufacturing PMI (white) and TSI Daily Midwest HRC Index (orange)

Most sub-indexes moved lower.
ISM Manufacturing PMI


New orders remained north of 60.4 while backlog at 55 remains in solid territory.
ISM Manufacturing PMI New Orders (white) and Backlog (orange)

Producer inventories inched up to 50 while customers’ inventories slipped below 50 to 49 and is characterized as “too low.”
ISM Manufacturing PMI Producer (white) and Customers’ Inventories (orange)

Below is the ISM Manufacturing PMI by month with sub-indexes. The index has been pretty steady with the most obvious takeaway relating to the persistent sub 50 prints in the two inventory sub-indexes.
Regional manufacturing PMIs are below. Energy plays a critical and outsized role in steel demand. With the Dallas and Kansas City regions dominated by the energy industry, paying extra attention to these two reports is warranted. Both of those PMIs continue to be positive with the Dallas Fed report gaining 1.8 to 16.8 and the K.C. report falling 1 to 10. The Richmond Fed’s survey was up 3 to 14. The Chicago, Philadelphia and Empire reports were all off very strong numbers last month, but remain in healthy territory.
The colors in the table above correspond to the appropriate PMI index below. The chart on the right normalizes the data.
US seasonally adjusted annualized auto sales of 16.69m were up MoM, but missed expectations of a 16.8m annualized rate.
US Auto Sales SAAR
The daily auto sales rate (DSR) was down 5.5% MoM and 8.5% YoY for North American dealers and down 8.2% MoM and 6% YoY for European automakers, while Asian automakers saw their D.S.R. increase 7.7% YoY and 1.1% MoM. Year-over-year year-to-date sales are down for all three regions. Nissan is the only major automaker seeing YoY growth YTD.
Without a sharp drop-off in employment, a collapse in auto sales seems unlikely.
US Auto Sales (white) and the Inverted Unemployment Rate (orange)
This chart shows the 3 month moving average of the actual (non-annualized) monthly auto sales.
US Monthly Auto Sales 3 Month Moving Average

U.S. light vehicle inventory cut five days to 69 days according to WardsAuto.

FCA and Nissan were the only automakers to see inventory increase. GM is the only automaker whose days-on-hand inventory is abnormally high going back to January 2014.
Wards Auto Inventory Data per Auto Manufacturers
GM is the only automaker whose days-on-hand inventory is abnormally high going back to January 2014.
Wards Auto Inventory Days On Hand
June seasonally adjusted construction spending missed expectations of a 0.4% gain instead falling 1.3% MoM. June spending gained 1.6% YoY.
June US Construction Put in Place
Year-to-date total construction spending through June was up 4.8% YoY. 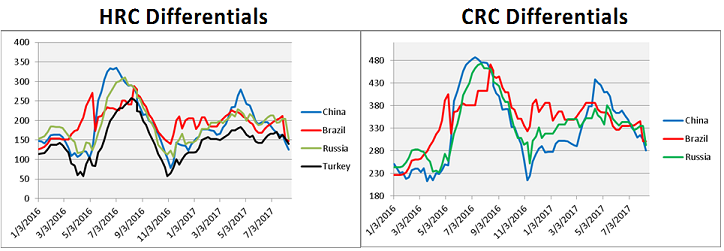
YTD private construction spending through June was up 8.04% YoY.

YTD private residential construction spending through June was up 11.38% YoY.

YTD private non-residential construction spending through June was up 4.48% YoY.
YTD public construction spending was down 5.4% YoY, which had a big influence on the weaker than expected report. Upward momentum in construction spending continued with YTD total spending, total private spending and private non-residential spending reaching new all-time highs.
-A global uptrend in manufacturing purchasing managers indexes
Global manufacturing PMIs were mostly lower with three countries below 50. Europe and the US continue to be at the top of the leader board (table on right sorted highest to lowest) while Asian countries made up the bulk of the bottom half. Nevertheless, not much change MoM across the board.

European manufacturing PMIs remain strong.
Eurozone (white), German (blue), Italian (green), French (yellow) and Spanish (red) Manufacturing PMIs
The top global economies all saw their PMIs move marginally lower.
US (white), German (blue), Chinese (green) and Japanese (red) Manufacturing PMIs

China saw mixed reports in July with the Caixan Manufacturing PMI gaining 0.7 points to 51.1, while China’s Official Manufacturing PMI slipped 0.3 points to 51.4.
China Official (white) and Caixan (orange) Manufacturing PMIs

This table shows China’s Official PMI and its sub-indexes. Similar to the ISM Manufacturing PMI, inventory levels remain depleted. Production and business expectations gained to 59.1.
China Stocks of Finished Goods (white) & Inventories of Raw Materials (red)
China New Orders (white) & Backlogs of Orders (red)

As of Friday’s settlement, the August CME Midwest HRC future ended the week down $20 to $625/st in response to President Trump’s statements discussed above. The September future lost $19 to $626 and Q4 2016 futures shed $20 to $624. Q1 2018 lost $10 to $628 and Q2 2018 lost $7 to $629.
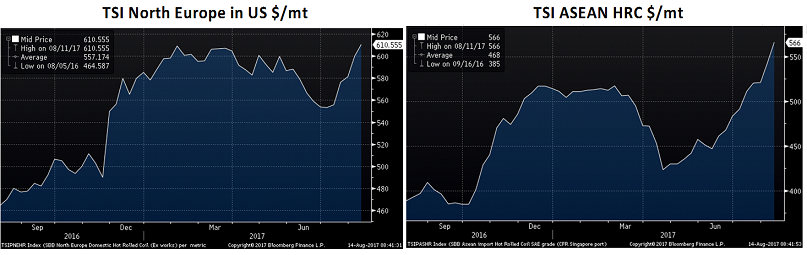
Flat rolled prices were mostly higher with Asian prices still leading, although at a slower pace than in previous weeks.

The TSI ASEAN HRC Index is right back up to the highs reached last December. The TSI North European HRC Index added another $5 after spending most of July flat at recent lows.

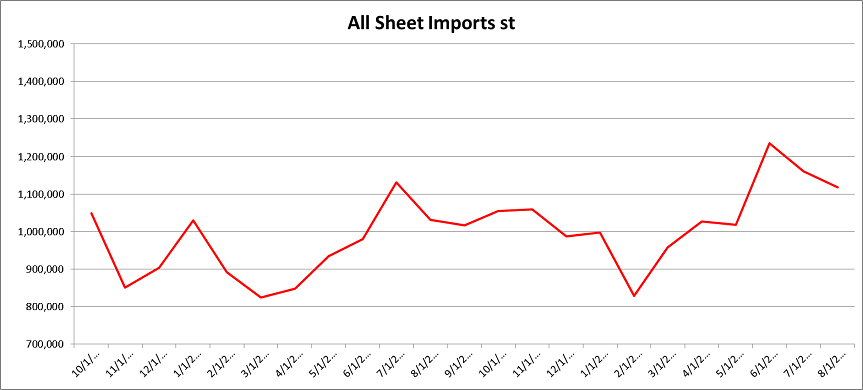
Import licenses are forecasting a huge MoM gain again in July, most likely in anticipation of tariffs to be applied by the Trump administration. We are expecting a sharp drop off in flat rolled imports in the short-term as interest in import deals has been subdued on both sides due to the complications surrounding the uncertainty of the 232 Investigation and global price increases.

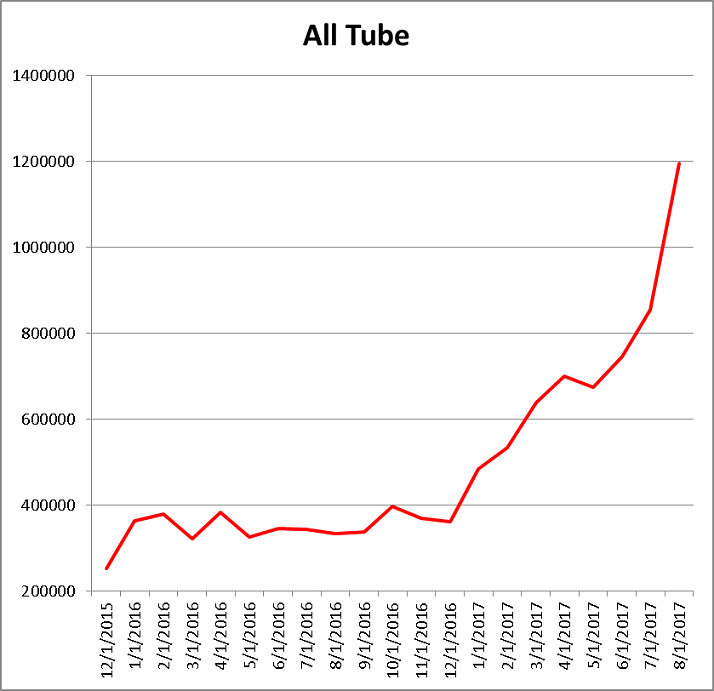
Tube imports have exploded this year and look to continue to reach news highs in July. This could be an area where government policy really cracks down. We expect tube imports to reverse in the short term for the same reasons as flat rolled imports.

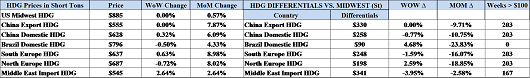
Below are HRC, CRC and HDG prices and differentials using pricing from SBB Platts. US/China differentials have declined dramatically since May.

Global HRC prices continue to move higher in the US, China, East Asia, Brazil and Europe.

European CRC was up.

HDG prices inched up in Brazil and Europe.
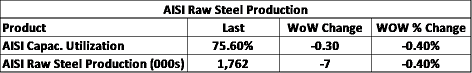
AISI Steel Capacity Utilization Rate and TSI Daily HRC Price

At 76.1%, the AISI capacity utilization reached its highest level since June 13th, 2016.

Ferrous raw materials have been rallying sharply over the past few weeks. Scrap prices saw nice gains while iron ore added to its rally.

Below is an excerpt from AK Steel’s earning conference call from last Tuesday:
Q: Novid Rassouli: “I just wanted to see if you can help us understand the impetus for the price hikes or what’s driving that?”
A: Roger K. Newport: “The big driver of that is what’s happening on the cost front, what’s happening on the raw material front. That’s going to be the biggest driver. It’s how we look at it is we want to be selling products that are making reasonable margin and as costs go up, the price has to follow.”
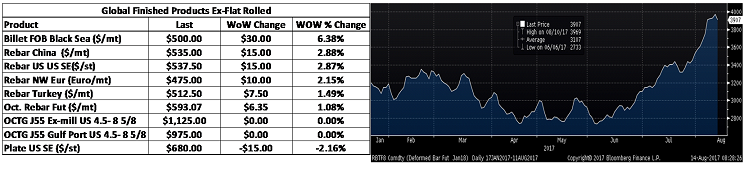
In fact, when comparing the price changes of all these products since June 1st, you’ll see Midwest HRC prices have moved the least relative to the other ferrous related commodities on the list. From this point of view, not only are the price increase announcements justified, but also one can expect that there is room for Midwest HRC to run higher, regardless of the Section 232 outcome.

The TSI Turkish Scrap index broke out to new recent highs.

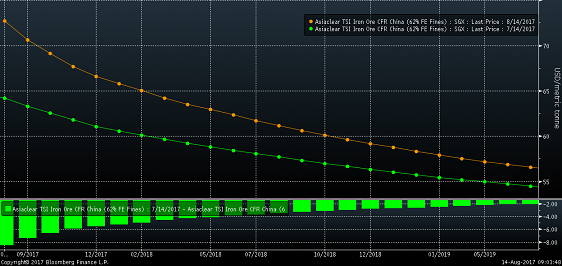
The iron ore curve has shifted higher vs. late-June and the curve continues to move towards a steeper backwardation.

Turkish rebar prices gained 6.6% leading rebar prices higher. Black Sea billet gained 3%.

Last week, the US Federal Open Market Committee announced no change to monetary policy. The FOMC’s statement indicated they would begin to roll back the Fed’s balance sheet in September.
New orders for durable goods rose 6.5% in June, beating expectations of a 3.9% gain. However, much of the gain was a result of a 131.2% increase in new orders for aircrafts reported by Boeing. New orders for durable goods excluding transportation rose only 0.2%, missing expectations of a 0.4% gain. May data was revised higher to a 0.6% gain from a 0.3% gain. New orders for capital goods saw a 19% increase, again the bulk of which is tied to new aircraft orders. When excluding aircraft, new orders for capital goods fell 0.1%, missing expectations of a 0.3% increase. May data was revised higher to 0.7% from 0.2%.

Inventory levels were down MoM in every category except fabricated metal products.

Looking at YTD new orders figures, June 2017 is up about 5% YoY in all three aggregated categories. Primary metals and fabricated metals are up 10% and 8% YTD, respectively.

The July Kansas City Fed Index fell a point to 10, missing expectations of 12. The July Richmond Fed Index gained three points to 14, beating expectations while June’s report was revised higher to 11 from 7.
June existing home sales fell to an annual rate of 5.52m units, missing expectations. Sales of new homes increased to a 610k unit SAAR in June, just below expectations.
The May Case-Shiller 20 City Home Price Index rose 5.69%, missing expectations; however April’s print was revised higher to 5.77%.

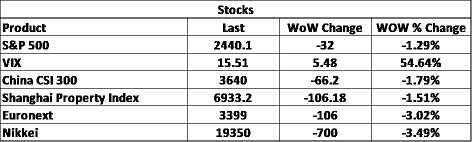
Stocks were quiet in response to the FOMC’s policy announcement.

S&P 500 Futures

Steel stocks were mostly lower following the disappointing development on the Section 232 front.

AK Steel

Iron ore stocks were mostly higher along with ore prices. CLF gave back 2.6%

Nickel gained over 7% while copper broke above resistance to close the week up over 5.6%.

3 Month LME Nickel Future

August CME Copper Future

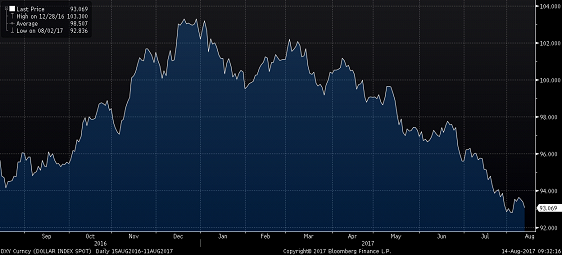
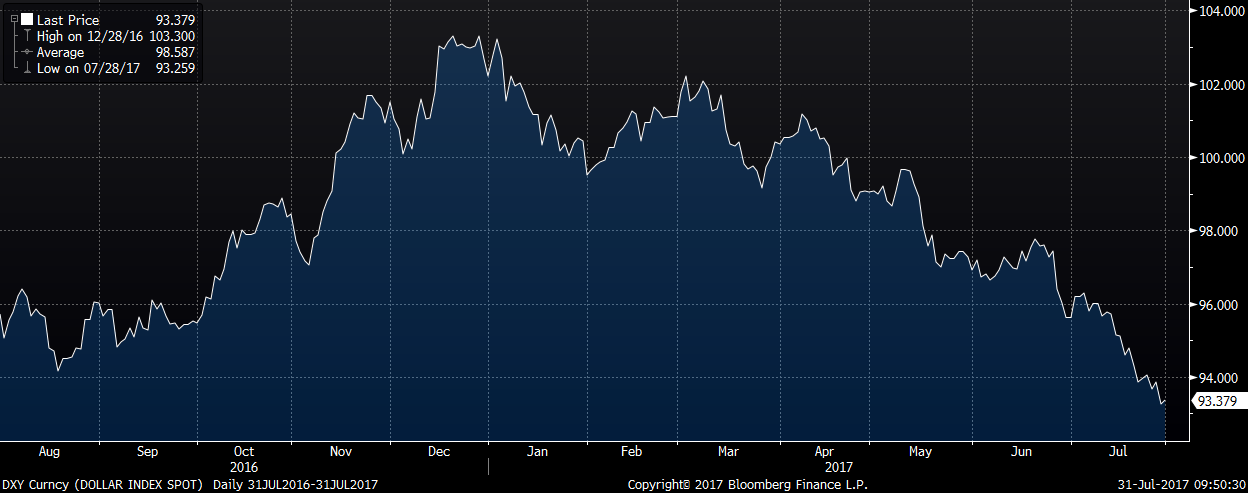
The US dollar continued lower closing the week at 93.26. The British pound gained 1%, while the rest of the complex saw little change.

US Dollar Index
Britsh Pound Spot

-A rebounding energy industry
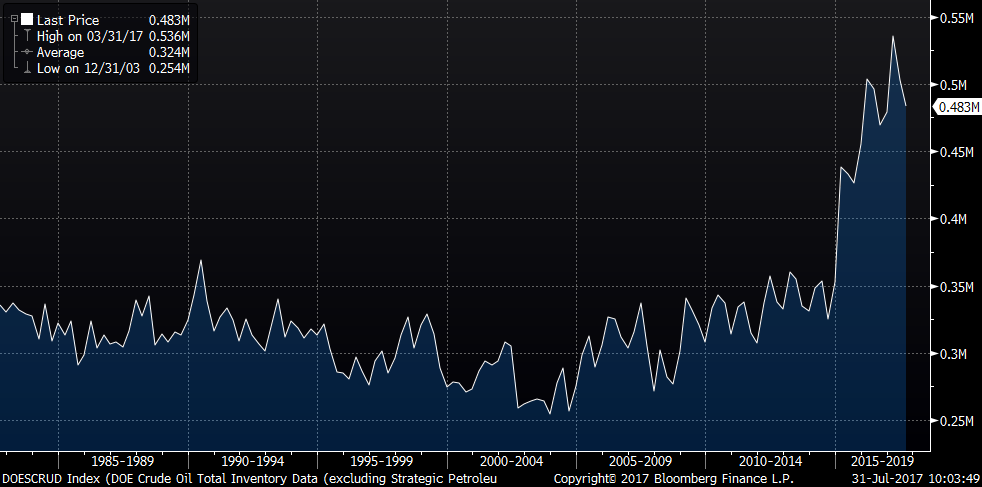
The September WTI crude oil future rebounded sharply gaining 8.6% or $3.94 to close at $49.71 for the week. Total oil inventory fell 1.15%, most of which came from a drop in distillate inventory. The US rig count was up 8 rigs, but production was down slightly. Natural gas was down 1%.

September WTI Crude Oil Futures and September Crude 15 Delta Put Volatility

Aggregate Energy Inventory (Blue) vs. WTI Crude Oil Futures

D.O.E. Crude Oil Inventory

D.O.E. Crude Oil Inventory Perspective (1982 – Present)
Baker Hughes US Rig Count

D.O.E. Crude Oil Production

D.O.E. Crude Oil Production Perspective (1983 – Present)

The U.S. 10 year Treasury yield gained 5 basis points to 2.29% and the German 10 year yield gained 4 basis points to 0.54%. Rates were up across the board.

U.S. 10 Year Bond Yield

German 10 Year Bond Yield

The list below details some upside and downside risks relevant to the steel industry. The bolded ones are occurring or look to be highly likely. The upside risks look to be in control.
Upside Risks:
– Low inventory levels/domestic or global restocking
– Flatbed trucking availability
– China pumping up its “old economy”
– Energy industry rebound
– Weaker dollar
– Graphite Electrode Shortage
– Section 232 Investigation
– Big rally triggered by price increases/low inventory/restocking
– President Trump’s agenda
– Infrastructure bill/long-term solution to highway spending bill
– China getting serious about curtailing steel production
– Transportation supply constraints
– Post-election economic pick up
– Unplanned domestic supply side disruptions
Downside Risks:
– Political uncertainty – Reflation trade reversing
– Increasing oil and iron ore inventory levels
– Sharp and persistent drop in oil and iron ore prices
– Automotive industry under pressure
– Rebound in import volumes
– US domestic producers bringing back on capacity
– Higher interest rates slowing residential construction and auto sales
– Tightening financial conditions pressuring auto sales driven by sub-prime financing
– Chinese restrictions in property market
– The Chinese Financial Crisis
– Unexpected sharp China RMB devaluation
– Increasing import differentials
– Falling ferrous raw materials and global finished steel prices
– Economic downturn, especially in China or Europe reverberating to U.S.A.
– Weak demand in housing or automotive