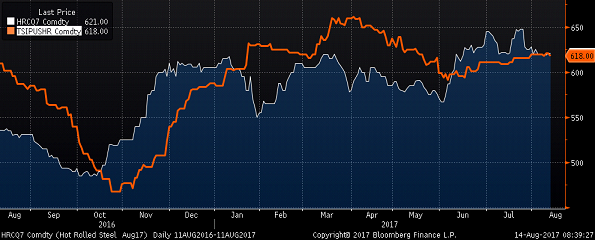
Midwest flat rolled prices continued the rally that began at $365/st in December, 2015. After correcting 10% from the $660 high set on March 20th, 2017, the TSI Daily Midwest HRC Index has bounced off a low of $591 closing the week at $594 while July CME futures traded up to $622. The rebound is largely due to a mix of the recent domestic mill price hike announcements and pending uncertainty caused by the Section 232 Investigation. Lead times look to have moved out a full week since the first announcement, a positive sign that the price increase may hold and that another hike may be coming soon.
July CME HRC Futures vs. TSI Daily Midwest HRC Price

Grounded in the conclusion that Midwest HRC prices have been in a multi-year bull market, the “buy the dip” theme discussed since January remains intact as fundamental data continues to be constructive. An announcement regarding the Section 232 Investigation into steel is expected any day, however, the investigation itself is having a strong effect on the market. Concerns over the outcome have led steel buyers to shift more of their purchasing strategy to domestic mills and importers to evaluate their willingness to share or take on the policy risk. It looks like there is a push in June imports perhaps to get tons into the country ahead of a punitive policy; however, the current uncertainty should result in a sharp drop off in imports in the coming months.
We see the following data points as the foundation of our current view:
The CME Midwest HRC Futures curve continued to soar again last week.

The CME Midwest futures curve was up big with July gaining $18 to $622, August and September up $25 to $627/st and October, 2017 through June 2017 up $24 to $622.
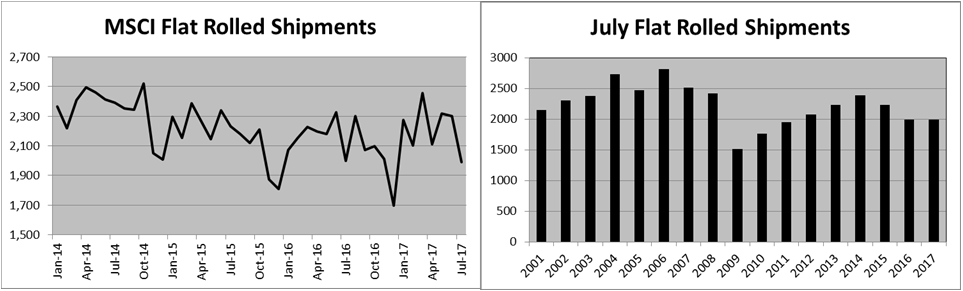
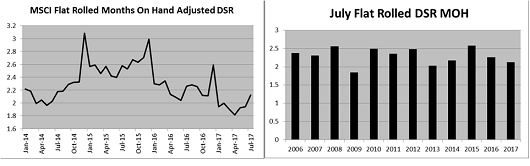
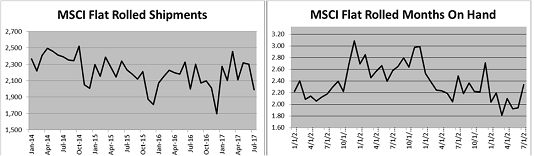
Bullish MSCI flat rolled data continued in May.


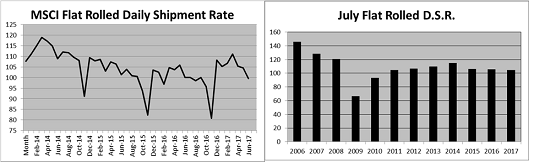
Flat rolled shipments increased 9.8% (208k st) MoM and 6.4% (140k st) YoY. The daily shipment rate (DSR) of 105.4 st/day was down 5% MoM, but up 1.6% YoY. Inventory rose 24k tons while months-on-hand (MOH) fell to 1.92.

Flat rolled inventory was up 24k tons on the month despite shipments being up 208k. The May inventory level is the lowest May level since May, 2010. Inventory has been at or below 4.65m short tons for eight consecutive months.
May had 22 shipping days compared to April’s 19 days. May’s DSR remains at very healthy levels.
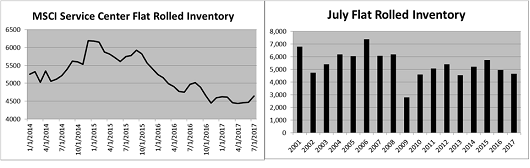
DSR adjusted MOH sank to 1.92, the lowest May level since May, 2006.
May data gave us another strong shipping month and the second lowest MOH since March, 2010.
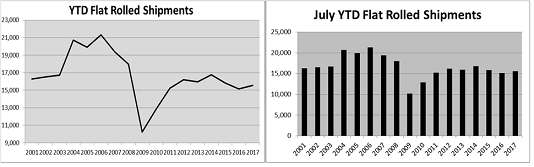
YTD flat rolled shipments are up 4% YoY.
One cornerstone to our bullish view is the historically low flat rolled inventory levels across the steel and manufacturing industries. The table below examines the YoY change in the months-on-hand data from the April Durable Goods Report. While there are some sectors that saw a YoY increase, most sectors were down. The Durable Goods Ex-Transportation MOH was down 3.4% YoY. However, when comparing April MOH data to the seven year April MOH data, most categories are at or just above the seven year average.
Consider MOH = Inventory/shipments. If there is an increase in shipments, then MOH falls all things being equal. Restocking is then necessary to bring MOH back in line. Reviewing the April MSCI shipments and MOH data from above, one can see just that. A 6.4% YoY increase in shipments pushed MOH down to 1.92. This tells us that the service centers will have to restock at some point and that point in time is fast approaching.

So watch shipments in the coming Durable Goods Orders reports. If they start to pick up, OEM’s will start running short.
Similar to the rationalization seen in the steel industry during the 2015 downturn, flatbed trucking firms also curtailed supply which has resulted in increased tightness as shown in the “FTR Active Truck Utilization & Truckload Rates” chart below.

Source: DAT.com
The evolution of this tightness and how it affects steel availability could be very important. If availability becomes a major issue, then this could lead the supply chain to collectively shift its inventory management strategy to a higher level of inventory on-hand and therefore a restocking event. Consider it is already affecting steel mills as they were rumored to overbuy their scrap needs this month to combat the difficulty in not only the trucking industry, but also railcar availability.
HRC indexes moved mostly lower. CRU CRC fell $19 to 788. The TSI ASEAN and some midwest indexes moved higher while there was some pressure on prices in Europe.
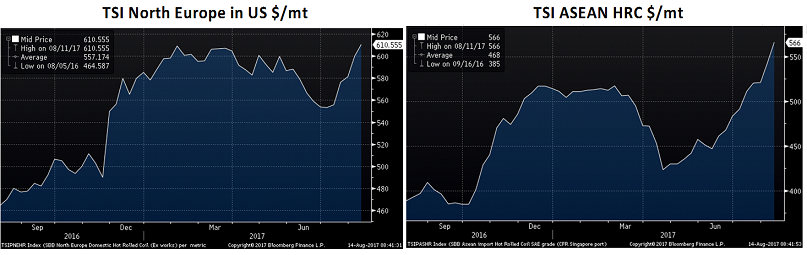
The TSI North European HRC price was down $11 WoW. The TSI ASEAN HRC Index gained $13 to $408/st, building a second leg of the rally started in mid-April.
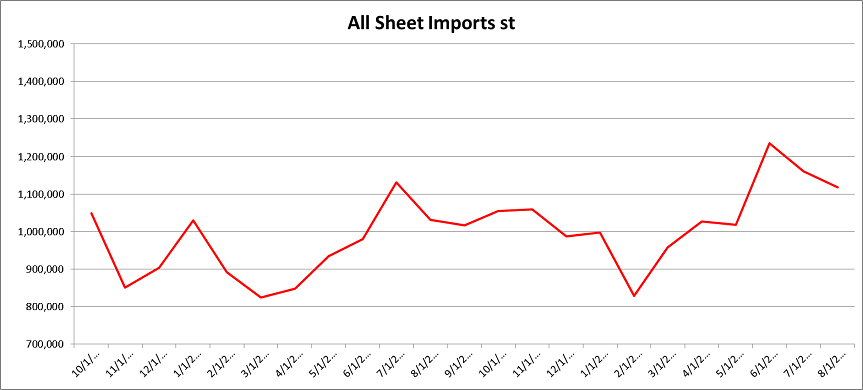
Imports are rebounding, but expect the rebound to be short lived as discussed above.
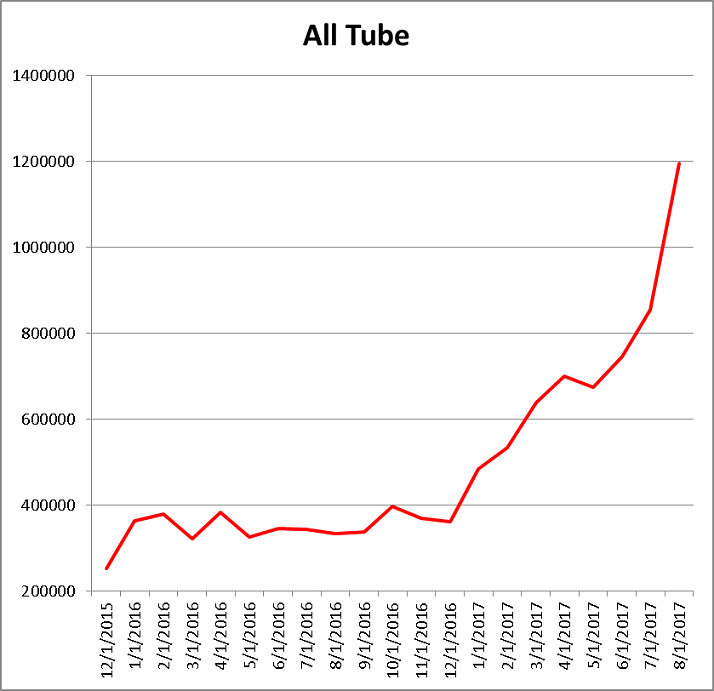
Tube imports have exploded this year, but may be rolling over between the 232 and falling oil prices.

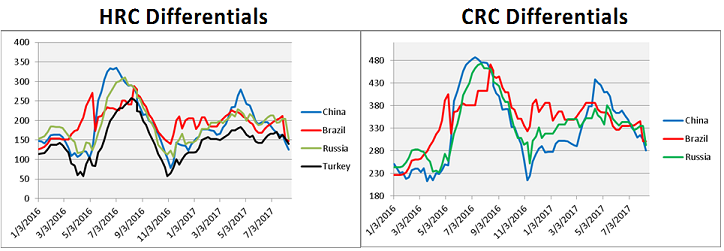
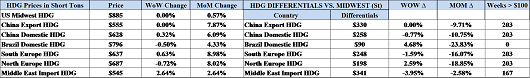
US price differentials (vs. R.O.W) mostly increased.
Below are HRC, CRC and HDG prices and differentials using pricing from SBB Platts. Differentials increased slightly WoW.

Midwest HRC prices gained almost 2%. China and East Asian HRC also gained while European prices were lower.
Global CRC prices moved similar to global HRC prices.

No movement in global HDG pricing.
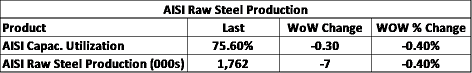
AISI Steel Capacity Utilization Rate and TSI Daily HRC Price

AISI capacity utilization fell to 73.7%.

East Coast shred gained 3% while the iron ore price saw a dead cat bounce of 1.3%. Australian coking coal continues to retreat, now at $140/t.
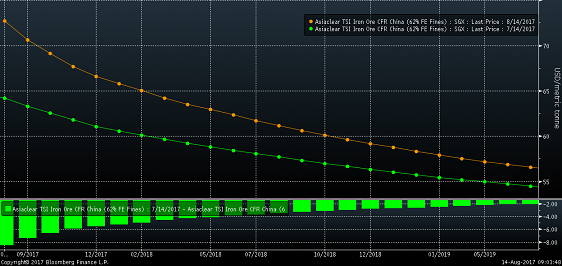
Has iron ore finally bottomed? Turkish scrap was quiet.
The iron ore curve has flattened as prices have fallen off since April.

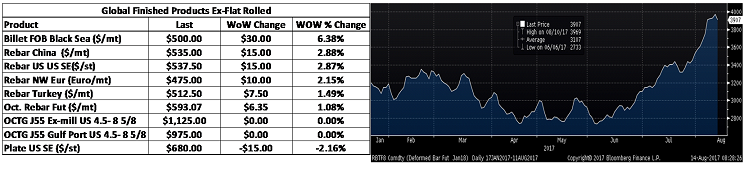
Chinese rebar was up 2.5% while North American 5.5 inch OCTG fell 3%.
The June Empire Manufacturing Index posted 19.8 and surprised (expectations were 5) to the upside reaching its highest level since 2014. The index has been extremely volatile. The chart to the right shows the three-month moving average of the index to smooth out the volatility.
Empire Manufacturing Index

The June Philadelphia Fed Business Outlook slipped to 27.6 from 38.8, but beat expectations of 24.9 and remains at very strong levels historically.
Philadelphia Fed Business Outlook

The May NFIB Small Business Optimism Index was flat at 104.5. Inflation data was mixed with May YoY PPI Ex-Food and Energy up 2.1% vs. expectations of 1.9% while May YoY CPI Ex-Food and Energy was up 1.7% YoY, down from 1.9% in April and missing expectations of 1.9%. May Retail Sales missed across the board. Disappointing May Industrial Production data was flat MoM, missing expectations of a 0.2% gain. May Capacity Utilization fell to 76.6% and missed expectations. May Housing Starts and Building Permits were down 5.5% and 4.9%, respectively, badly missing expectations of 4.1% and 1.7% growth, respectively.

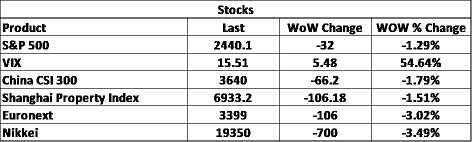
The S&P 500 made yet another new record high. The Chinese CSI was down 2.2% while the Euronext was down 1.4%.

S&P 500

China CSI 300

Steel stocks were down after Nucor lowered their Q2 earnings guidance.

Nucor
Iron ore miners were lower.

The copper rally failed as fast as it started. Aluminum fell 2%.

July CME Copper Futures

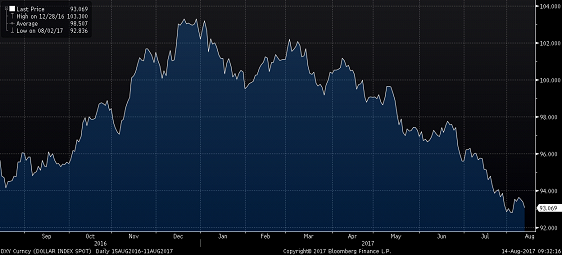
Developed currencies were quiet last week despite rate decisions out of the Federal Reserve, Bank of Japan, Bank of England and Swiss Bank. The Canadian dollar, Mexican peso, Australian dollar and Turkish lira all gained vs. the dollar, while the Russian ruble and Korean won sold off.

US Dollar Index

Canadian Dollar

Mexican Peso


WTI crude oil continued to be under pressure falling 2.5% to $44.74/bbl. The Baker Hughes US Rig Count gained 6 rigs to 933 while production inched higher. Crude oil inventory fell, but the total inventory metric gained slightly.
July WTI Crude Oil Futures

Aggregate Energy Inventory (Blue) vs. WTI Crude Oil Futures

D.O.E. Crude Oil Inventory

D.O.E. Crude Oil Inventory Perspective (1982 – Present)

Baker Hughes US Rig Count

D.O.E. Crude Oil Production

D.O.E. Crude Oil Production Perspective (1983 – Present)

10 year Treasury rates were mixed with the US 10-year down five basis points to 2.15%.

U.S. 10 Year Bond Yield

The list below details some upside and downside risks relevant to the steel industry. The bolded ones are occurring or look to be highly likely. Upside risks look to be in charge.
Upside Risks:
– Section 232 Investigation
– Low inventory levels/domestic or global restocking
– Flatbed trucking availability
– China pumping up its “old economy”
– Energy industry rebound
– Weaker dollar
– Border adjustment tax
– Big rally triggered by price increases/low inventory/restocking
– President Trump’s agenda
– Infrastructure bill/long-term solution to highway spending bill
– China getting serious about curtailing steel production
– Transportation supply constraints
– Post-election economic pick up
– Unplanned domestic supply side disruptions
Downside Risks:
– Political uncertainty – Reflation trade reversing
– Increasing oil and iron ore inventory levels
– Sharp and persistent drop in oil and iron ore prices
– Automotive industry under pressure
– US domestic producers bringing back on capacity
– Higher interest rates slowing residential construction and auto sales
– Tightening financial conditions pressuring auto sales driven by sub-prime financing
– Chinese restrictions in property market
– The Chinese Financial Crisis
– Unexpected sharp China RMB devaluation
– Rebound in import volumes
– Increasing import differentials
– US dollar rally/currency issues/sovereign default
– Falling ferrous raw materials and global finished steel prices
– Economic downturn, especially in China or Europe reverberating to U.S.A.
– Weak demand in housing or automotive