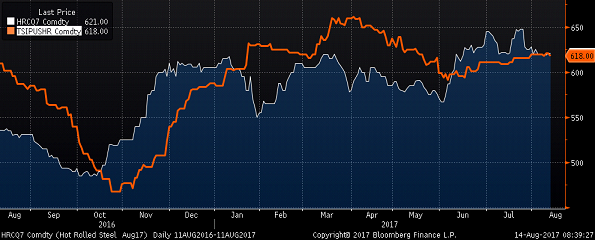
The Midwest HRC price continued the rally that began at $365/st in December, 2015. After correcting 10% from the $660 high set on March 20th, 2017, the TSI Daily Midwest HRC Index has bounced off a low of $591 closing this past week at $601 while July CME futures traded up to $630 early Monday June 26th. The rebound is largely due to a mix of the recent domestic mill price hike announcements and pending uncertainty caused by the Section 232 Investigation. Lead times look to have moved out a full week since the first announcement, a positive sign that the price increase may hold and that another hike may be coming soon.
July CME HRC Futures vs. TSI Daily Midwest HRC Price

Grounded in the conclusion that Midwest HRC prices have been in a multi-year bull market, the “buy the dip” theme discussed since January remains intact as fundamental data continues to be constructive. An announcement regarding the Section 232 Investigation into steel is expected any day, however, the investigation itself is having a strong effect on the market. Concerns over the outcome have led steel buyers to shift more of their purchasing strategy to domestic mills and importers to evaluate their willingness to share or take on policy risk. June imports are forecast to see a sizeable increase, perhaps an attempt to get tons into the country ahead of a punitive policy; however, the current uncertainty should result in a sharp drop off in imports in the coming months.
We see the following data points as the foundation of our current view:
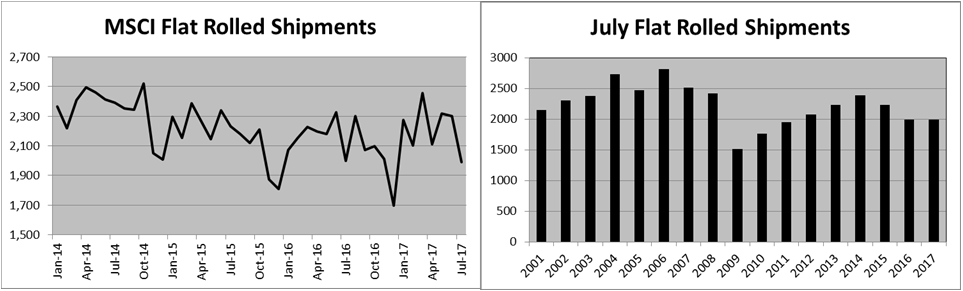
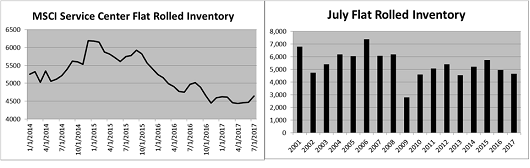
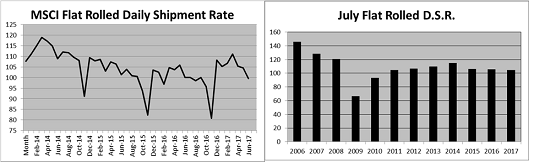
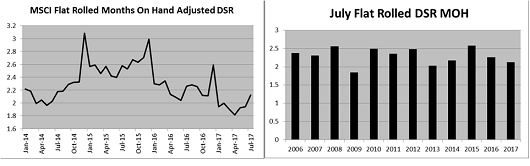
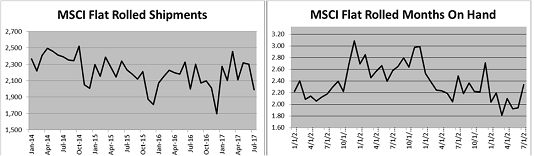
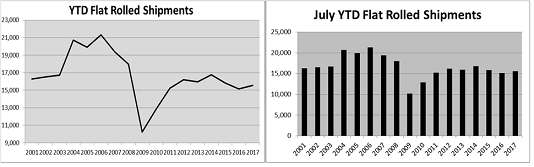
- Persistently low flat rolled inventory evidenced in the MSCI, ISM and Durable Goods reports
- The Section 232 Investigation into steel
- A global uptrend in manufacturing purchasing managers indexes
- Conditions are ripe for a restocking wave
- A rebounding US energy industry
- Relatively low HRC imports with trade restrictions
The CME Midwest HRC Futures curve settled mostly unchanged through Q3 and down $5 – $6 farther out on the curve.

As of Friday’s settlement, July CME Midwest HRC futures were up $2 to $624/st, August was down $2 to $625 in and September was down $1 in $626/st. Q4 2016 fell $5 to $617 while the first half of 2018 was down $6 to $616.
The SBB Platts Shanghai HRC Index gained $20 to $410/st. The SBB HRC Midwest Index gained $8 to $605 and the TSI Daily HRC Index gained $7 to $601. HDG indexes gained while CRC was flat to down after moving up nicely the previous week. European prices remain under pressure with the euro above 1.12.

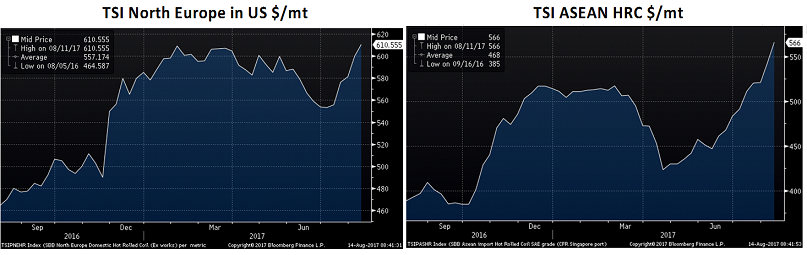
The TSI North European HRC Index fell back to $499, just above the previous recent low of $497/mt set on June 14th. The TSI ASEAN HRC Index gained $6 to $424/st making a new recent high since bottoming on April 24th. Higher highs and higher lows indicate perhaps the nascent rally in ASEAN prices has room to grow.

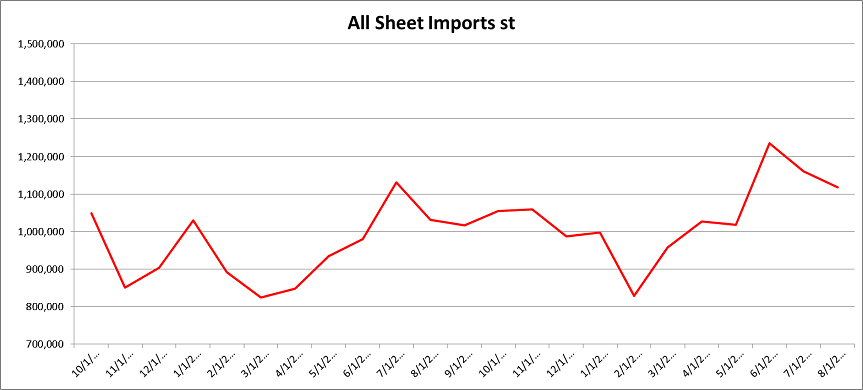
- Relatively low HRC imports with trade restrictions
Imports are rebounding, but we expect the rebound to be short lived as discussed above.

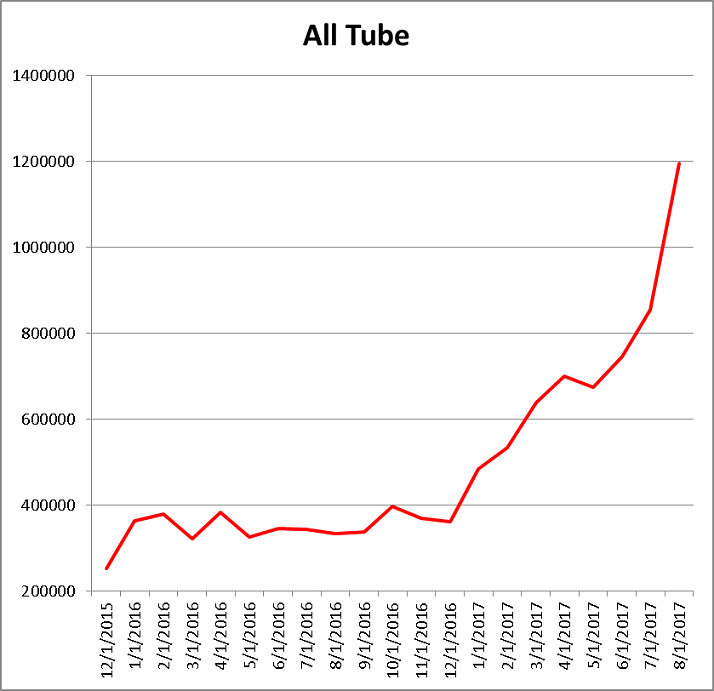
Tube imports have exploded this year and look to continue to reach news highs in June.
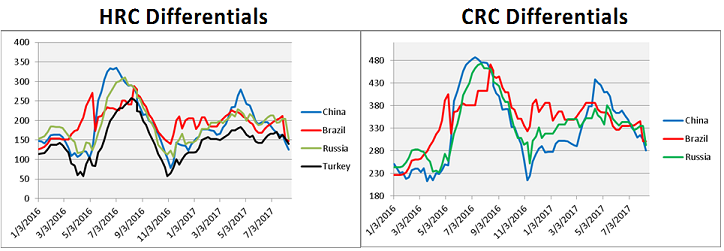
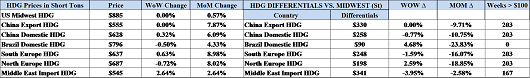
US price differentials (vs. R.O.W) mostly increased.
Below are HRC, CRC and HDG prices and differentials using pricing from SBB Platts. HRC differentials increased slightly WoW in Brazil, Russia and Turkey. CRC differentials were lower in China and flat in Brazil and Russia.
Midwest, China and East Asian HRC prices gained, while European prices were pressured lower.
Chinese CRC was up, while European CRC prices were lower.
No movement again in global HDG pricing.
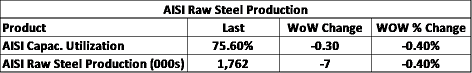
AISI Steel Capacity Utilization Rate and TSI Daily HRC Price
AISI capacity utilization rebounded to 74.6%.

Scrap and ore prices gained nicely. Australian coking coal rebounded 4.6%.

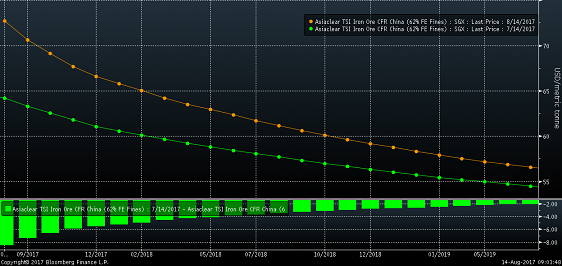
Has iron ore finally bottomed? Turkish scrap broke above the top of the range it has been in since early April.
The iron ore curve has flattened as prices have fallen off since April.
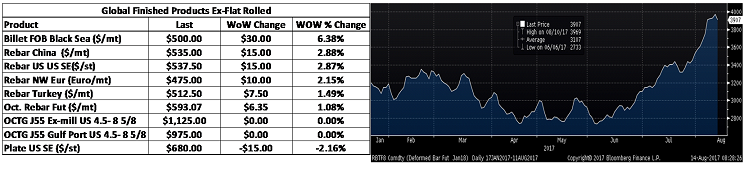
Turkish rebar gained almost 2%. US rebar fell 2.3% and Chinese physical rebar slipped almost 2%.
The June Kansas City Fed Manufacturing index rose to 11 from 8, a good sign considering the weakness in oil prices of late. May Existing Home Sales rose to 5.62m annualized and beat expectations. May New Home Sales also rose and were better than expected at 610k SAAR units. Also, April New Home Sales were revised higher.
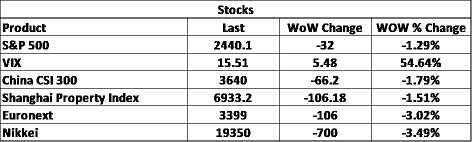
The S&P 500 made yet another new record high. The Chinese CSI and Shanghai Property Index each gained over 2.5%.

China CSI 300

Shanghai Property Index
Steel stocks rebounded sharply with Schnitzer, AK Steel, US Steel and Olympic Steel gaining in excess of 10%.

Schnitzer
US Steel

AK Steel

Iron ore miners were mixed.
LME 3 month zinc gained 7%. The copper rally that failed last week ripped right back up closing the week at $2.6345/pnd.
LME Zinc 3 Month Rolling Forward

July CME Copper Futures
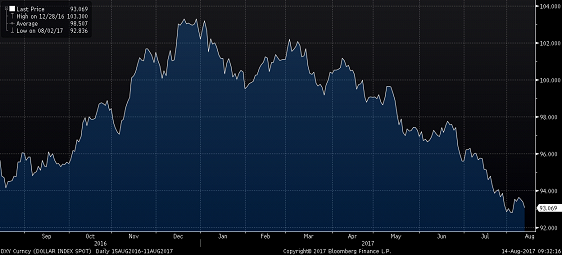
The summer doldrums have hit the currency markets resulting in very low volatility. Only the Russian ruble down 3.5% and the Brazilian real falling 1.5% moved in excess of 1% on the week.

US Dollar Index

Russian Ruble

Brazilian Real

- A rebounding energy industry

WTI crude oil continued lower falling to $43/bbl while natural gas was down 3.3% to $2.93/mbtu. The US and N.A. rig counts continued higher with production up slightly. Crude and total inventory moved lower. OCTG prices were unchanged.
July WTI Crude Oil Futures

Aggregate Energy Inventory (Blue) vs. WTI Crude Oil Futures

D.O.E. Crude Oil Inventory
D.O.E. Crude Oil Inventory Perspective (1982 – Present)

Baker Hughes US Rig Count

D.O.E. Crude Oil Production

D.O.E. Crude Oil Production Perspective (1983 – Present)

10 year Treasury rates were mixed with the US 10-year down five basis points to 2.15%.

U.S. 10 Year Bond Yield

The list below details some upside and downside risks relevant to the steel industry. The bolded ones are occurring or look to be highly likely. Upside risks look to be in charge.
Upside Risks:
– Section 232 Investigation
– Low inventory levels/domestic or global restocking
– Flatbed trucking availability
– China pumping up its “old economy”
– Energy industry rebound
– Weaker dollar
– Border adjustment tax
– Big rally triggered by price increases/low inventory/restocking
– President Trump’s agenda
– Infrastructure bill/long-term solution to highway spending bill
– China getting serious about curtailing steel production
– Transportation supply constraints
– Post-election economic pick up
– Unplanned domestic supply side disruptions
Downside Risks:
– Political uncertainty – Reflation trade reversing
– Increasing oil and iron ore inventory levels
– Sharp and persistent drop in oil and iron ore prices
– Automotive industry under pressure
– US domestic producers bringing back on capacity
– Higher interest rates slowing residential construction and auto sales
– Tightening financial conditions pressuring auto sales driven by sub-prime financing
– Chinese restrictions in property market
– The Chinese Financial Crisis
– Unexpected sharp China RMB devaluation
– Rebound in import volumes
– Increasing import differentials
– US dollar rally/currency issues/sovereign default
– Falling ferrous raw materials and global finished steel prices
– Economic downturn, especially in China or Europe reverberating to U.S.A.
– Weak demand in housing or automotive