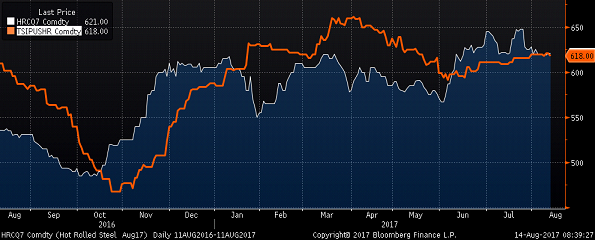
The Midwest HRC price continued the rally that began at $365/st in December, 2015. After correcting 10% from the $660 high set on March 20th, 2017, the TSI Daily Midwest HRC Index has bounced off a low of $591 closing this past week at $611 while the July CME future price settled at $640 at week’s end. The rebound is largely due to a mix of the recent domestic mill price hike announcements and pending uncertainty caused by the Section 232 Investigation. Lead times look to have moved out a full week since the first announcement, a positive sign that the price increase may hold and that another hike may be coming soon.
July CME HRC Futures vs. TSI Daily Midwest HRC Price

Grounded in the conclusion that Midwest HRC prices have been in a multi-year bull market, the “buy the dip” theme discussed since January remains intact as fundamental data continues to be constructive. An announcement regarding the Section 232 Investigation into steel is anxiously expected by all those attached to the steel market. However, the investigation itself has already had a strong effect on the market. Concerns over the outcome have led steel buyers to shift to a more domestic focused purchasing strategy while importers are faced with having to evaluate their willingness to share or take on policy risk. June imports are forecast to see a sizeable increase, perhaps in an attempt to get tons into the country ahead of a punitive policy. However, the current uncertainty should result in a sharp drop off in imports in the coming months.
We see the following issues as the foundation of our current view:
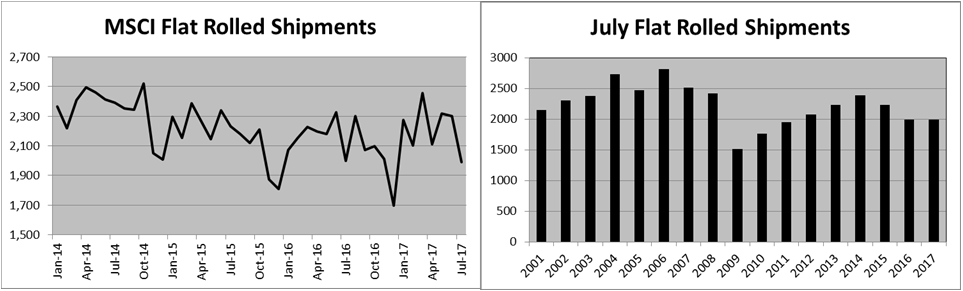
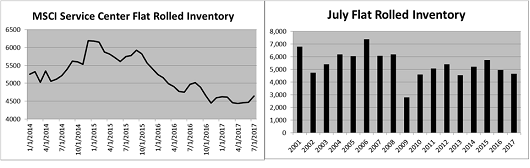
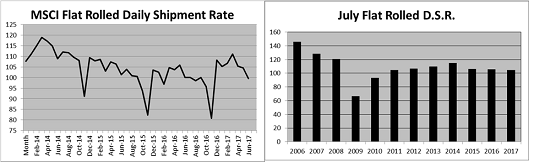
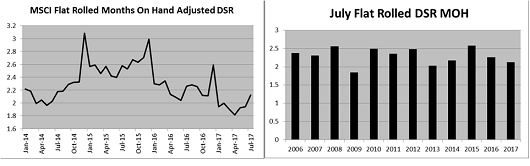
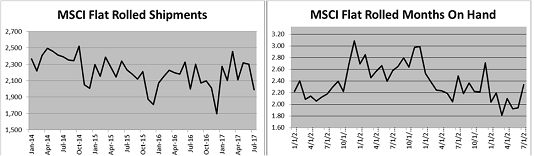
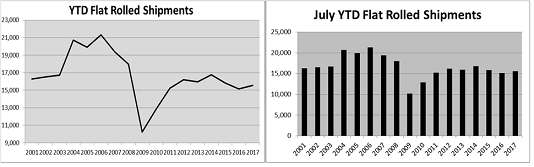
- Persistently low flat rolled inventory evidenced in the MSCI, ISM and Durable Goods reports
- The Section 232 Investigation into steel
- A global uptrend in manufacturing purchasing managers indexes
- Conditions ripe for a restocking wave
- A rebounding US energy industry
- Relatively low HRC imports with trade restrictions
June’s ISM Manufacturing PMI gained 2.9 points to 57.8. The chart below may indicate HRC prices will be moving higher.
ISM Manufacturing PMI and TSI Daily Midwest HRC Index

New orders, production, employment and supplier deliveries saw big gains with new orders and production well above the 60 mark. The producer and customer inventory sub-indexes continue to oscillate around the 50 level. The prices component fell 5.5 points to 55. Backlogs rose 2 points to a very healthy 57 and new export orders gained 2 points to 59.5, most likely due to a weakening US dollar.
ISM Manufacturing PMI

New orders and backlogs look to be very healthy.
ISM Manufacturing PMI New Orders (White) and Backlog (Orange)

The producer inventory sub-index fell below 50, while the customer sub-index inched back above 50 to 50.5.
- Persistently low flat rolled inventory evidenced in the MSCI, ISM and Durable Goods reports
ISM Manufacturing PMI Producer (White) and Customer Inventories (Orange)

Below is the ISM PMI with sub-indexes. The continued weakness in the producer and customer inventory sub-indexes despite the shift in backlogs from contraction to strength this past January is interesting.
The regional PMI reports below are highlighted by a sharp rebound in the Empire Manufacturing Report and a very strong Chicago PMI.
The colors in the table above correspond to the appropriate PMI index below. The chart on the right normalizes the data.
June US auto sales annualized at a 16.41m unit rate were down from 16.58 in May and missed expectations of 16.53 SAAR.
US Auto Sales SAAR
YTD auto sales are down 2.2% or 192,085 units. Sales for the month totaled 1.46m units, down 45k units MoM and almost 49k YoY.
This chart highlights the correlation between employment and auto sales. As the country reaches full employment, it’s not a surprise auto sales are slowing slightly, but with such a low unemployment rate, it would be surprising to see auto sales fall too much farther from here.
US Auto Sales (white) and the Inverted Unemployment Rate (orange)
The chart on the right takes a running three month average of monthly auto sales showing there is still plenty of strength in auto sales.
US Auto Sales NSA and 3 Month Average NSA Auto Sales

Auto dealer inventory gained MoM and YoY.

These charts highlight the inventory of the six largest automakers through time.
Wards Auto Inventory Data per Auto Manufacturers
This chart compares June inventory per automaker for the past four years. GM looks to have a problem with their inventory, but the other five look to be under control.
Wards Auto Inventory Days On Hand
May seasonally adjusted construction spending was flat MoM and disappointed, while April’s data was revised higher to -0.7% from -1.4%. Unadjusted data continues to show strong upside momentum.
May total construction spending was up 4.9% while May YTD total spending gained 6.05% making a new all-time high.
May total private construction spending was up 6.4% YoY while May YTD total private spending was up 9%, also making a new all-time high.

May private residential construction spending was up 11% YoY while May YTD private residential spending was up 12.5%.

May private nonresidential construction spending was up 1.3% YoY while May YTD total private nonresidential spending was up 5.3%, making a new all-time high.
- A global uptrend in manufacturing purchasing managers indexes
The JP Morgan Global Manufacturing PMI was flat at 52.6. Indonesia was the only country with a PMI below 50. The US and Eurozone at 57.8 and 57.4 are leading the indexes.

The chart below shows continued strength in the PMIs of the Eurozone and the largest European economies.
Eurozone (white), German (blue), Italian (green), French (yellow) and Spanish (red) Manufacturing PMIs
This chart compares the world’s largest economies manufacturing PMIs. The PMIs of Germany and the US look fantastic while those of China and Japan are hanging in there.
US (white), German (blue), Chinese (green) and Japanese (red) Manufacturing PMIs

June saw gains in both China’s Official and Caixan Manufacturing PMIs. The Caixan Manufacturing PMI’s stay below 50 only lasted a month.
China Official (White) and Caixan (Orange) Manufacturing PMIs

This table shows China’s Official PMI and its sub-indexes.
The long term destocking of inventory and raw materials jumps out and has been in contraction since March, 2013.
China Stocks of Finished Goods (white) & Inventories of Raw Materials (red)
Perhaps this is a result of a backlog of orders that have also been in contraction since March, 2012. However, there is an obvious uptrend in new orders since bottoming in March, 2016 and may finally be having an effect on backlogs. Similar to the US, if a restocking were to occur due to a spike in demand or other shock, the replenishing of these light inventory levels could lead to a massive rally.
China New Orders (white) & Backlogs of Orders (red)

As of Friday’s settlement, July CME Midwest HRC futures were up $16 to $640/st, August was up $20 to $645 in and September gained $14 in $640. Q4 2016 rallied $23 to $640. Q1 2018 gained $14 to $630 and Q2 2018 increased $9 to $625.
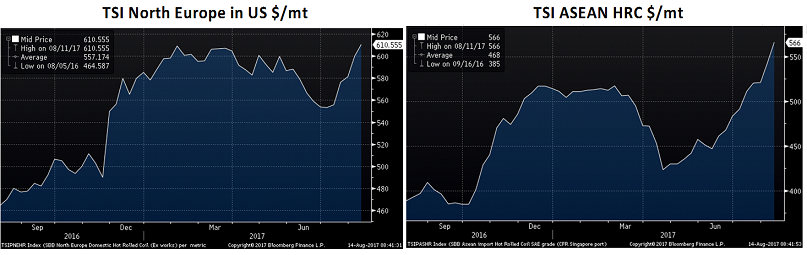
Asian and US HRC indexes saw nice gains.

The TSI North European HRC Index continued lower as the euro keeps rallying. The rally in the TSI ASEAN is gaining steam and is about in line with the TSI N.E. HRC index.

- Relatively low HRC imports with trade restrictions
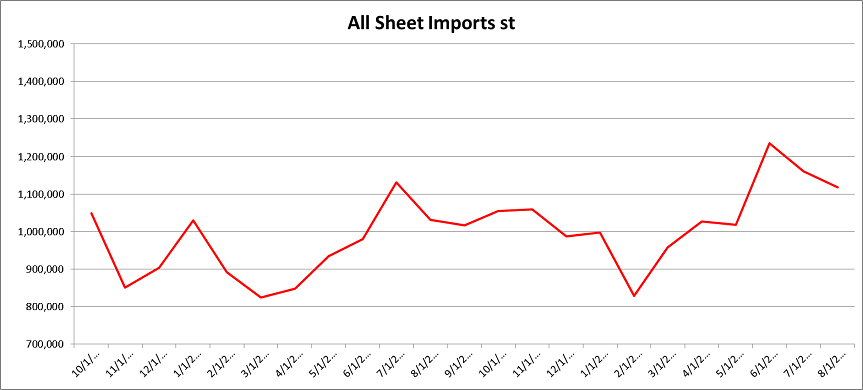
June import licenses are forecasting a huge MoM gain, most likely in anticipation of tariffs to be applied by the Trump administration. We are expecting a sharp drop off in flat rolled imports in the short-term as import deals have been readily declined due to the complications surrounding the uncertainty of the 232 Investigation.

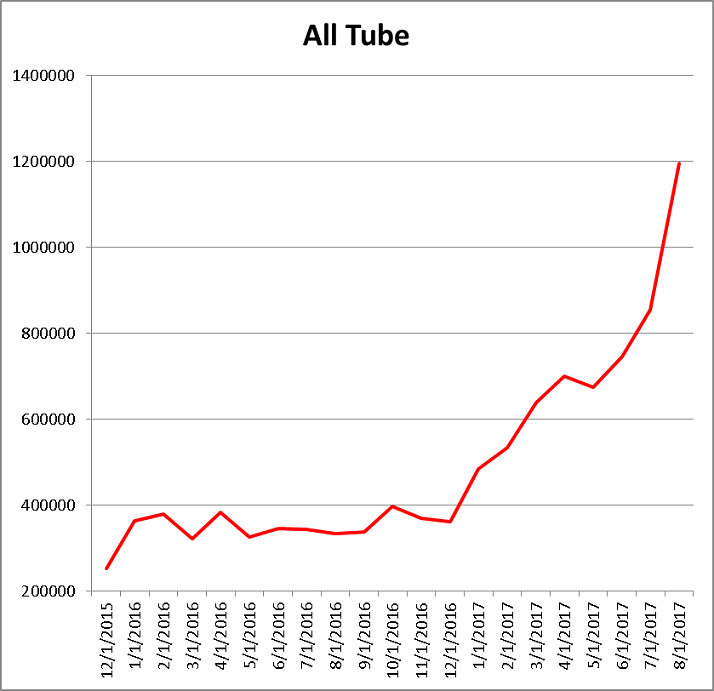
Tube imports have exploded this year and look to continue to reach news highs in June. This could be an area where the government policy cracks down. We expect tube imports to reverse in the short term as well.

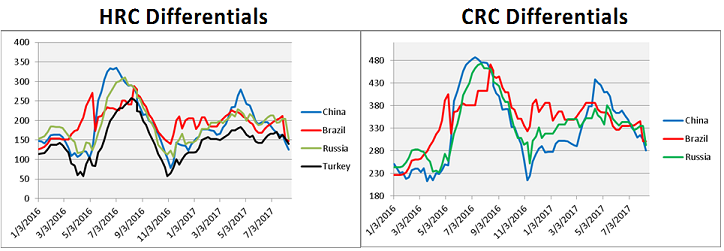
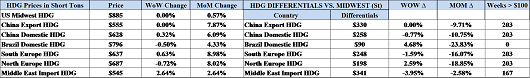
US price differentials (vs. R.O.W) mostly increased.
Below are HRC, CRC and HDG prices and differentials using pricing from SBB Platts. HRC differentials increased slightly WoW vs. Brazil, Russia and Turkey and decreased vs. China. CRC differentials were lower in China and flat in Brazil and Russia.

Asian HRC prices were up again while North European HRC saw a gain for the first time in many weeks.

Chinese and North European CRC prices gained.

No movement again in global HDG pricing.
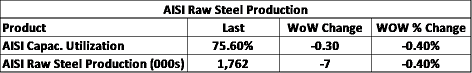
AISI Steel Capacity Utilization Rate and TSI Daily HRC Price

AISI capacity utilization slipped slightly to 74.2%.

Raw materials logged a very strong week.

Ore and scrap continued to rally last week.

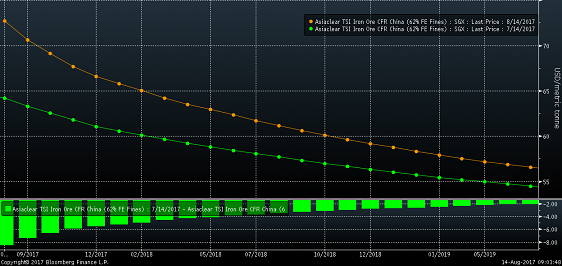
The iron ore curve has shifted higher vs. early June and the curve starting to move towards a steeper backwardation.

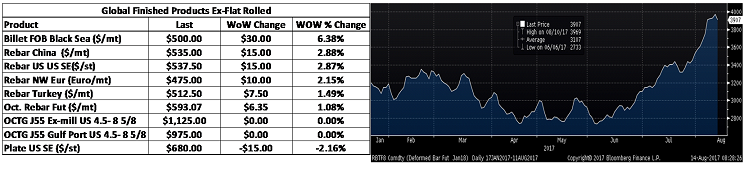
Turkish rebar gained almost 2%. US rebar fell 2.3% and Chinese physical rebar slipped almost 2%.

May Durable Goods Ex-transportation increased 0.1% MoM, missing expectations of a 0.4% gain. May Capital Goods Orders Nondefense Ex-air slipped 0.2%, missing expectations of a 0.4% gain. The April Case-Shiller 20 City Home Price Index gained 5.67% YoY missing expectations of 5.9%. May Pending Homes Sales fell 0.8%, missing expectations of a rise of 1%. The third estimate of Q1 GDP increased slightly to 1.4%. May Core PCE gained 1.4% YoY, down from 1.5% in April. The final University of Michigan Consumer Confidence Index for June rose to 95.1 vs. 94.5 in May.

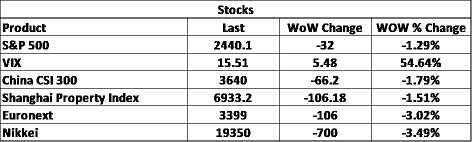
The S&P 500 was down slightly. The Euronext dropped almost 3% in response to remarks by Mario Draghi. China’s CSI 300 continued higher gaining about 2% on the week.

Steel stocks mostly saw big gains with only US Steel and AK Steel lagging.

Schnitzer

Worthington Industries

Iron ore miners charged ahead with the iron ore rally gaining steam.

Base metals were all stronger with nickel leading the charge gaining 3.4%.

LME Nickel 3 Month Rolling Forward

July CME Copper Futures

LME Aluminum 3 Month Rolling Forward

LME Zinc 3 Month Rolling Forward

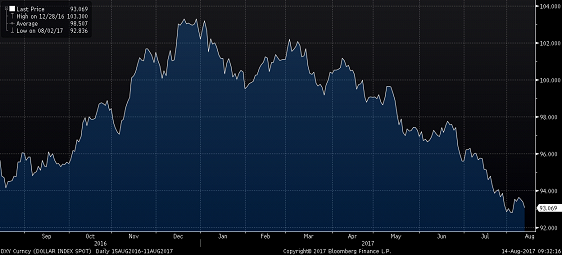
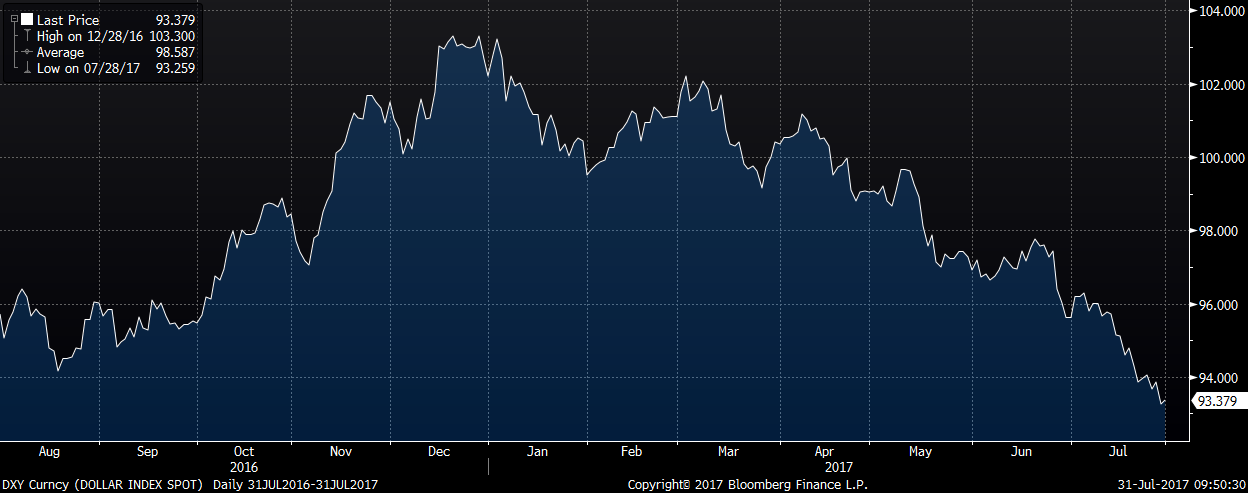
Currencies moved following comments made by Janet Yellen and Mario Draghi at different speaking engagements. The dollar made a new low to 95.63 since breaking above 103 in December, 2016. The euro gained 2% to 1.1426 while the yen shed 1% to 112.39. The Canadian dollar, British pound, Australian dollar, Russian ruble and Brazilian real all gained at least one percent.

US Dollar Index

Euro

Canadian Dollar
- A rebounding energy industry

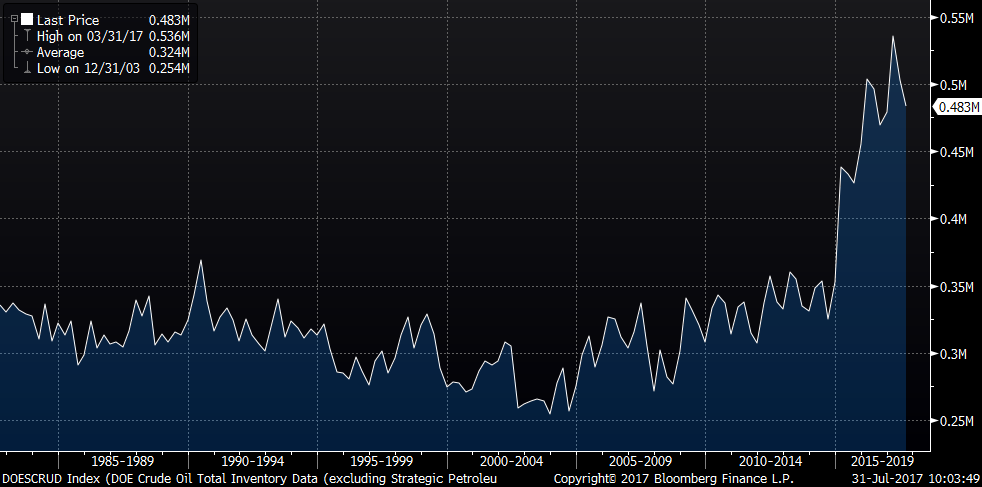
WTI crude oil rebounded sharply gaining 7% on the week to close at $46.04/bbl. Natural Gas was up 3.6% to $3.04/mbtu. The US rig count cut one rig, the first drop in the rig count since January. Oil inventory was little changed last week while crude oil production fell 1%.
July WTI Crude Oil Futures

Aggregate Energy Inventory (Blue) vs. WTI Crude Oil Futures

D.O.E. Crude Oil Inventory

D.O.E. Crude Oil Inventory Perspective (1982 – Present)

Baker Hughes US Rig Count
D.O.E. Crude Oil Production

D.O.E. Crude Oil Production Perspective (1983 – Present)

10 year Treasury rates ripped higher following hawkish remarks from Yellen and Draghi. The U.S. 10 year Treasury yield gained 7.5% or 16 basis points to 2.3%. The German 10 year Treasury yield almost doubled from 0.26% to 0.47%. The Japanese 10 year Treasury yield gained 3 basis points to 0.9%, the highest since Mid-March.

U.S. 10 Year Bond Yield

German 10 Year Bond Yield

The list below details some upside and downside risks relevant to the steel industry. The bolded ones are occurring or look to be highly likely. The upside risks look to be in control.
Upside Risks:
– Section 232 Investigation
– Low inventory levels/domestic or global restocking
– Flatbed trucking availability
– China pumping up its “old economy”
– Energy industry rebound
– Weaker dollar
– Border adjustment tax
– Big rally triggered by price increases/low inventory/restocking
– President Trump’s agenda
– Infrastructure bill/long-term solution to highway spending bill
– China getting serious about curtailing steel production
– Transportation supply constraints
– Post-election economic pick up
– Unplanned domestic supply side disruptions
Downside Risks:
– Political uncertainty – Reflation trade reversing
– Increasing oil and iron ore inventory levels
– Sharp and persistent drop in oil and iron ore prices
– Automotive industry under pressure
– US domestic producers bringing back on capacity
– Higher interest rates slowing residential construction and auto sales
– Tightening financial conditions pressuring auto sales driven by sub-prime financing
– Chinese restrictions in property market
– The Chinese Financial Crisis
– Unexpected sharp China RMB devaluation
– Rebound in import volumes
– Increasing import differentials
– US dollar rally/currency issues/sovereign default
– Falling ferrous raw materials and global finished steel prices
– Economic downturn, especially in China or Europe reverberating to U.S.A.
– Weak demand in housing or automotive