Midwest flat rolled prices continued the rally that began at $365/st in December, 2015, however HRC has slipped 5% to $625 from the $660/st high set on March 20th, 2016. Thus far, prices have seen higher highs and higher lows. We remain positive on the domestic steel industry while watching some concerning developments in iron ore and Chinese finished steel prices as well as the domestic automotive industry.
The “buy the dip” theme remains intact as fundamental data continues to be strong. We see the following data points as the foundation of our current view:
June CME HRC Futures vs. TSI Daily Midwest HRC Price

- Low inventory levels evidenced in the MSCI, ISM and Durable Goods reports
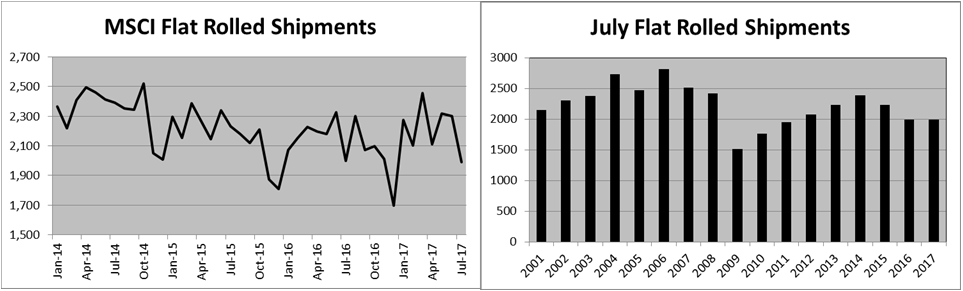
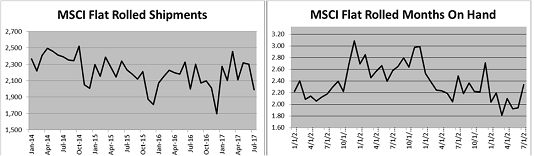
April MSCI flat rolled data saw a nice gain in the daily shipment rate and a further decrease in inventory.


April flat rolled shipments were down 344k tons MoM and 4% YoY. However, April only had 19 shipping days.

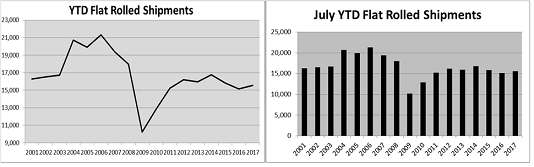
YTD flat rolled shipments are up 3.35% vs. shipments through April, 2016.

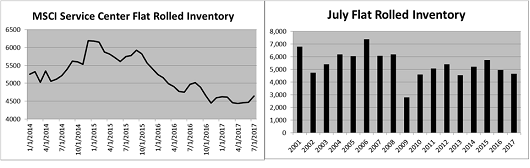
Inventory continued lower, which was surprising considering the 344k ton drop in MoM shipments.
With nominal shipments lower, months-on-hand (M.O.H.) increased to 2.1 from 1.82.
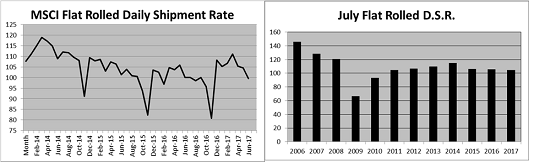
Due to inconsistencies in MoM shipping days, looking at a daily shipping rate (shipments divided by shipping days) provides standardized data for better comparison. April’s daily shipment rate (D.S.R.) jumped to 111.1 tons, up 4% MoM, 6% YoY and the highest since September 2014.
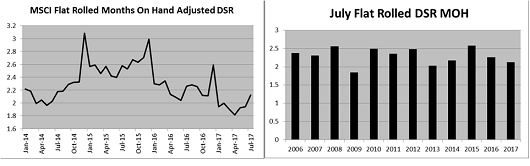
The M.O.H. adjusted for the D.S.R. fell to 1.81, the lowest level since at least 2006.
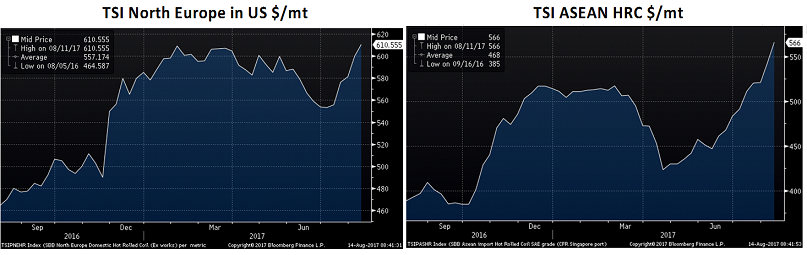
Midwest HRC Indexes moved lower and now sit between $615 – $625/st. HRC was mixed in Asia and under pressure in Europe.
The TSI North Europe HRC index was off $7 to $531/st. The TSI ASEAN HRC Index added $5 to $395/st.
CME Midwest futures rebounded with June up $5 to $595, July up $10 to $590, August up $6 to $585 and September up $7 to $585. Q4 gained $10 to $585 and Q1 2018 added $10 to $580 as the curve continues to flatten.

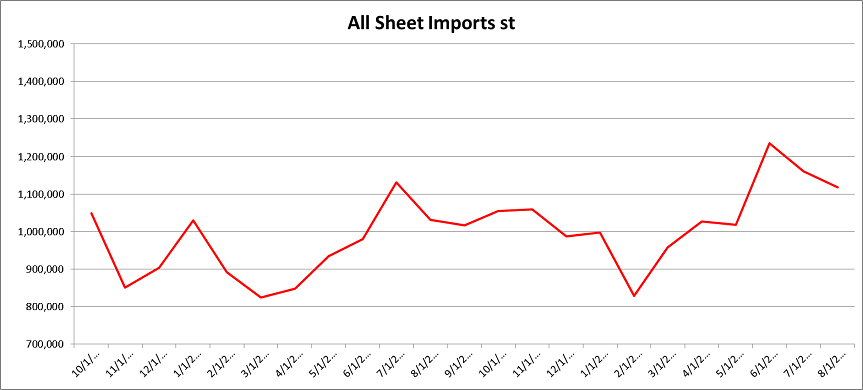
The import uptrend looks to be hitting a speedbump in May.

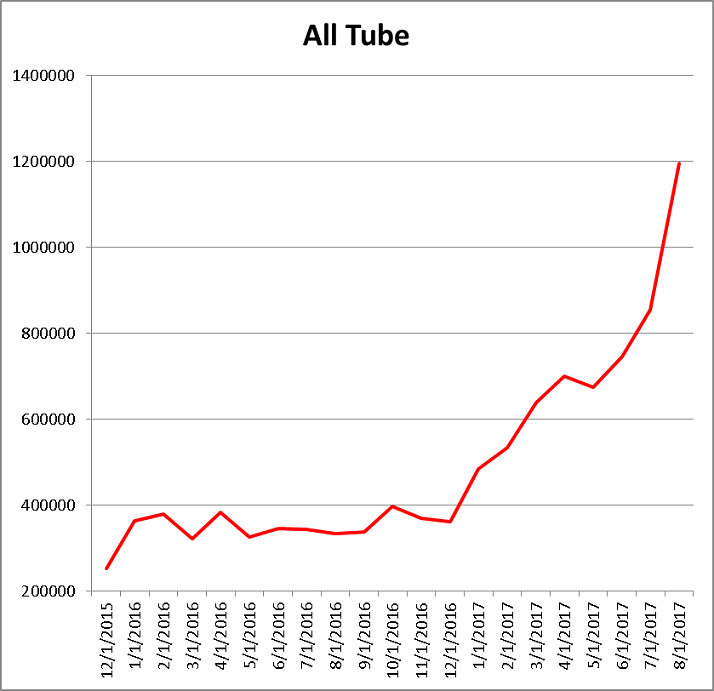
Tube imports have exploded and while they seem to be down MoM, they are up huge YoY.
- Relatively light imports with trade restrictions
- 232 investigation launched by the Trump Administration
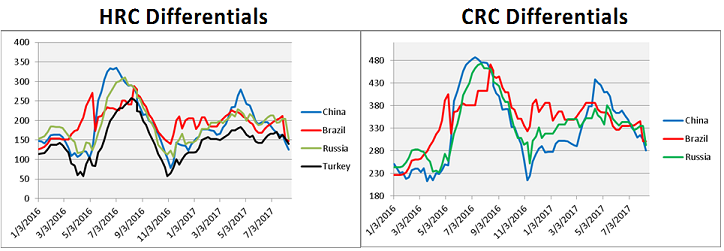
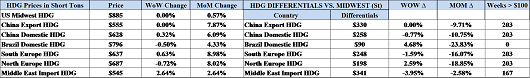
With flat rolled prices falling precipitously in China and around Asia, US price differentials have ballooned. This has created and amplified expectations for a surge of imported flat rolled material to arrive later this year. One major caveat to this assumption is the uncertainty US government policy will play, especially considering the authority held by the executive branch and that Wilbur Ross, a major beneficiary of George Bush’s restrictive steel import policies at the turn of the century, is the Commerce Secretary.
What is your best guess at handicapping the likelihood of government policy playing a significant role at stemming imports? How does that change if imports start to weigh on domestic producers as the investigation unfolds?
To be clear, if you think there is a 50/50 chance the government enacts preventative tariffs on flat rolled products at the current rate of 928k st/m, then what is that probability if imports increase to 1.1st/m? How about 1.2m st/m? How skittish do buyers (both the importer of record and end buyer) get? Who takes the responsibility for the risk of the tariff and how many deals are killed over this part of the deal?
It is one thing to look at the ballooning differentials in a vacuum and assume a flood of imports will follow. It is another to take on multi-million dollar purchases with undefinable and unknowable risks. The relationship between the greed and fear related to imports is a story that will be very interesting to see play out. The Department of Commerce will hold a public hearing on the matter next Wednesday, May 24th.
Don’t forget the lessons learned from the previous slew of trades cases. First, there was simply the threat and uncertainty surrounding the trade cases and more cases being filed. This had a major effect on not only the number of imports, but also created complications such as who would take the liability of the potential duty, legal fees, availability, etc. Second, there were the legal merits of each case.
With the 232 investigation, we are already seeing (First) some effects of the threat and uncertainty around the investigation as the noise and questions surrounding what the investigation could mean have started to permeate conversations internally, with customers and with others in the industry. Second, since it is an executive order, do the merits even matter or can the Trump Administration do as they please? This is adds another level of uncertainty vs. the uncertainty seen in the previous trade cases.
AISI Steel Capacity Utilization Rate and TSI Daily HRC Price
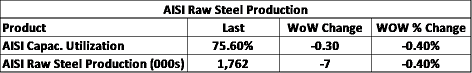
AISI production data showed production fell 13k tons to 74.5% capacity utilization.
Coking coal continues to retreat with the SBB Hard Coking Coal falling to $170/t and low vol falling to 168/t. This sharp rise and fall was a result of Cyclone Debbie taking out logistics in Queensland. Commodities crash “up.” Consider what a significant supply disruption in the US would do to Midwest flat rolled prices at current inventory levels.
SBB Premium Hard Coking Coal Australian Export
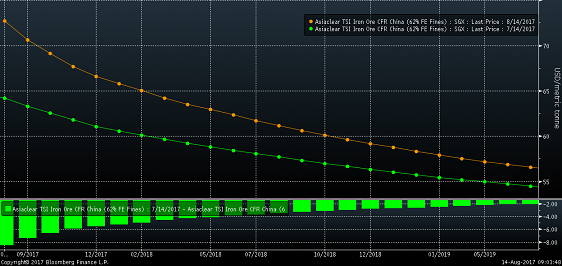
It was a quiet week with Black Sea pig iron falling 3.5% and iron ore under light pressure.

The jury is out on whether ore has put in a bottom or not. Check back next week.

The iron ore curve flattened noticeably during this past month’s sell off.
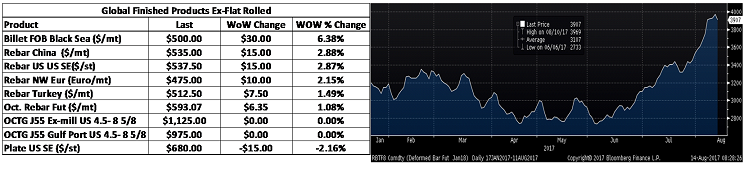
May Chinese rebar gained 4.6% last week with Turkish rebar up 1.5% and NW European rebar down 1.5%.

April small business optimism slipped marginally, but remains at strong levels. April YoY PPI Ex-Food and Energy was up 1.9%, beating expectations. April YoY CPI Ex-Food and Energy was also up 1.9%, but missed expectations of a 2.0% YoY rise. April retail sales were positive, but missed expectations. U of M sentiment remains strong at a better than expected 97.7.
China’s economic data was mixed with April YoY CPI at 1.2% and PPI at 6.4%. China’s April trade balance showed a $38b gain, beating expectations. Chinese foreign currency reserves increased to a better than expected $3.03 trillion.

Chinese aggregate financing and new yuan loans were better than expected and remain above the long term average.

The chart below shows YTD data through April. New yuan loans are making new highs while aggregate financing is getting close. China has pumped a tremendous amount of liquidity into their system. Earlier in the year, a Goldman Sachs analyst report indicated that a significant amount of financing moved into medium and long term financing for many old economy (manufacturing, infrastructure, commodities, etc.) companies.
April YTD Chinese Aggregate Financing and New Yuan Loans
Chinese M1 money supply grew 18.5% YoY. M1 is money that can quickly be turned into cash and includes cash, checking accounts and demand deposits. The chart below compares M1 money supply with Chinese HRC and iron ore prices. While it is far from perfect, there seems to be a lagged effect to HRC and iron ore prices a few months after changes in trend to China’s money supply. The consistent growth in M1 in 2016 and continued growth in 2017 could lead to a rebound in Chinese HRC and iron ore prices.
Chinese M1 Money Supply YOY Change (white), Chinese HRC (orange) and Iron ore (blue)
Chinese interest rates have been rallying since October, 2016. This blunt effort by the PBOC (People’s Bank of China) to quell the sharp price rally in tier 1 real estate has materially slowed appreciation and in turn pressured steel prices lower.
Chinese 10 Year Treasury Yield

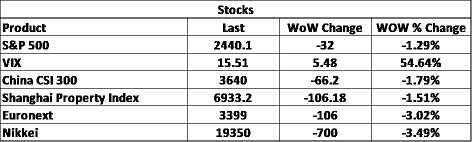
The Chinese stock market sold off in April.
Chinese CSI 300 (China’s S&P 500)
China’s economic policy of increasing interest rates and restrictions in the property market may be coming to an end. The 19th National Congress of The Communist Party of China will be held in November and the assumption that the government will do whatever it takes to hold up the economy through the event might be spot on.
On Tuesday, May 16th, the PBOC executed its biggest one day cash injection into financial markets in nearly four months. This action looks to be aimed at reversing falling investor confidence resulting from the PBOC’s recent campaign to crack down on excessive borrowing in real estate investment. Perhaps this is the first sign that those efforts have played out for now. Watch for Chinese interest rates to fall for confirmation that the PBOC is in fact halting their campaign.
Stock markets were pretty quiet with only the Nikkei’s gain of 1.6% warranting notice. Japan has seen significant improvement in their economy in recent months.

Nikkei

Steel stocks were mostly lower last week. The stocks that fell sold off pretty hard.

US Steel

Olympic Steel

Iron ore miners were mixed.

Base metals were quiet with LME nickel up 2% and LME zinc down 1%

LME 3 Month Nickel
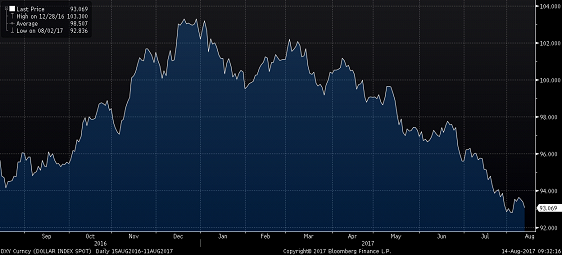
The dollar rebounded back above 99. Emerging market currencies saw gains.

US Dollar Index

Brazilian Real

Russian Ruble

Mexican Peso

- A rebounding energy industry

WTI crude oil rebounded close to $48. The US rig count added another 8 rigs to 885, while production inched higher. Crude oil inventory fell 1% and the sum inventory level fell almost 7k barrels. Natural gas has quietly moved up to $3.42/mbtu, the highest level since January even with natural gas inventory levels gaining 2%.
Natural Gas Futures

June WTI Crude Oil Futures

Aggregate Energy Inventory (Blue) vs. WTI Crude Oil Futures

D.O.E. Crude Oil Inventory


D.O.E. Crude Oil Inventory Perspective (1982 – Present)

Baker Hughes US Rig Count

D.O.E. Crude Oil Production

D.O.E. Crude Oil Production Perspective (1983 – Present)

The US 10-year Treasury yield inched lower to 2.33%.

U.S. 10 Year Bond Yield

The list below details some upside and downside risks relevant to the steel industry. The bolded ones are occurring or look to be highly likely. Upside risks look to be in charge.
Upside Risks:
– Section 232 Investigation
– Low inventory levels/domestic or global restocking
– China pumping up its “old economy”
– Energy industry rebound
– Border adjustment tax
– Big rally triggered by price increases/low inventory/restocking
– President Trump’s agenda
– Infrastructure bill/long-term solution to highway spending bill
– China getting serious about curtailing steel production
– Transportation supply constraints
– Essar labor issues
– Post-election economic pick up
– Unplanned domestic supply side disruptions
Downside Risks:
– Political uncertainty – Reflation trade reversing
– Increasing oil and iron ore inventory levels
– Sharp and persistent drop in oil and iron ore prices
– Automotive industry under pressure
– US domestic producers bringing back on capacity
– Higher interest rates slowing residential construction and auto sales
– Tightening financial conditions pressuring auto sales driven by sub-prime financing
– Chinese restrictions in property market
– The Chinese Financial Crisis
– Unexpected sharp China RMB devaluation
– Rebound in import volumes
– Increasing import differentials
– Resumption of US dollar rally/currency issues/sovereign default
– U.S. (manufacturing) recession
– Falling ferrous raw materials and global finished steel prices
– Economic downturn, especially in China or Europe reverberating to U.S.A.
– Weak demand in housing or automotive