Last week, the ISM Manufacturing ROB, US construction spending, US auto sales and the employment report were released. This data is outlined below. Last Friday, California Steel Industries announced a $30 price increase on flat rolled products. It was followed by a number of other mills early this week. While the industry digests this latest round of pricing, the “buy the dip” theme remains intact as fundamental data continues to be strong. We see the following data points as the foundation of our current view:
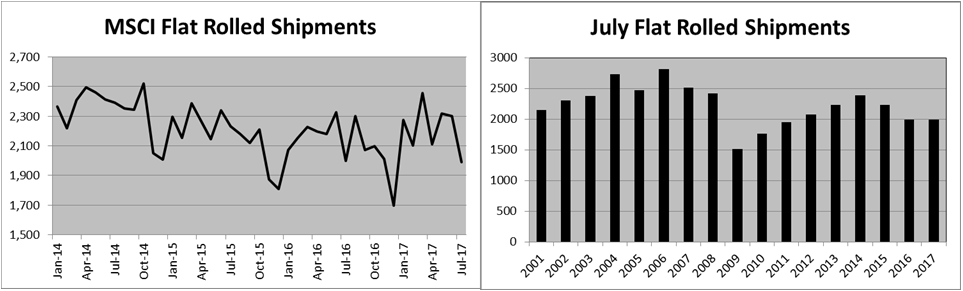
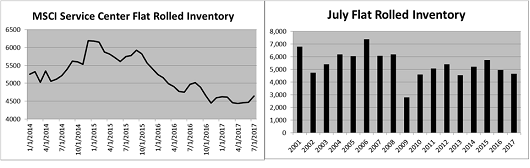
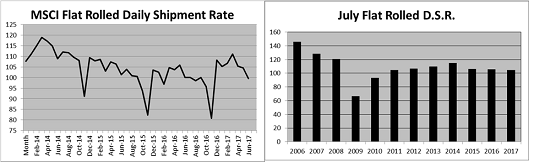
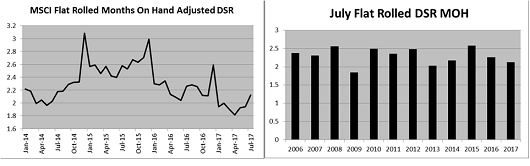
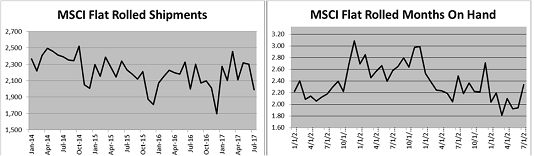
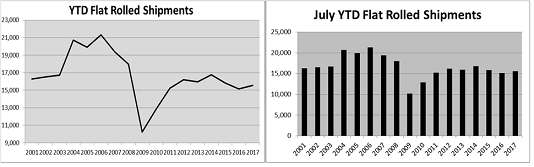
- Persistently low flat rolled inventory evidenced in the MSCI, ISM and Durable Goods reports
- A rebounding US energy industry
- A global uptrend in manufacturing purchasing managers indexes
- The Section 232 investigation launched by the Trump Administration
- Relatively low HRC imports with trade restrictions
May’s ISM Manufacturing PMI gained 0.1 to 54.9, just above expectations for no change.
ISM Manufacturing PMI and TSI Daily Midwest HRC Index

The May ISM Manufacturing PMI is broken down below. The Prices sub-index dropping 8 points was most notable.
ISM Manufacturing PMI

New orders gained 2 to 59.5 while backlog slipped 2 points to 57.
ISM Manufacturing PMI New Orders (White) and Backlog (Orange)

Inventories gained with producer inventory gaining 0.5 to 51.5 and customer inventory gaining 4 to 49.5, although still in contraction. Interesting fact: producer and customer inventory have not both been above 50 in the same month since November, 2014.
ISM Manufacturing PMI Producer (White) and Customer Inventories (Orange)

The April Inventory to Shipment Ratio ticked up to 1.69.
US Manufacturer’s Inventories to Shipment Ratio (Durable Goods Report)

Below is the ISM PMI with sub-indexes (left 2017 to right 2016).
The regional PMI reports are below. Energy focused Dallas and KC regions remain at very healthy levels. Philadelphia and Chicago are very strong while the Empire and Richmond dropped sharply.
The colors in the table above correspond to the appropriate PMI index below. The chart on the right normalizes the data.
1.51m light vehicles were sold in May up 6% MoM, but down 0.6% YoY. The Daily Sales Rate was up almost 11% MoM and down 4.6% YoY. YTD sales of 6.937 units are down 2% or 143k units YoY.
May Seasonally Adjusted Annualized US Auto Sales of 16.58m units were down from the 16.81m rate in April and missed expectations of a 16.91m annualized rate. Note the strength in the (inverted) unemployment rate and the historical correlation with auto sales. (To be clear, a falling unemployment rate is a positive development, but to make sense of the chart, Bloomberg inverts the series by taking 1/unemployment rate.)
US Auto Sales (white) and the Inverted Unemployment Rate (orange)
The chart on the right takes a 3 month moving average on the nominal monthly sales. This chart paints a much stronger picture for auto sales than some of the seasonally adjusted data.
US Auto Sales NSA and 3 Month Average NSA Auto Sales
May auto inventory improved sharply after falling 8 days to 68 MoM.

Wards Auto Inventory Data per Auto Manufacturers

The data in the charts above and below shows healthy inventory levels at FCA, Ford and improving inventory at Honda, Nissan and Toyota. GM, on the other hand, will have to address their excess inventory.

Seasonally adjusted construction spending was down 1.4% MoM, badly missing expectations of a 0.5% gain. However, March’s MoM data was revised higher to a 1.1% gain from a drop of 0.2%. SA total spending gained 6.7% YoY. Total private spending gained 10.4% YoY while private residential spending was up 16% YoY.

YTD nominal data continues to trend higher for all segments. Total spending gained 5.84% YoY.

YTD total private spending gained 9.2% YoY.

YTD Private Residential spending gained 12.39% YoY.

YTD Private nonresidential spending gained 5.86% YoY.

The May employment report disappointed with a gain of only 138k jobs vs. expectations of 182k. April’s gains of 211k were revised lower to 174k jobs. The unemployment rate improved to 4.3% beating expectations of 4.4%
US Nonfarm Payrolls Monthly Change & Indexed and US Auto Sales

Below are May global manufacturing PMIs. The table on the right sorts by PMI indicating strength in Europe and weakness in Asia. The Chinese Steel PMI gained almost 3 points to 52.88.

The chart below includes the Eurozone, German, Italian, French and Spanish manufacturing PMIs. France and Italy were down while the Eurozone, Germany and Italy gained.
Eurozone (white), German (blue), Italian (green), French (yellow) and Spanish (red) Manufacturing PMIs
Manufacturing PMIs in the world’s largest economies continue to be in good shape.
US (white), German (blue), Chinese (green) and Japanese (red) Manufacturing PMIs

China’s official PMI was flat at 51.2 while the Caixan PMI slipped below 50 to 49.6.
China Official (White) and Caixan (Orange) Manufacturing PMIs

This table provides the Chinese Official PMI with sub-indexes back to May, 2016.
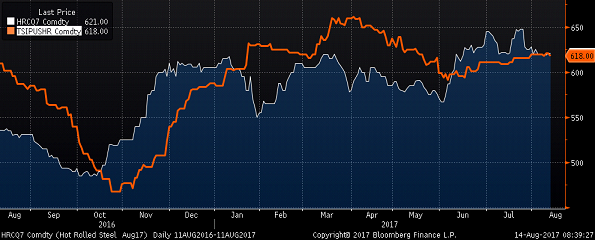
US Midwest flat rolled steel prices have been falling since early April.
June CME HRC Futures vs. TSI Daily Midwest HRC Price
US indexes saw prices fall sharply with the TSI Daily down $18 to $594 and SBB Platts down $8 to $588.

The TSI ASEAN price was down $5/st to $409/st. while the NE price was up $2 to $534.

The front of the CME Midwest futures curve was under pressure. June was down $8 to $575/st, July, August and September were all down $13 to $567 while Q4 fell to $570/st. The first half of 2018 was flat at $574/st.
The import uptrend looks to be hitting a speedbump in May.

Tube imports have exploded and while they look to be correcting sharply in May, they are up huge YoY.

- Relatively low HRC imports with trade restrictions
- 232 investigation launched by the Trump Administration
US price differentials (vs. R.O.W.) have rolled over dropping sharply in the past couple weeks. Starting at the end of March, the expectation for a surge of imported flat rolled material to arrive later this year gained steam and then was intensified as import differentials reached their highest levels since last summer. However, uncertainty brought by the 232 investigation, a sharp drop in May imports and falling global differentials could be a quick antidote to the recent downward pressure on sentiment resulting from these bloated differentials.
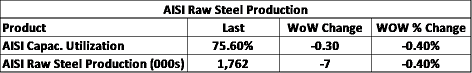
AISI Steel Capacity Utilization Rate and TSI Daily HRC Price

AISI production data improved again to 75.2%. Capacity utilization correlates well with prices.

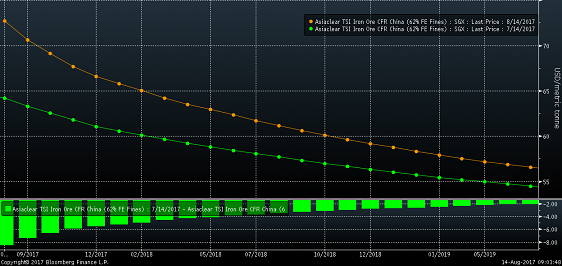
Iron ore prices were down again.

Scrap remains flat while iron ore futures made new lows.

Not much change in the shape of the iron ore curve as prices have fallen 17% in the past month.

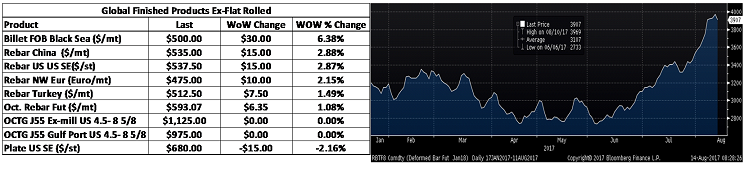
Chinese rebar futures gave back 5% while US plate prices fell 2.75%.

Most of last week’s economic data below has already been discussed. The Core PCE remained subdued at 1.5% YoY. The March Case Shiller 20-City Home Price Index showed continued to gains up 5.89% YoY and beating expectations. April Pending Home Sales were down 1.3% MoM, missing expectations of a 0.5% gain.

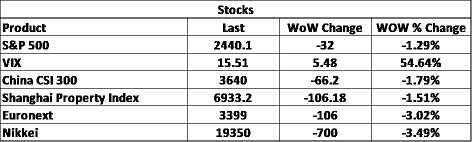
The S&P 500 continued to march to new all-time highs. The Shanghai Property Index and Nikkei saw nice gains.

S&P 500

Nikkei 225

Steel stocks were mixed.

US Steel

Iron ore miners were all down with ore.

Base metals were mostly lower with zinc falling 4.2% and nickel down almost 2%.

LME 3 Month Zinc

The dollar fell below 97 to 96.72, a new post-Trump low. The euro continues to rally closing in on 1.13. The Turkish lira and Russian ruble rebounded while the Mexican peso gave back some recent gains.

US Dollar Index

Euro

Turkish Lira

Russian Ruble

Mexican Peso

- A rebounding energy industry
The rebounding WTI crude oil failed falling 4.3% to $47.66. Natural gas fell 9.4% to $3.0/mbtu. Rig counts continue higher with production. Crude oil inventory fell almost 1.25% and the aggregate inventory fell 1%. Natural gas inventory rose 3.3%.
June WTI Crude Oil Futures

Aggregate Energy Inventory (Blue) vs. WTI Crude Oil Futures

D.O.E. Crude Oil Inventory

D.O.E. Crude Oil Inventory Perspective (1982 – Present)

Baker Hughes US Rig Count

D.O.E. Crude Oil Production

D.O.E. Crude Oil Production Perspective (1983 – Present)

The US 10-year Treasury yield fell to 2.16%. German 10 year yields also fell while yields rose in Spain, Italy, Japan and England.

U.S. 10 Year Bond Yield

The list below details some upside and downside risks relevant to the steel industry. The bolded ones are occurring or look to be highly likely. Upside risks look to be in charge.
Upside Risks:
– Section 232 Investigation
– Low inventory levels/domestic or global restocking
– China pumping up its “old economy”
– Energy industry rebound
– Weaker dollar
– Border adjustment tax
– Big rally triggered by price increases/low inventory/restocking
– President Trump’s agenda
– Infrastructure bill/long-term solution to highway spending bill
– China getting serious about curtailing steel production
– Transportation supply constraints
– Post-election economic pick up
– Unplanned domestic supply side disruptions
Downside Risks:
– Political uncertainty – Reflation trade reversing
– Increasing oil and iron ore inventory levels
– Sharp and persistent drop in oil and iron ore prices
– Automotive industry under pressure
– US domestic producers bringing back on capacity
– Higher interest rates slowing residential construction and auto sales
– Tightening financial conditions pressuring auto sales driven by sub-prime financing
– Chinese restrictions in property market
– The Chinese Financial Crisis
– Unexpected sharp China RMB devaluation
– Rebound in import volumes
– Increasing import differentials
– US dollar rally/currency issues/sovereign default
– Falling ferrous raw materials and global finished steel prices
– Economic downturn, especially in China or Europe reverberating to U.S.A.
– Weak demand in housing or automotive