Content
-
Weekly Highlights
- Market Commentary
- Risks
- ISM PMI
- Global PMI
- Construction Spending
- Auto Sales


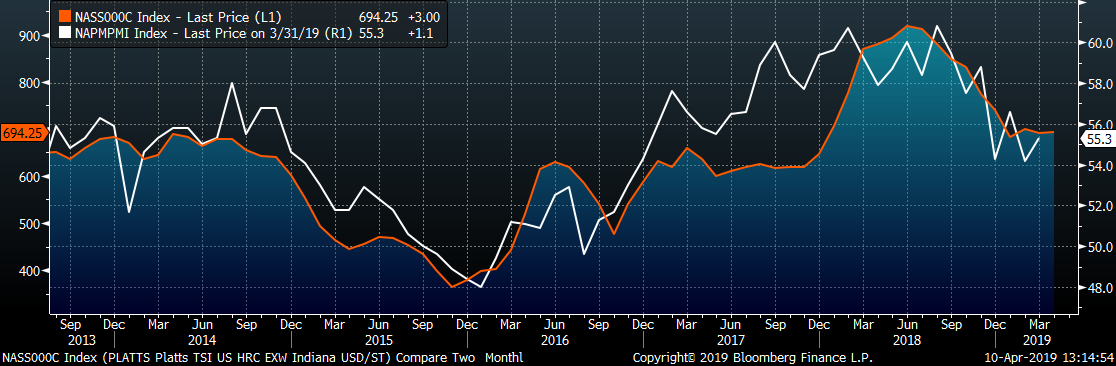
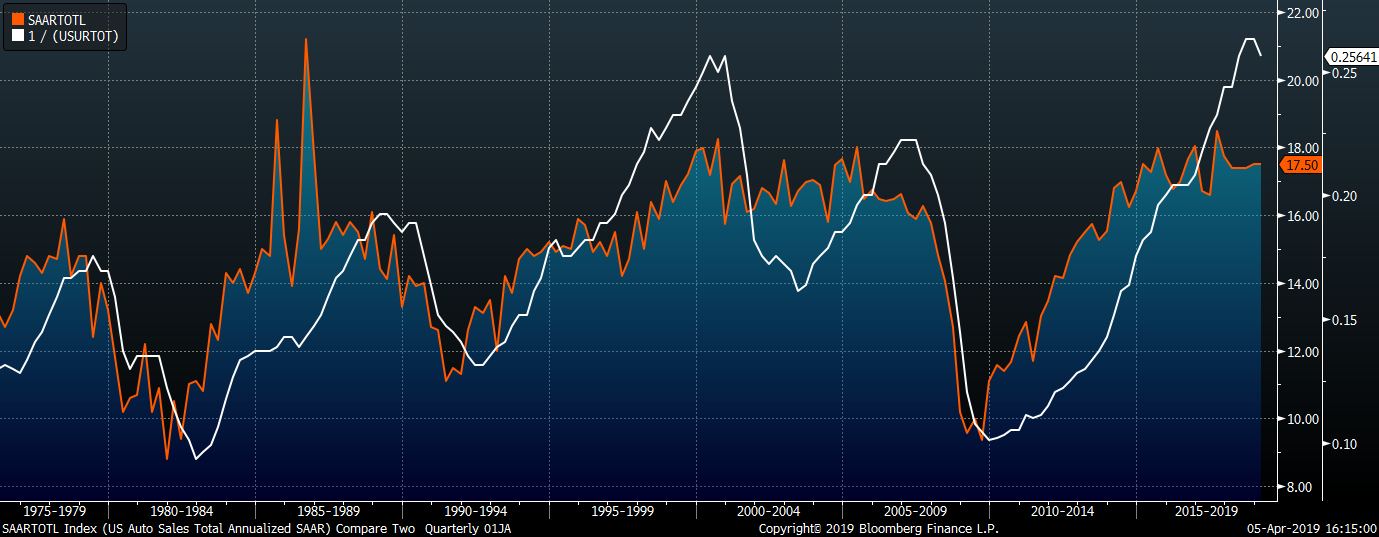
Last week this report noted the HRC price decline in the second half of 2018 was partially attributable to expectations of a slowdown in growth in 2019. Manufacturing PMIs across the world declined, and some moved into contraction. However, the March PMI data released over the last week (detail below) showed this downtrend stabilizing around the world. Specifically, China’s Manufacturing PMI moved back above 50 into expansion. The U.S. ISM PMI reading for March moved up from last month, and remains firmly in expansionary territory. This is an encouraging sign for steel prices, which have stabilized from their decline from 2019 highs. Below is a chart showing the correlation of the U.S. ISM PMI Index and the Platts TSI Midwest HRC Index:
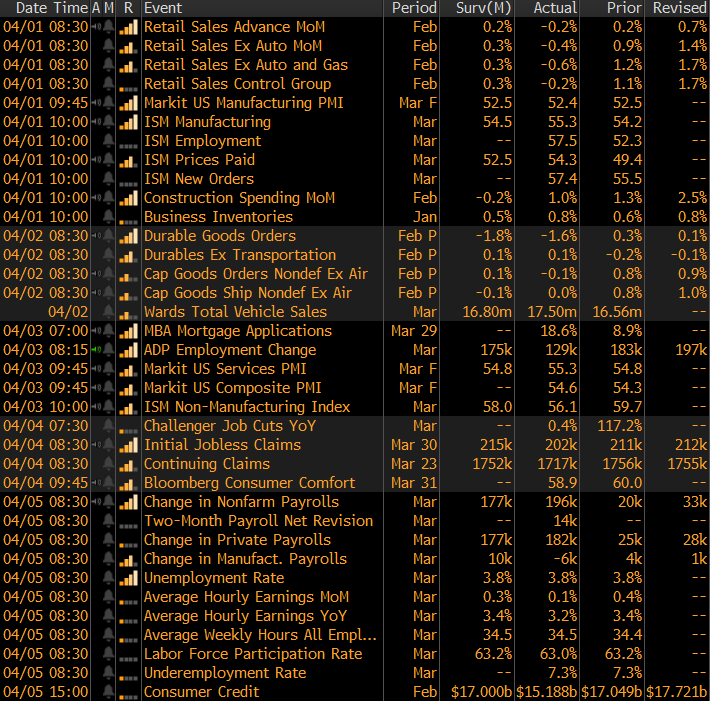
Additionally over the last week, March auto sales data (below) and February construction spending data (below) were released. Construction spending showed steady growth, albeit a lower level of growth than the strong year last year. Auto sales rebounded in March to a seasonally adjusted annual rate of 17.5 million. While below the peak level in 2017, annualized sales remain at historically strong levels.
Other developments last week that are supportive for steel prices:
While the above data points, among others, have stabilized steel prices, a catalyst to move prices higher has not emerged. Activity in the physical market remains muted, as mills have filled contracts and reduced spot transactions. The inventory overhang from the end of 2018 remains an obstacle as this material is slowly reduced, but replacing this high cost material at current market prices is attractive. Additionally, any restocking is likely to occur domestically, as the import price remains unattractive.
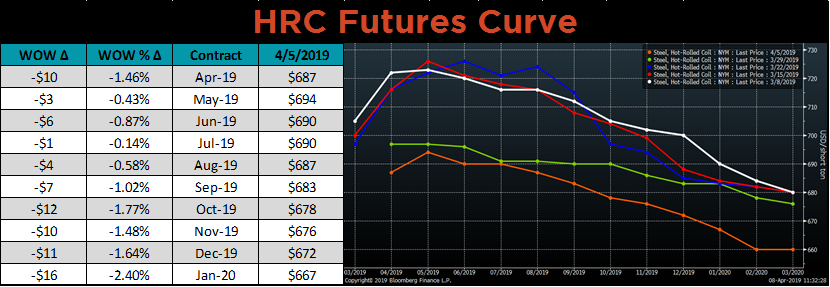
Future prices moved slightly lower over the last week, with the largest declines occurring in the back of the curve. Regarding prices, we hold a cautiously optimistic outlook.
Upside Risks:
Downside Risks:
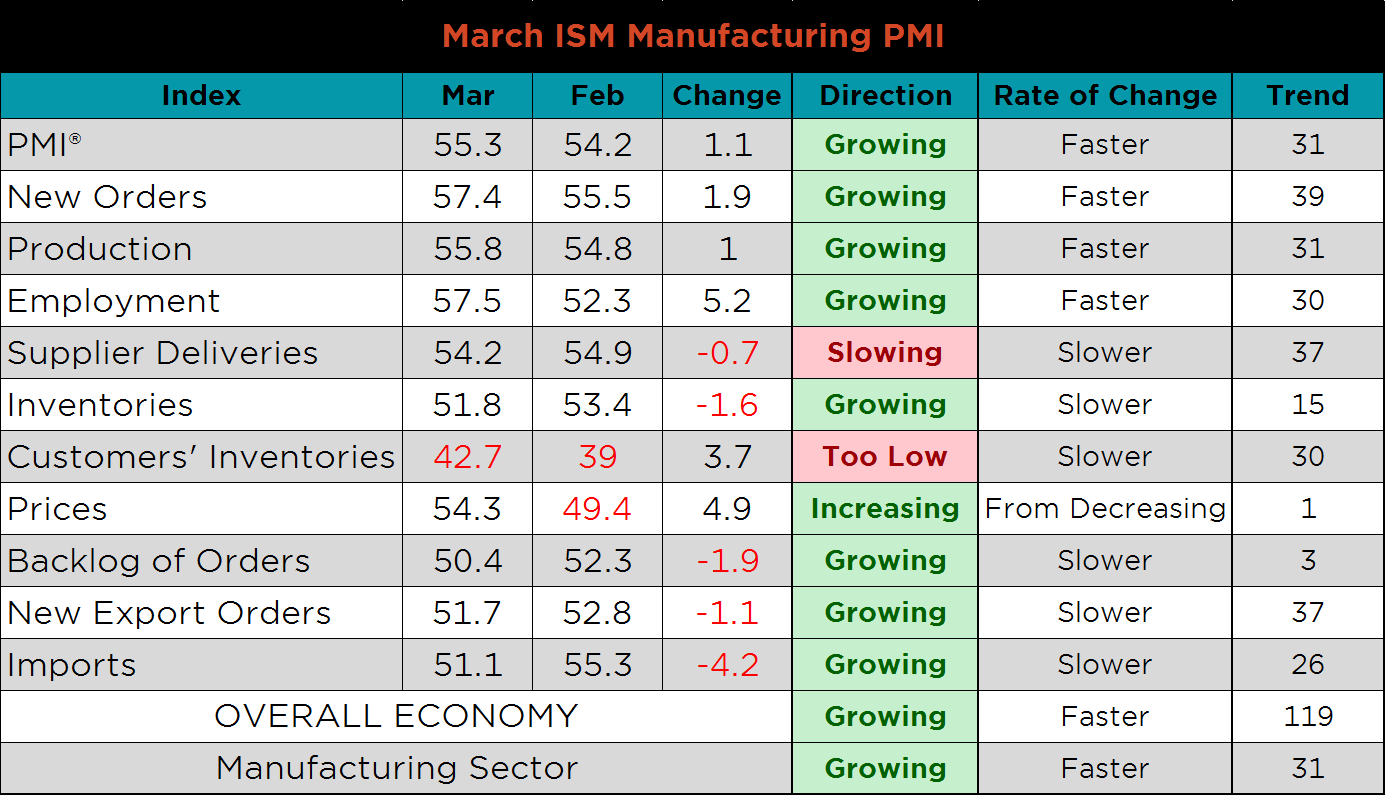
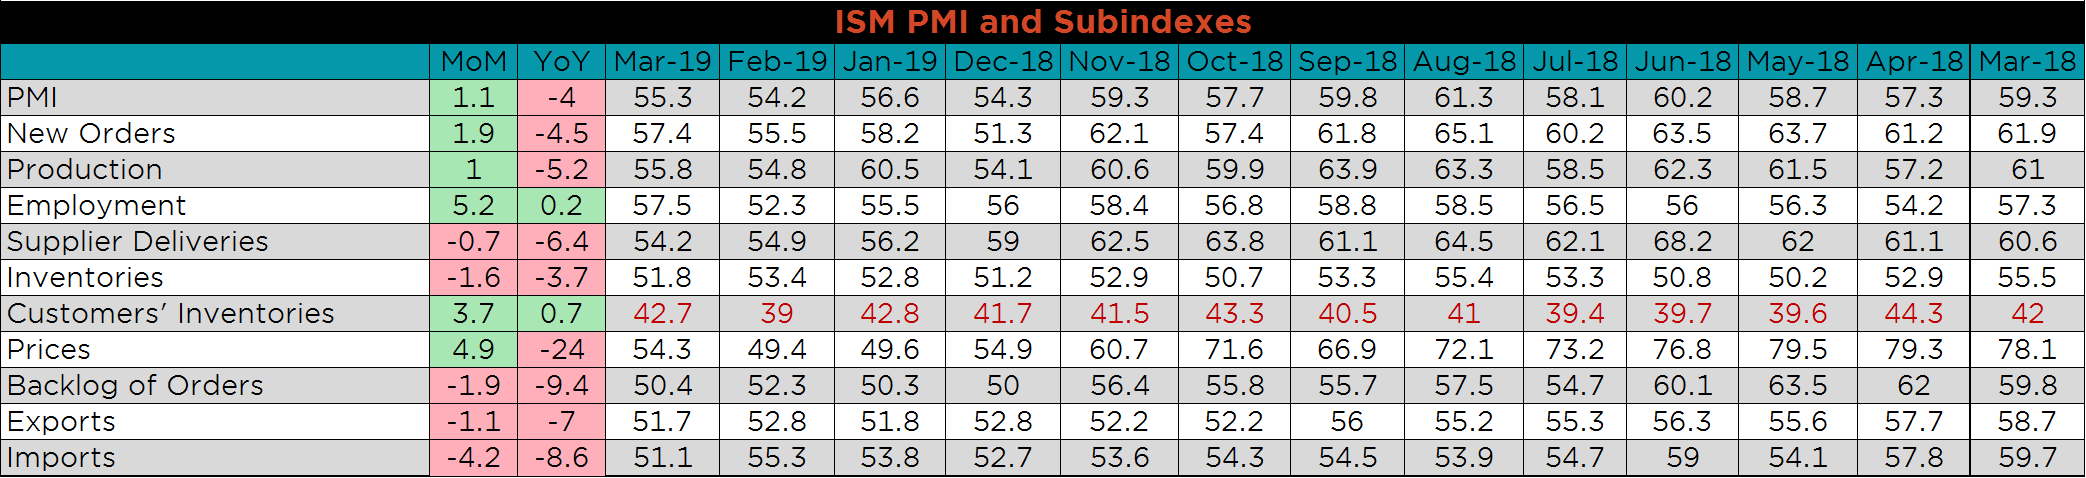
The ISM Manufacturing PMI printed at 55.3 for March, 1.1 points higher MoM. The employment, prices, and customers’ inventories subindexes made sizeable improvements, although customers’ inventories remain in contraction. Imports decreased the most but still printed in slowed expansion.
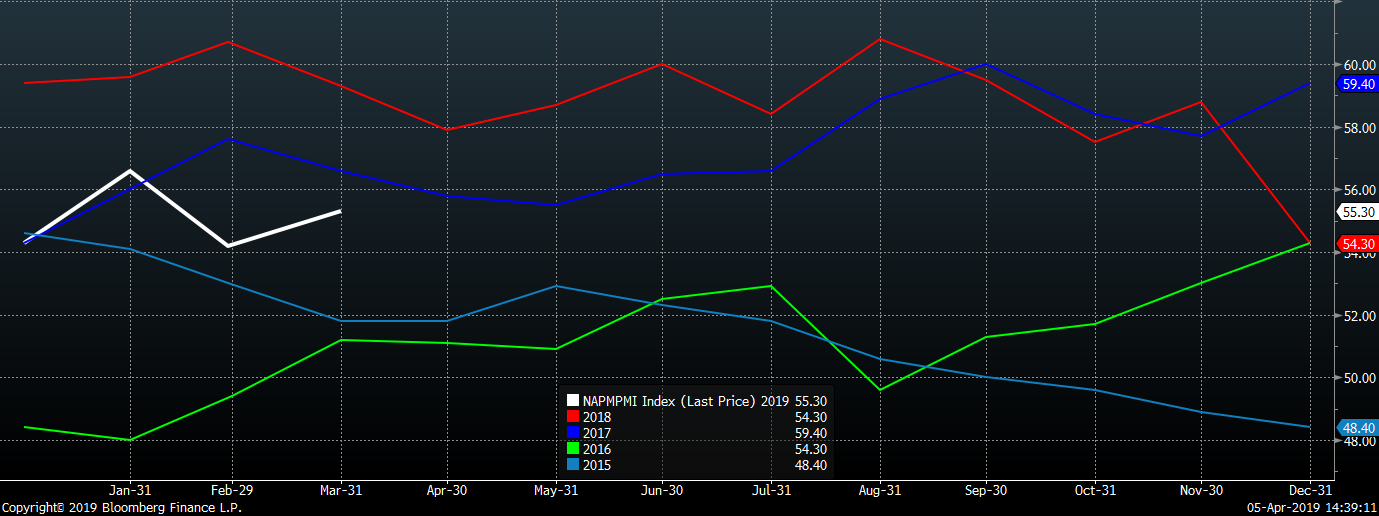
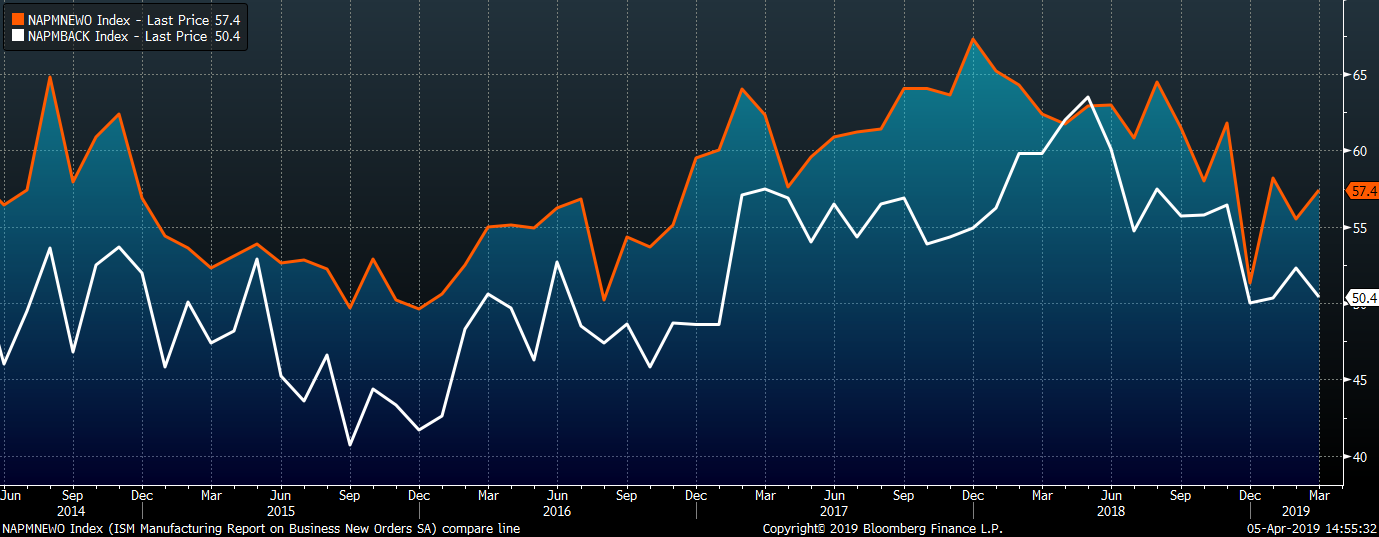
The white line below shows how 2019 is tracking so far compared to the previous 4 years.
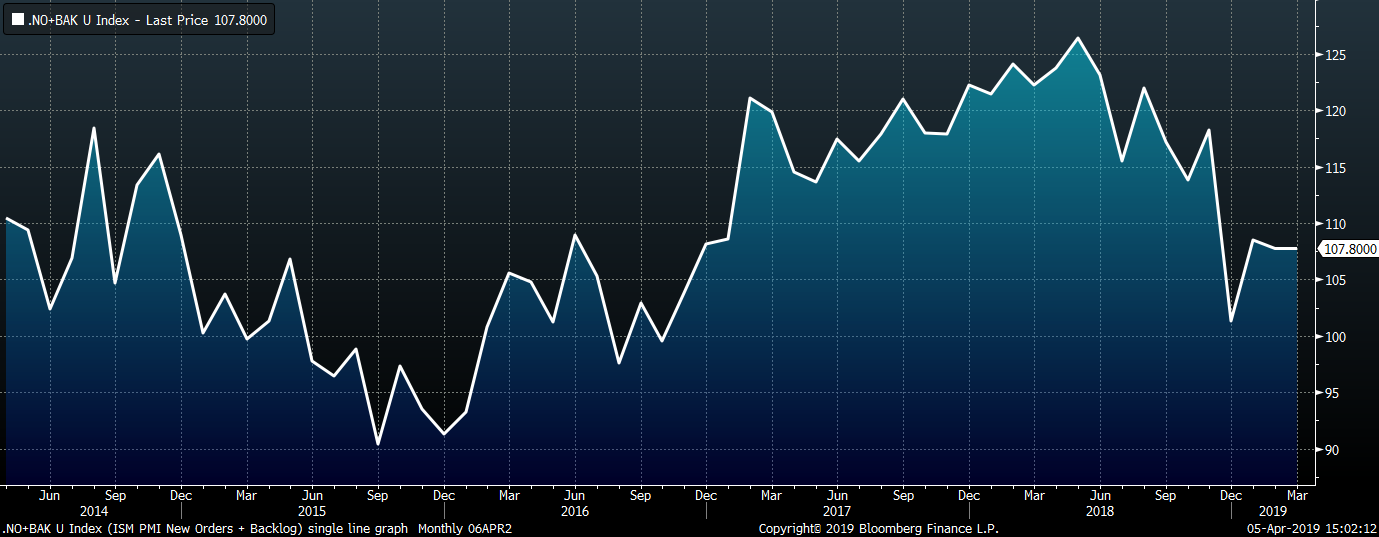
The March ISM new orders subindex rose 1.9 points to 57.4, while the backlog subindex fell 1.9 points to 50.4. The second chart adds the new orders and backlog subindexes to provide a good gauge for manufacturing demand. Recent printings suggest stabilization after fears of an overall slowdown in late 2018.
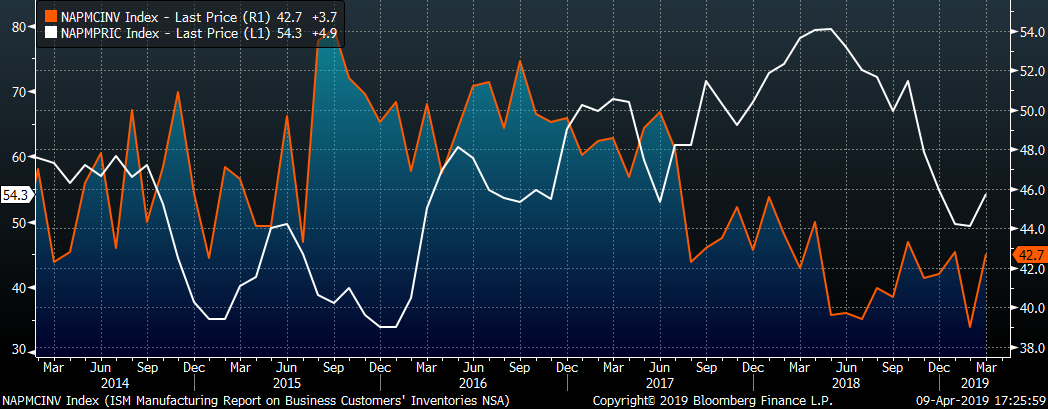
The chart below shows both the prices subindex and the customer inventory subindex. Recent low printings in customer inventories suggest a need for restocking, which is more likely now that prices have declined.
This table shows the monthly ISM PMI and subindexes back to March 2018.
The March global purchasing manager indexes show a reshuffling with China and Spain moving into expansion and Mexico and France both dipping back below 50 into contraction. Germany continues to move deeper into contraction.
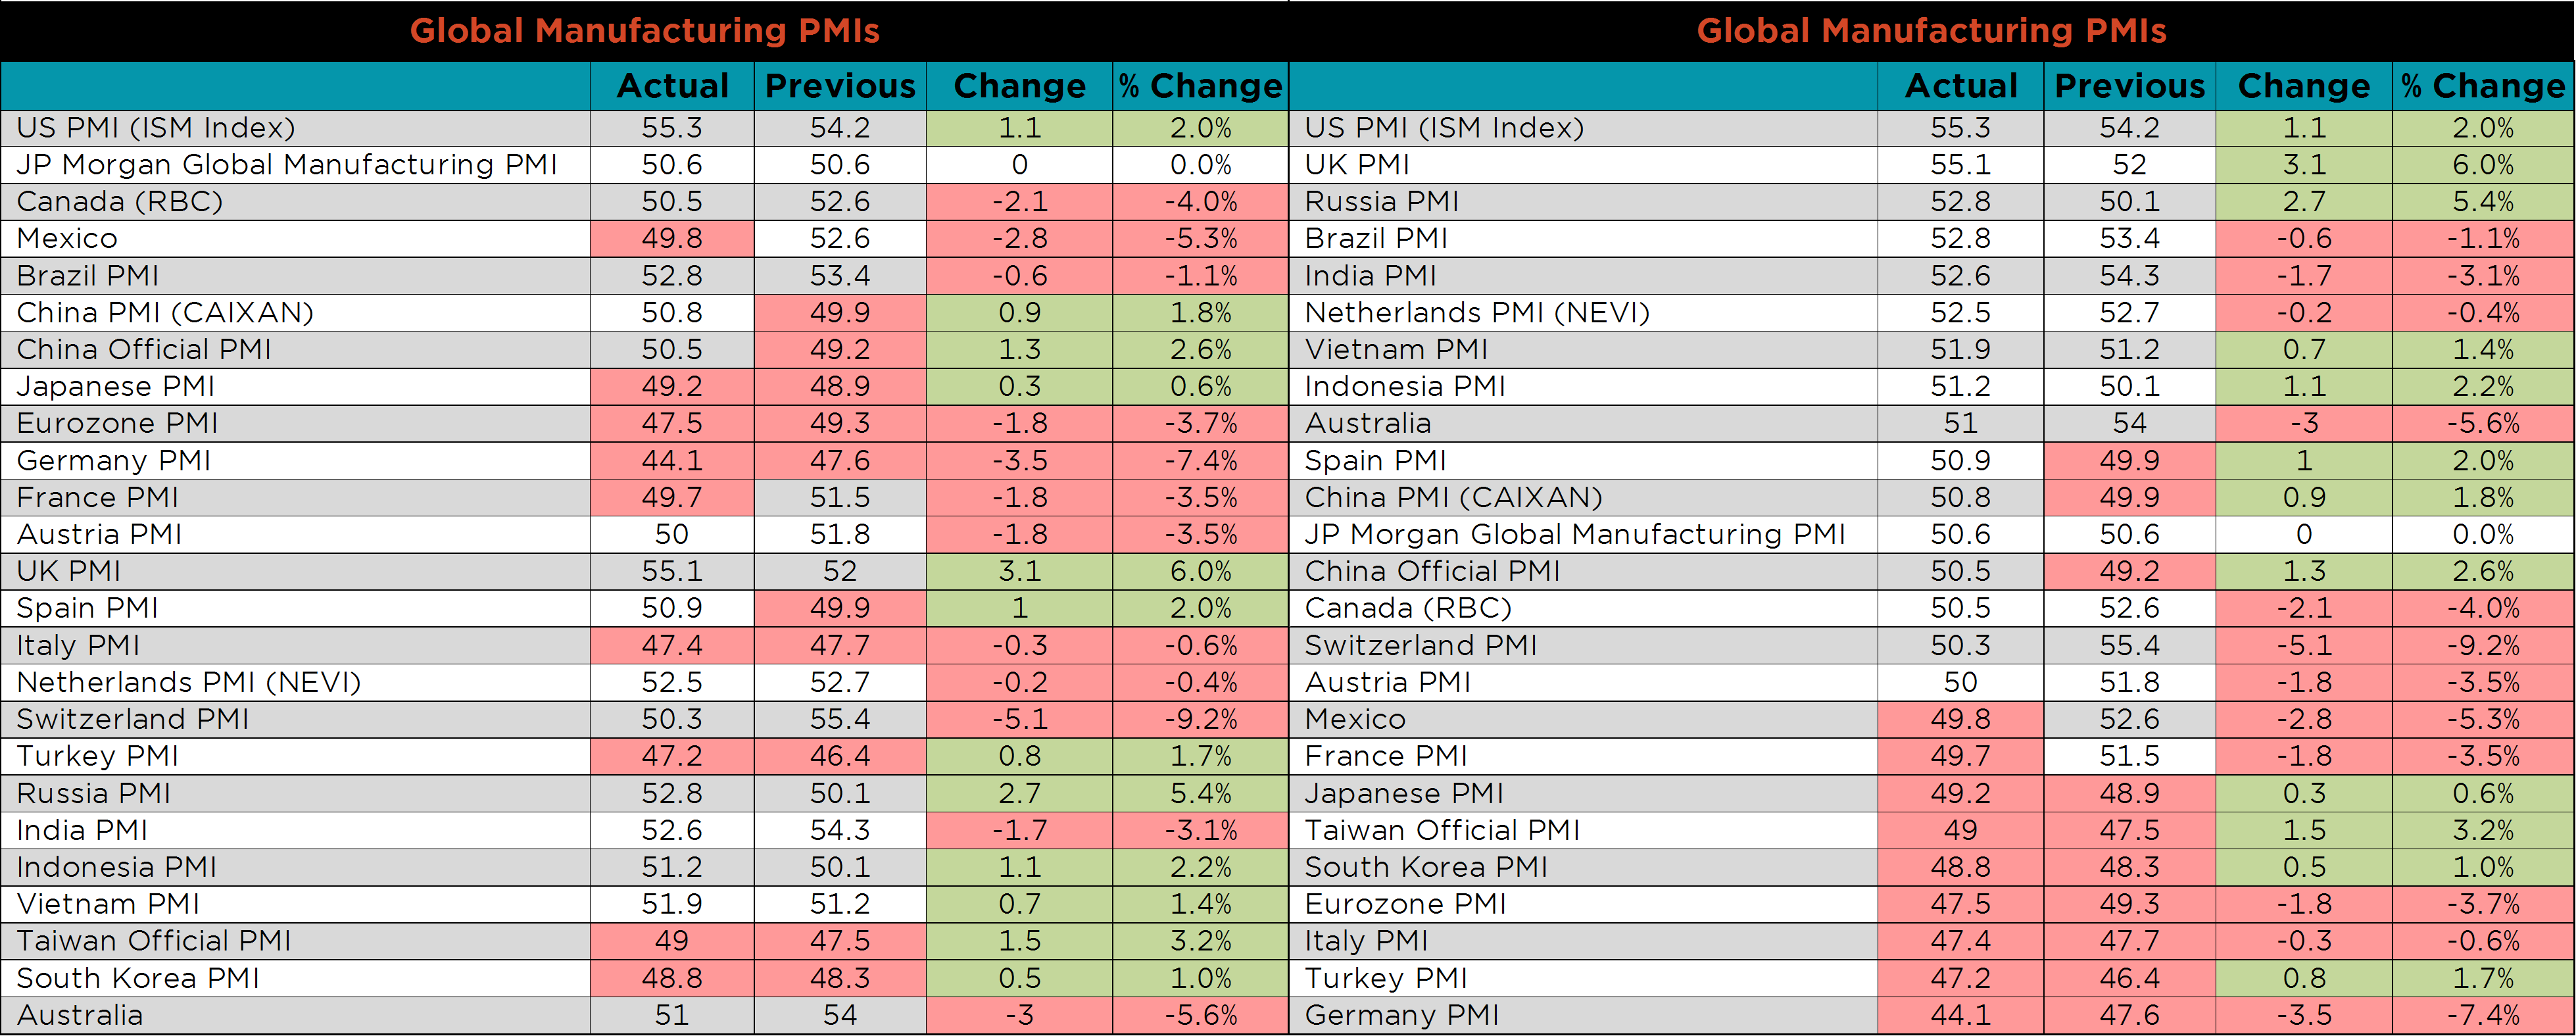
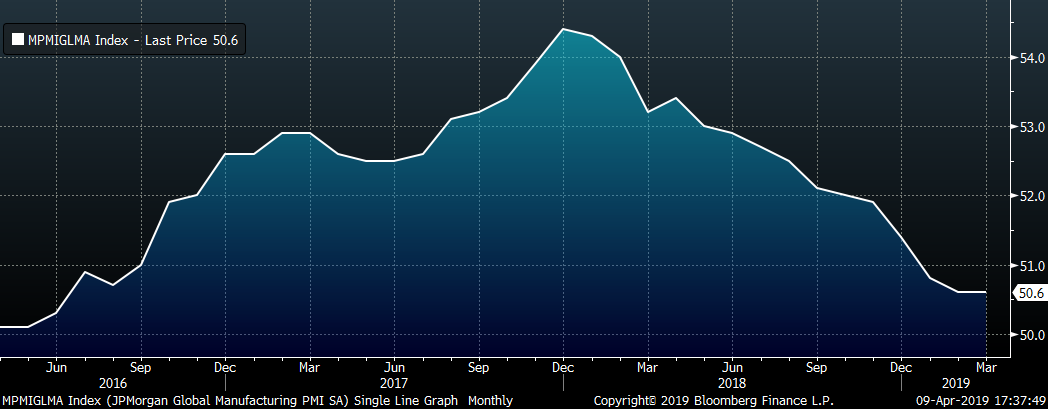
The JP Morgan Global Manufacturing PMI printed unchanged MoM at 50.6, its lowest level since August 2016.
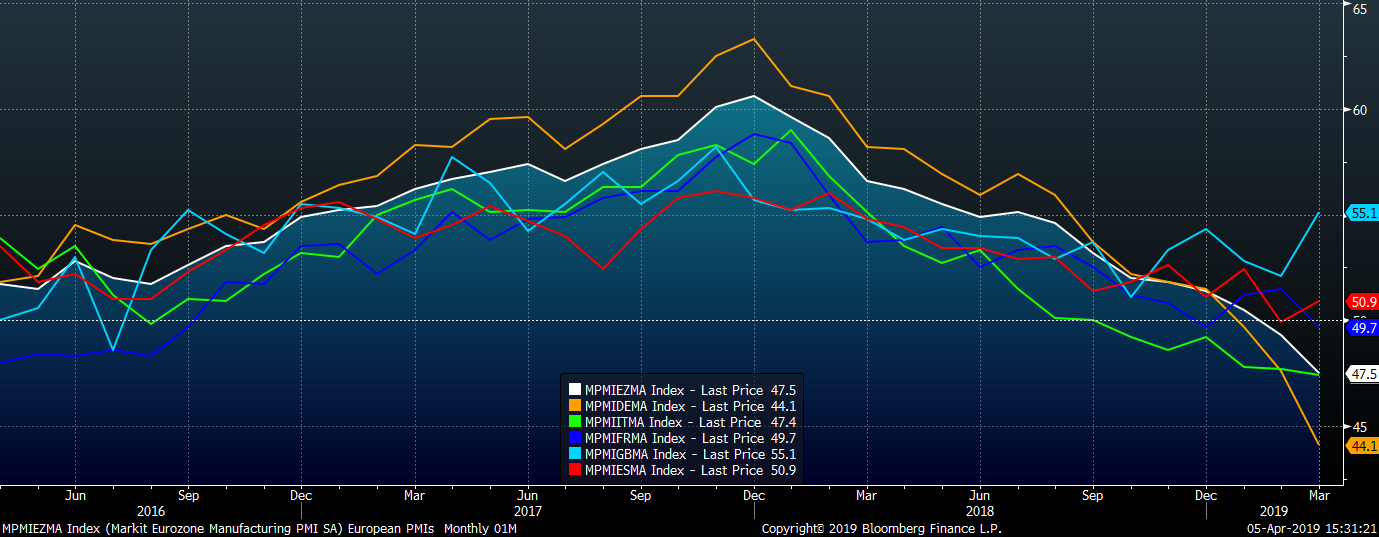
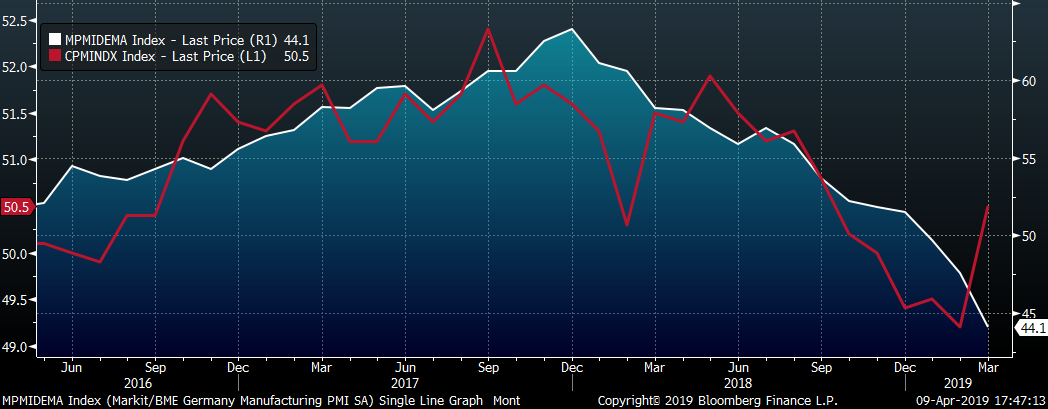
The overall downtrend in European PMIs continued in March, culminating in the Eurozone PMI falling into contraction for the first time since September 2016. Keep an eye on the German and Chinese PMI printings in the next couple of months. The two countries are currently trending in opposite directions, but the stabilization in China, a barometer for global demand, should bode well for Germany’s export driven manufacturing sector.
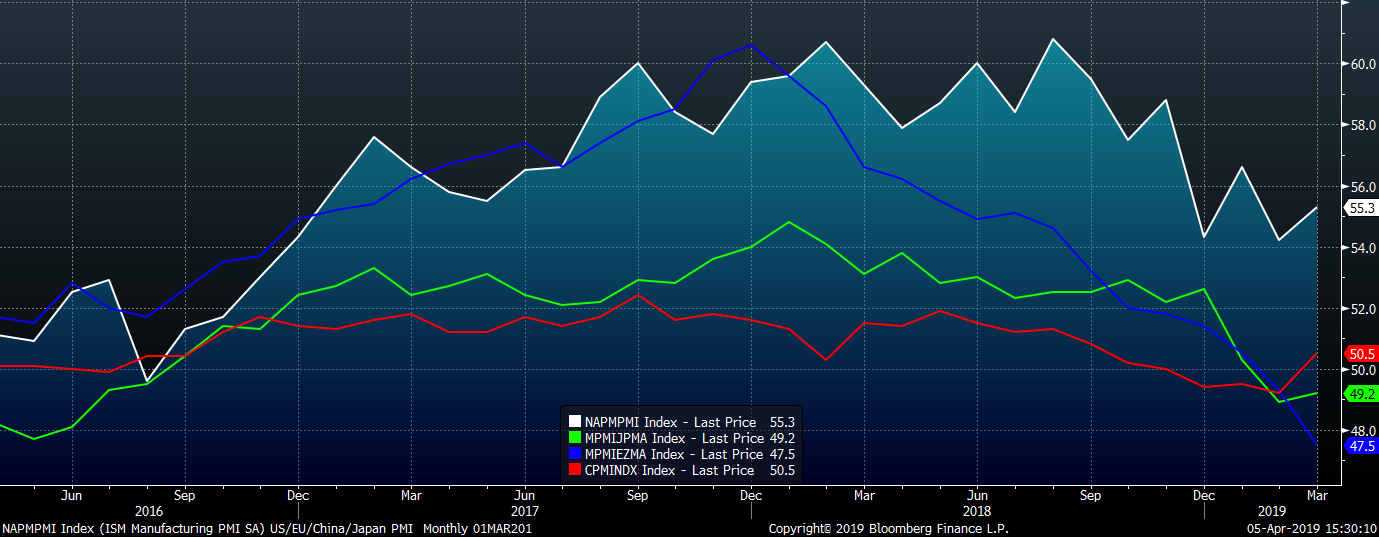
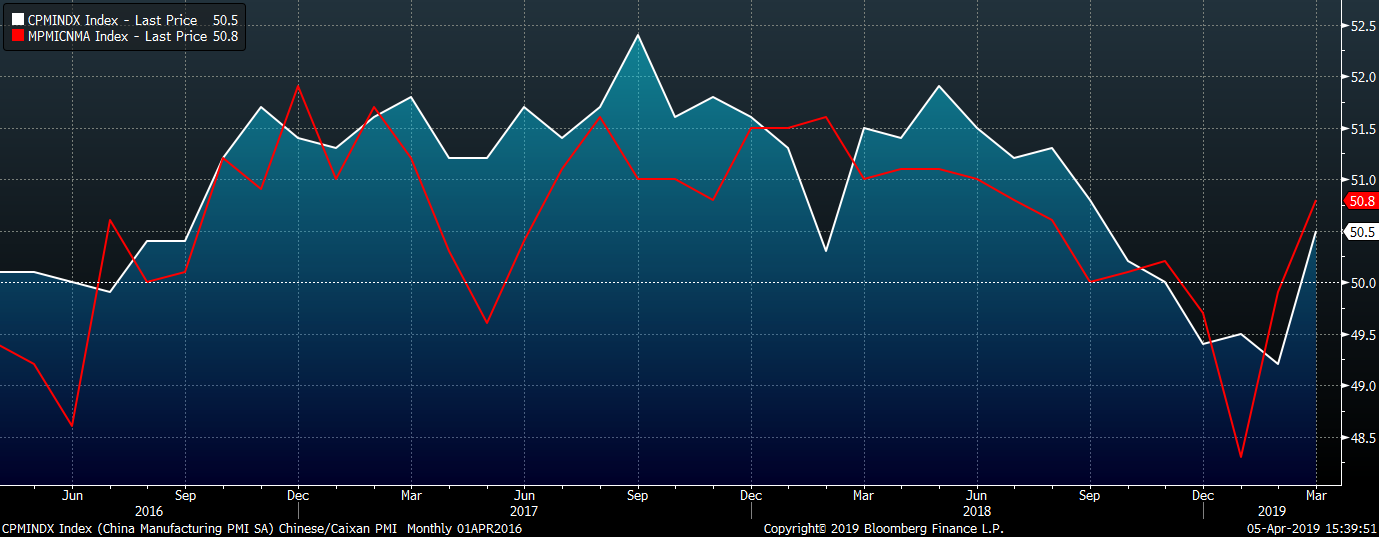
Both China’s official and the Caixan PMI’s printed into expansion for the first time in 2019.
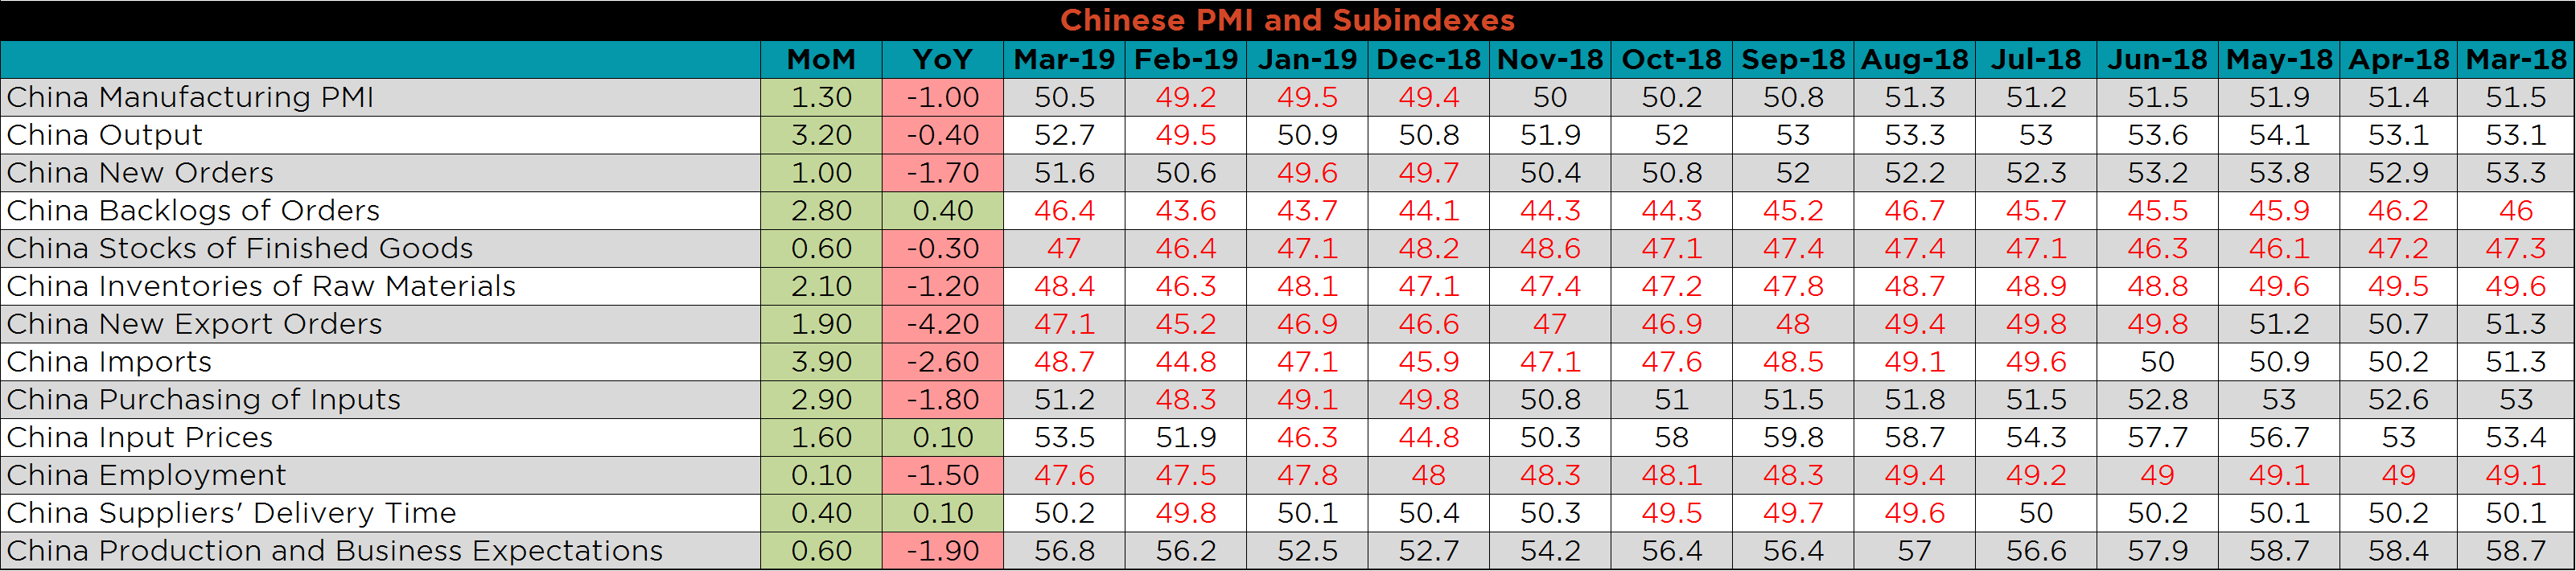
The table below breaks down China’s official manufacturing PMI subindexes, and presents a possible turning point. Every subindex improved MoM, but six of the thirteen remain in contraction.
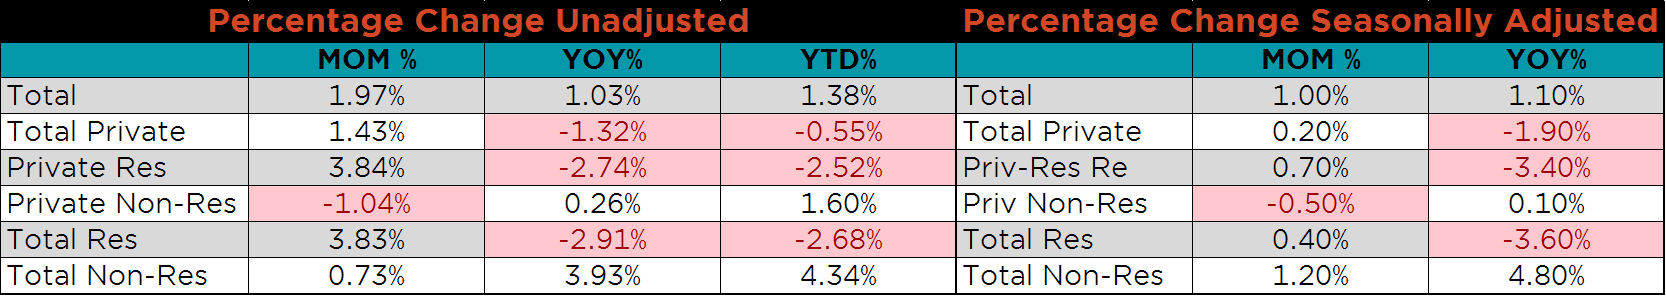
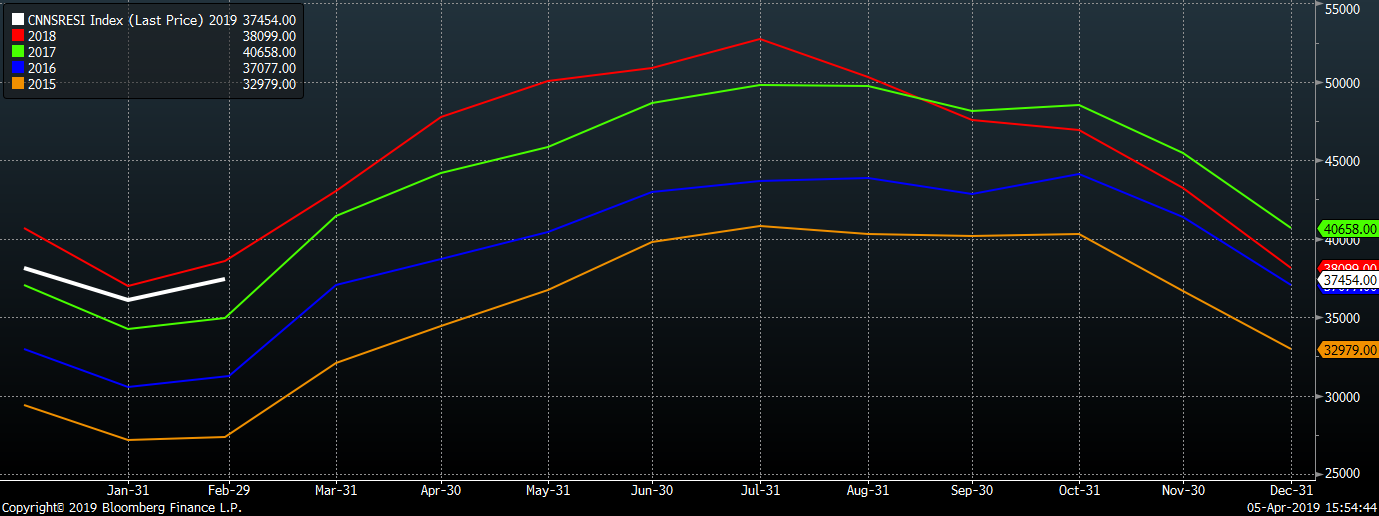
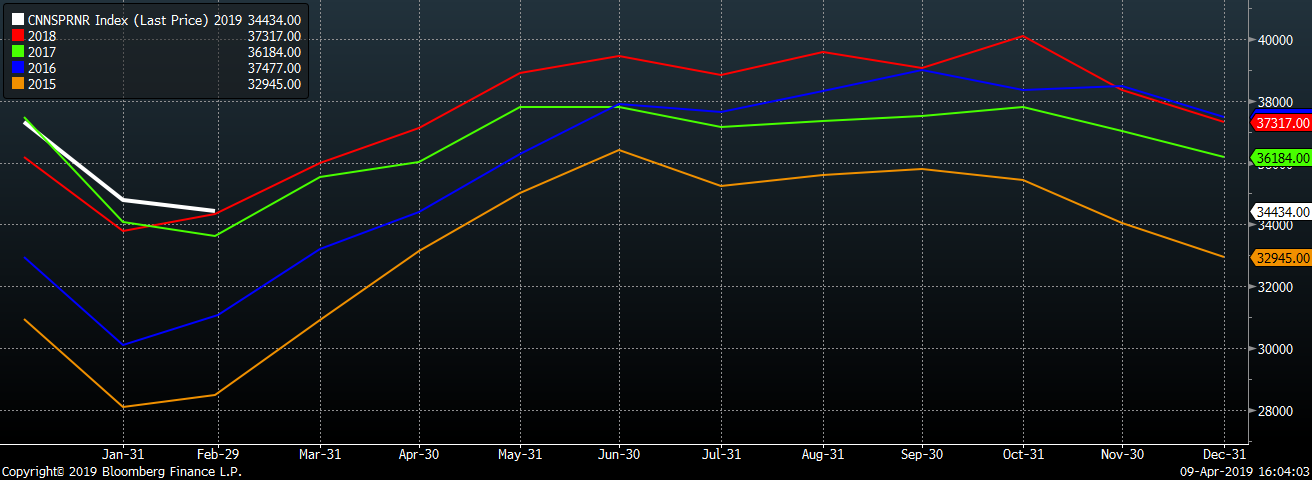
Seasonally adjusted February U.S. construction spending was up 1% MoM and 1.1% YoY. Unadjusted February total construction spending was 1% higher YoY while YTD spending is 1.4% higher YoY. Unadjusted U.S. residential construction spending was down YoY, but remains the second highest of the last 5 years. The decrease in interest rates this year should help the residential sector. Private nonresidential construction spending, the most steel intensive component, was lower MoM, but continues to grow from the high levels of 2018.
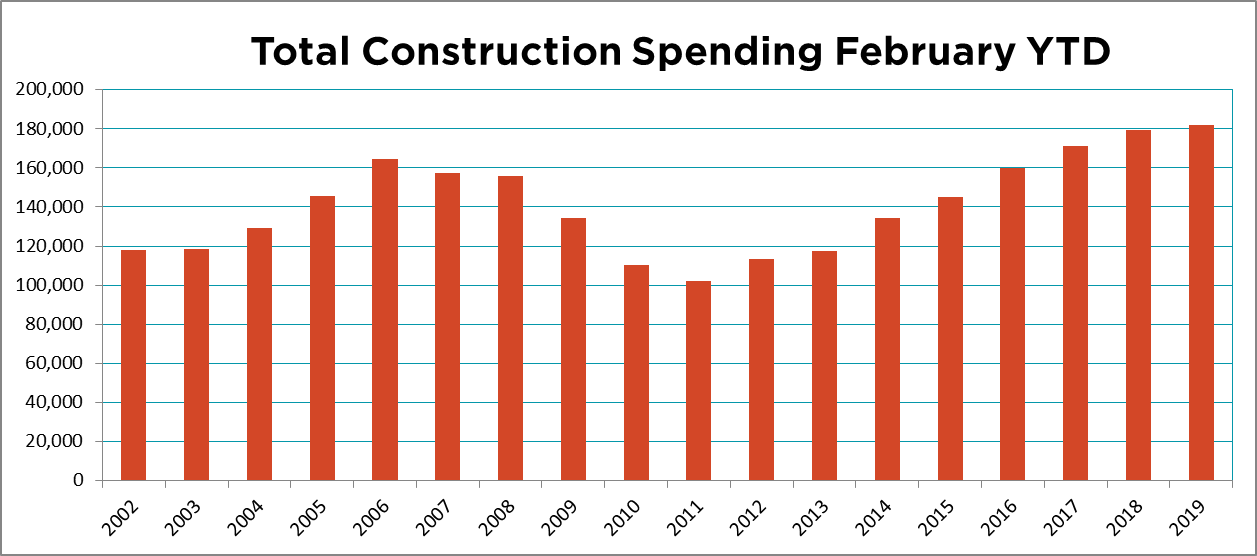
The white line in the charts below compares spending for the first two months of 2019 to the spending over the previous 4 years.
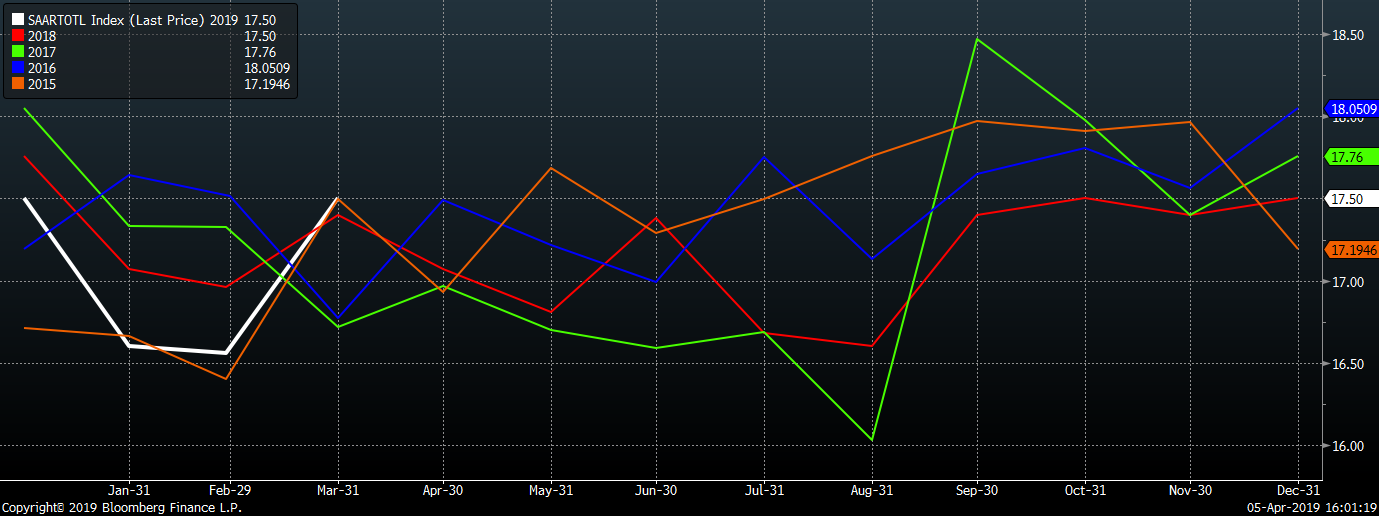
March U.S. light vehicle sales were up to a 17.5m seasonally adjusted annualized rate (S.A.A.R). The March U.S. auto sales rate rose to match the highest reading for March of the last 5 years. While the auto sales rate has leveled off from the growth over the last decade, it remains at strong levels and looks to stay elevated with the strength in the job market. The U.S. added 196,000 nonfarm payrolls in March and the unemployment rate remained at 3.8%.
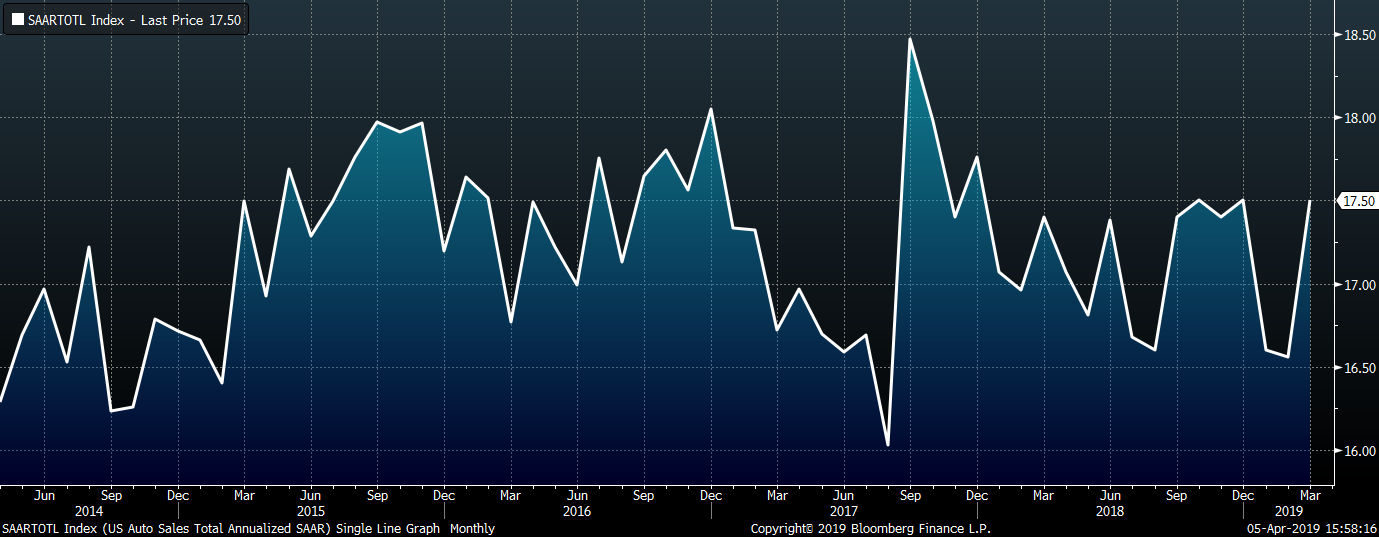
The white line in the chart below compares the annualized sales rate for the first three months of 2019 to the rate over the previous 5 years.
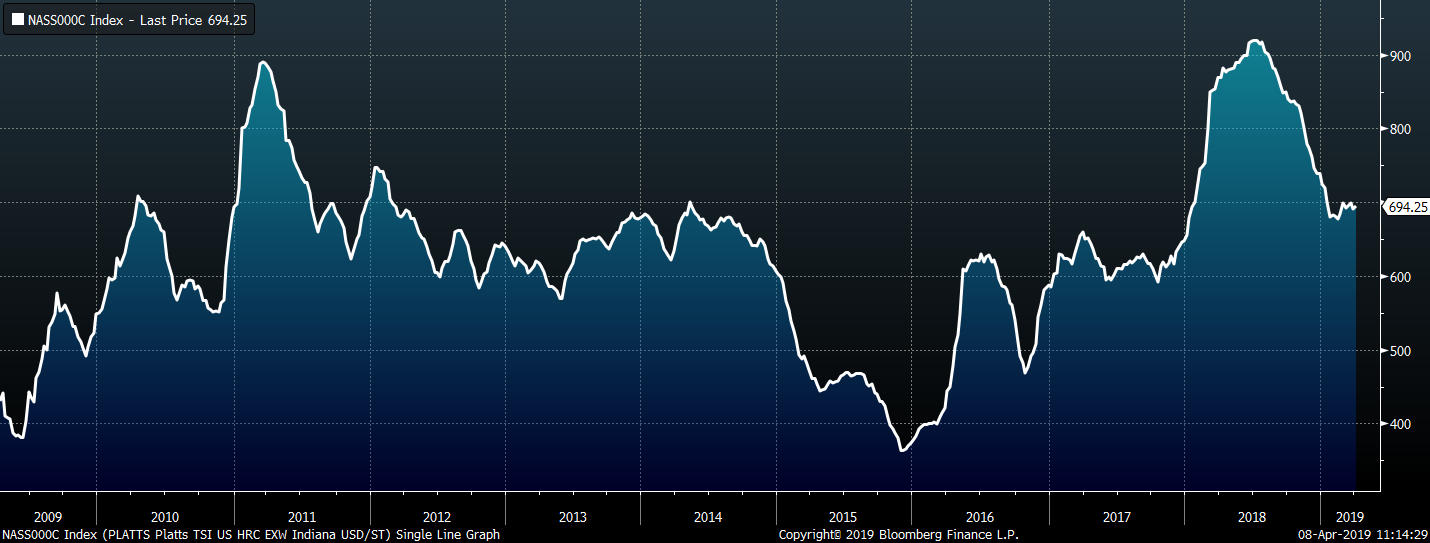
Platts TSI Daily Midwest HRC Index was up $3 to $694.25.
The CME Midwest HRC futures curve shown below with last Friday’s settlements in orange.
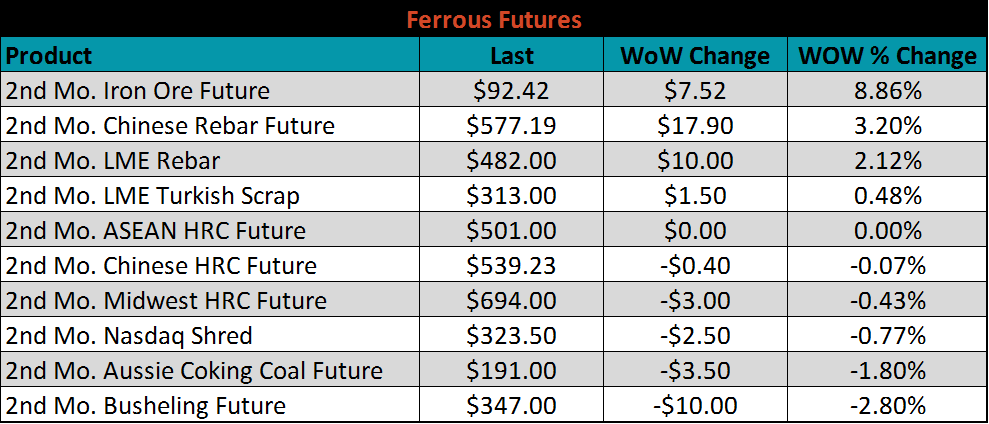
April ferrous futures were mixed. The coking coal future lost 3.1% and the ASEAN HRC future fell 2.1%..
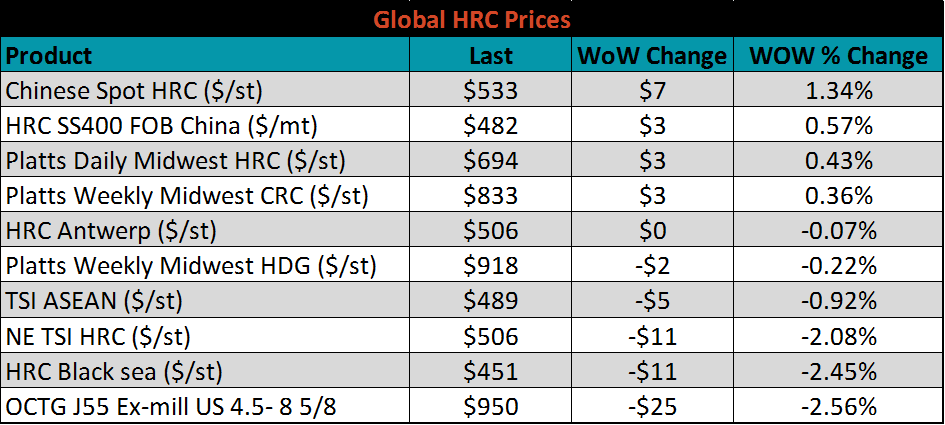
Flat rolled indexes were mixed. Platts Midwest HRC is up 4%, while U.S. OCTG prices were once again under pressure.
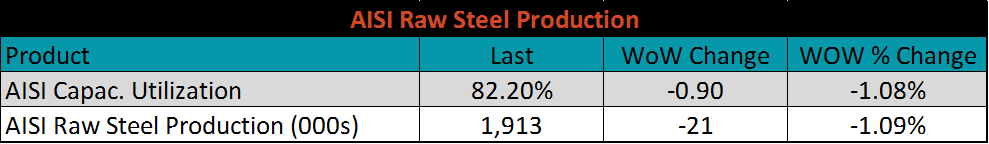
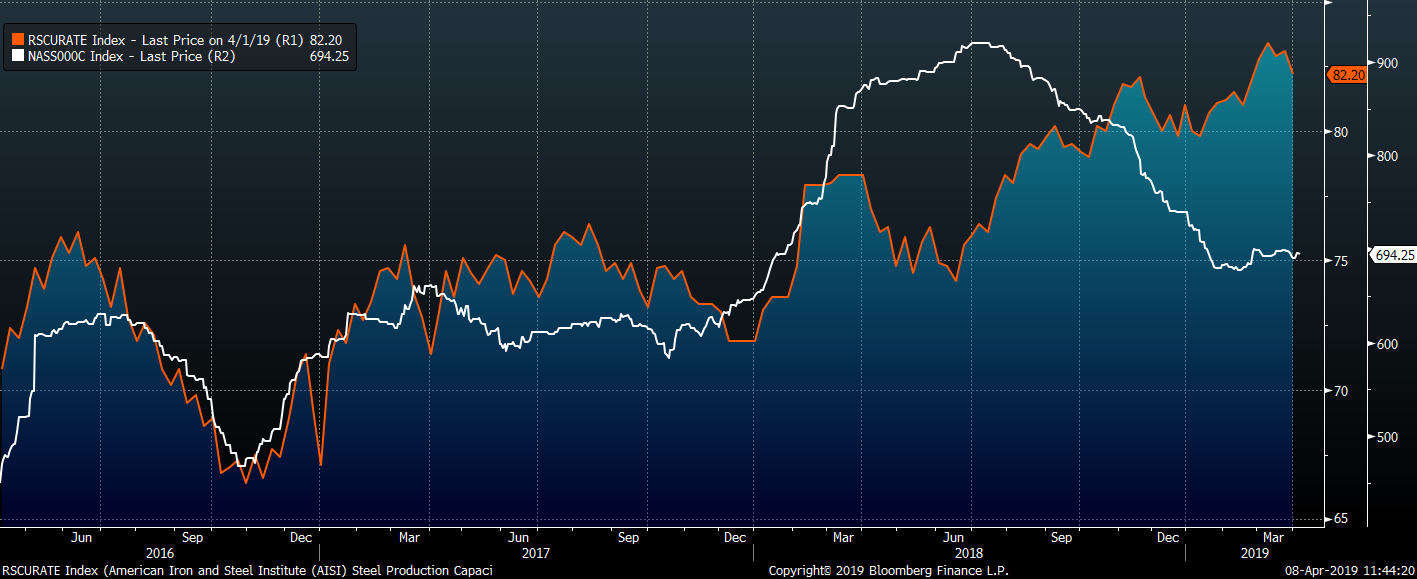
The AISI Capacity Utilization Rate is down 0.9 points to 82.2%. The Trump administration’s goal of 80% Capacity Utilization Rate has held since October 2018.
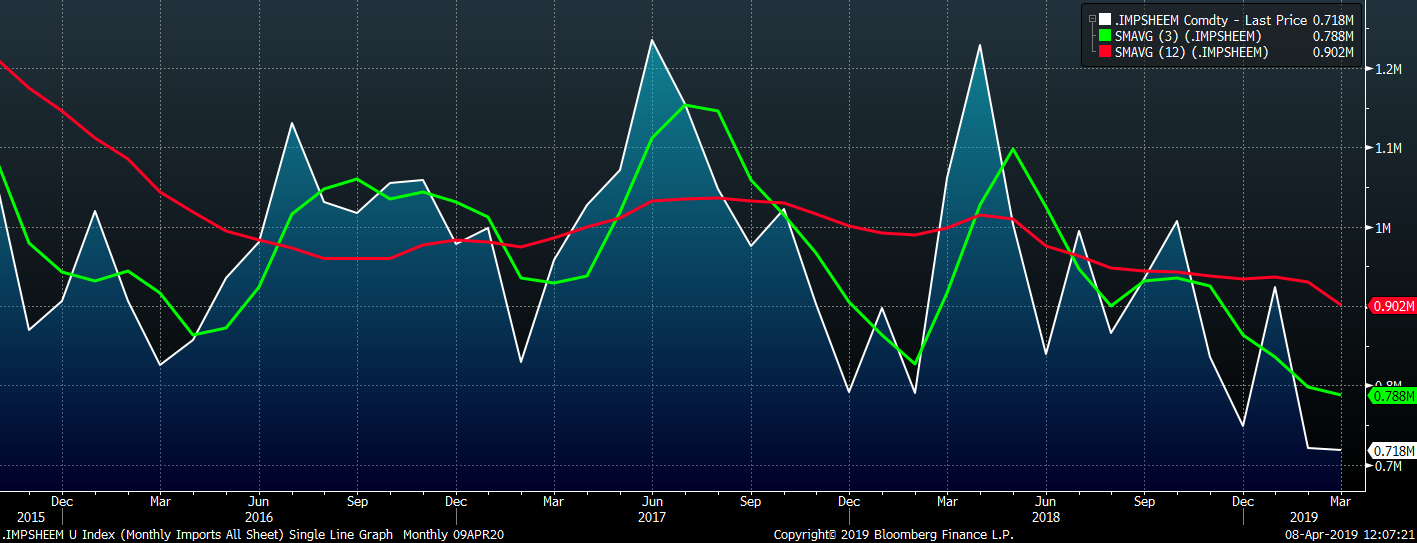
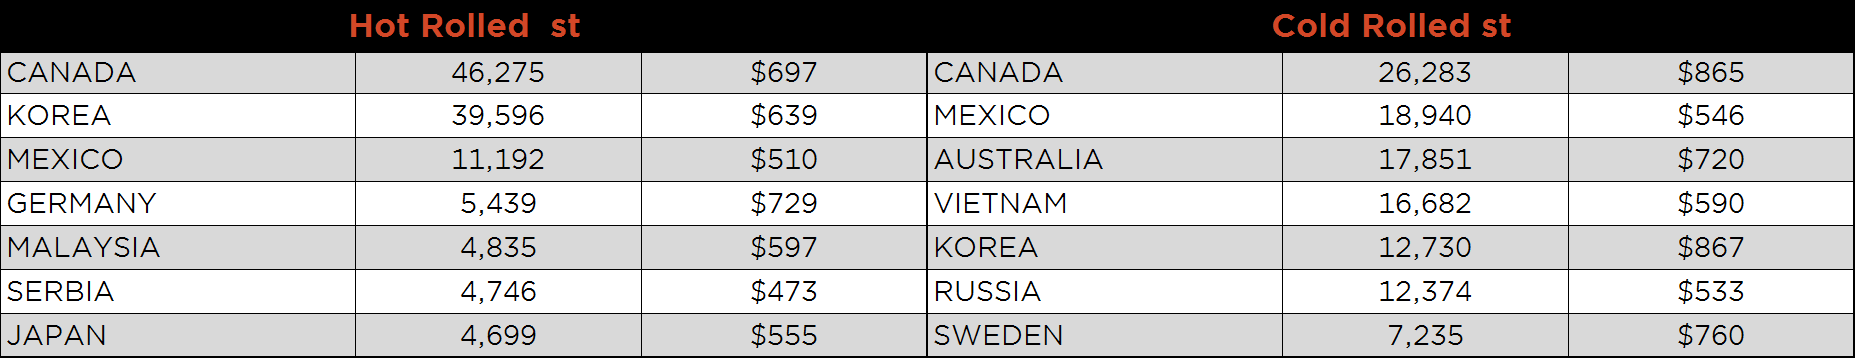
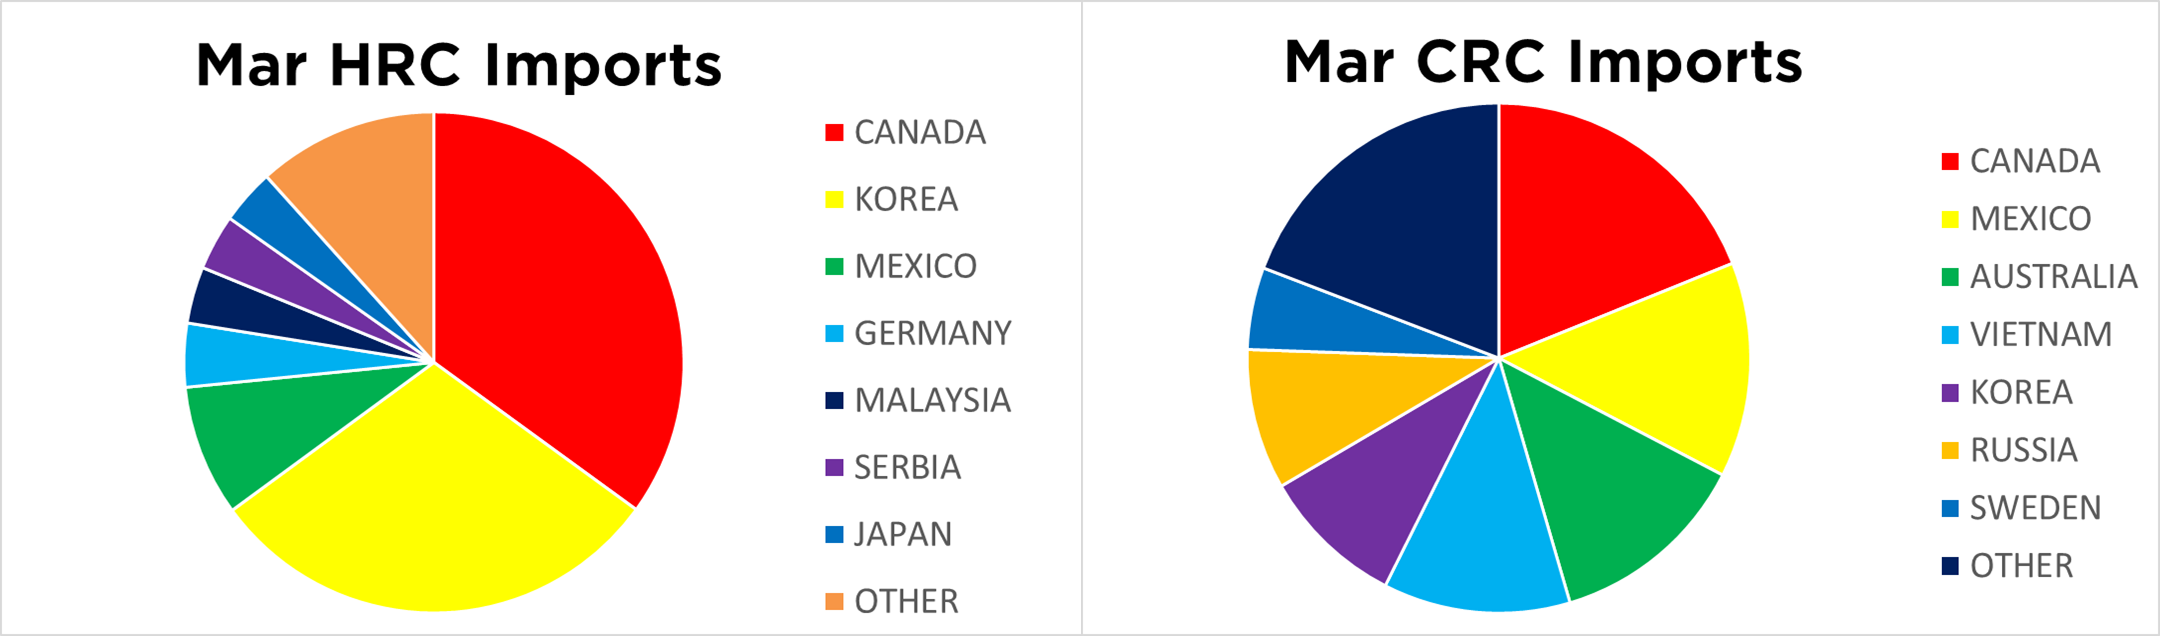
March flat rolled import licenses are forecast to decrease slightly to 718k MoM, while February flat rolled import licenses are forecasted to fall 202k tons MoM to 721k.
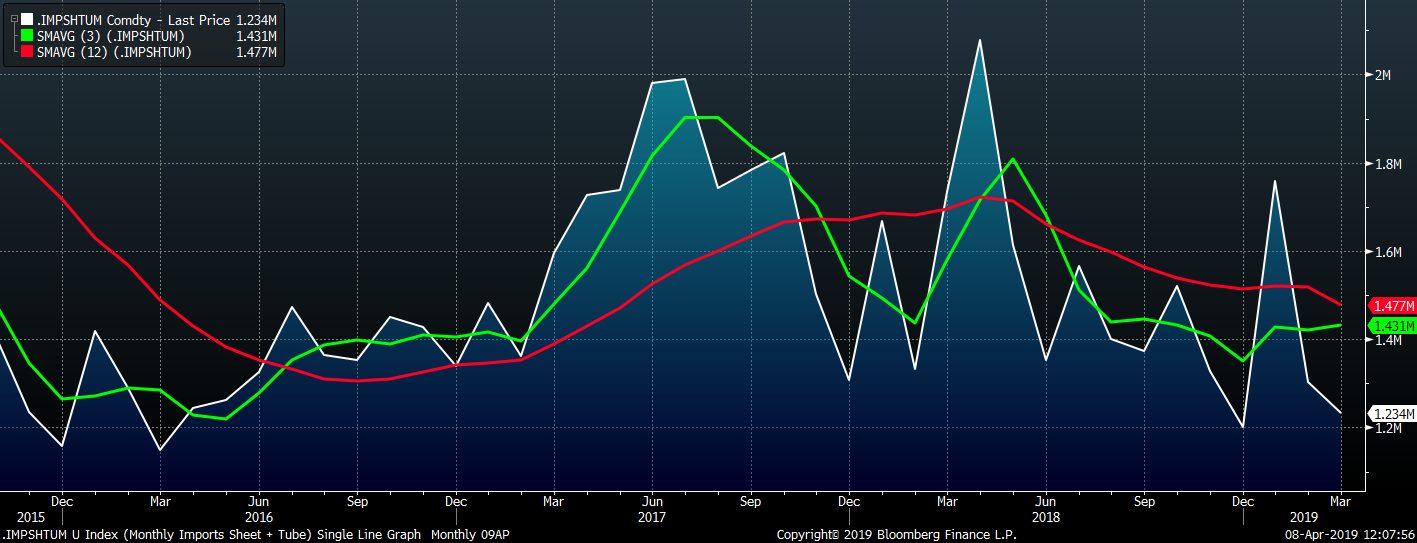
March tube import license data is forecasted to decrease 65k to 515k tons MoM after another steep drop in February.
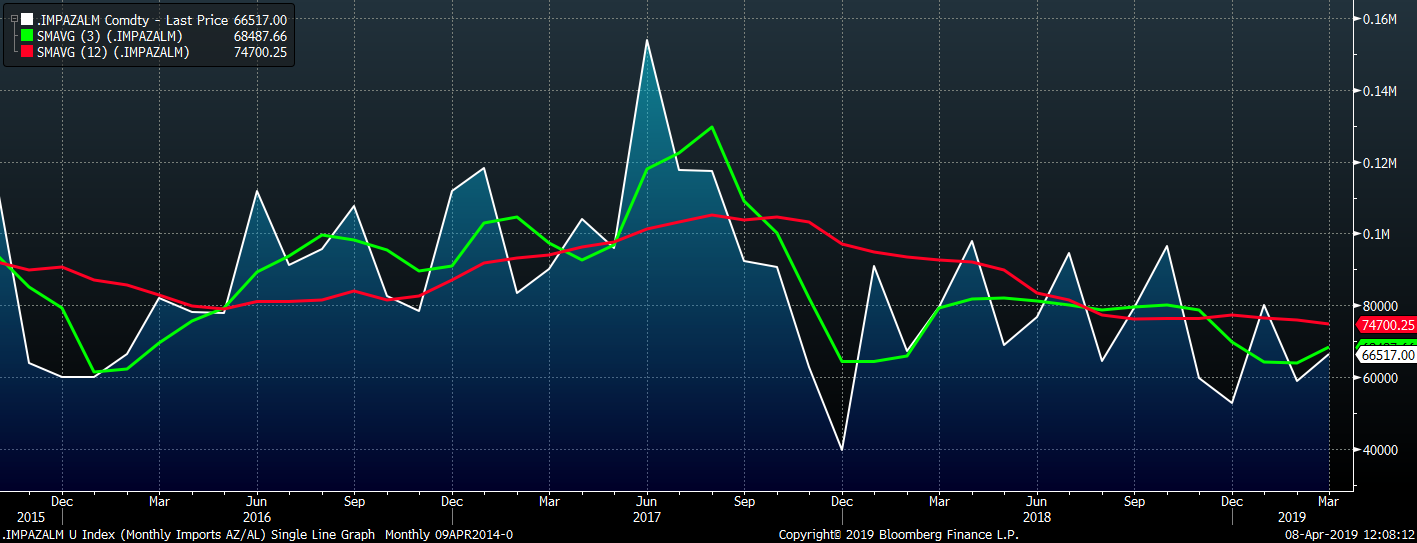
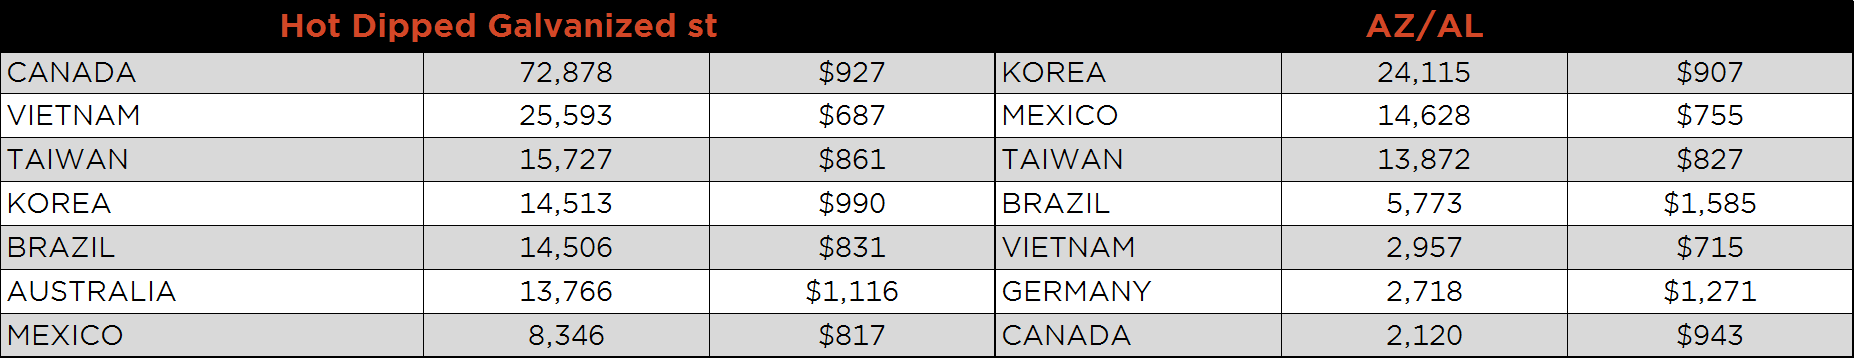
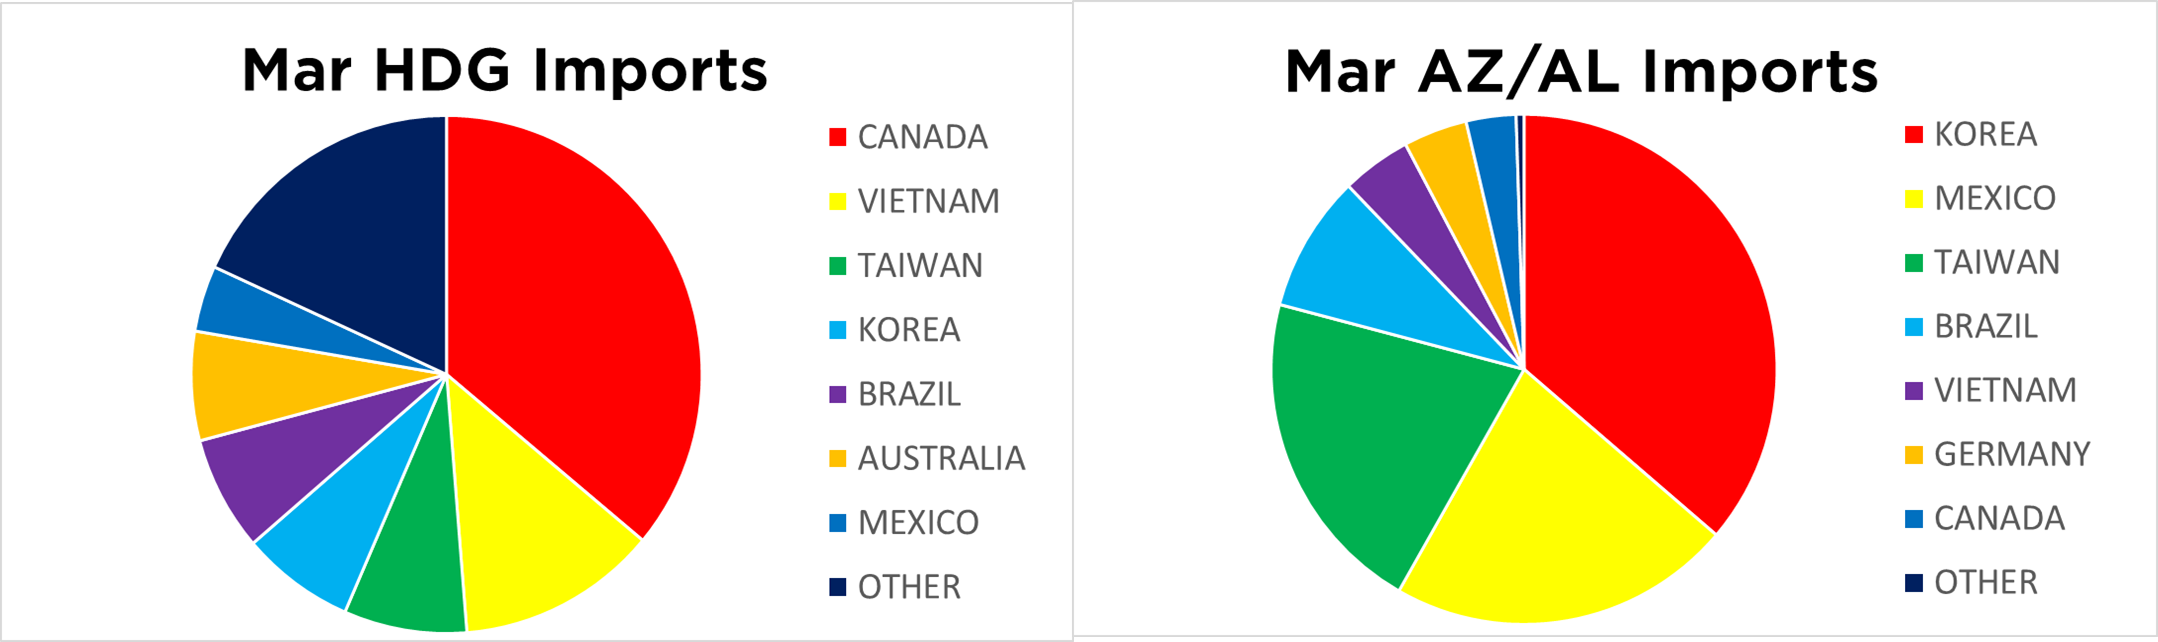
AZ/AL import licenses forecast an increase of 7k to 67k in March.
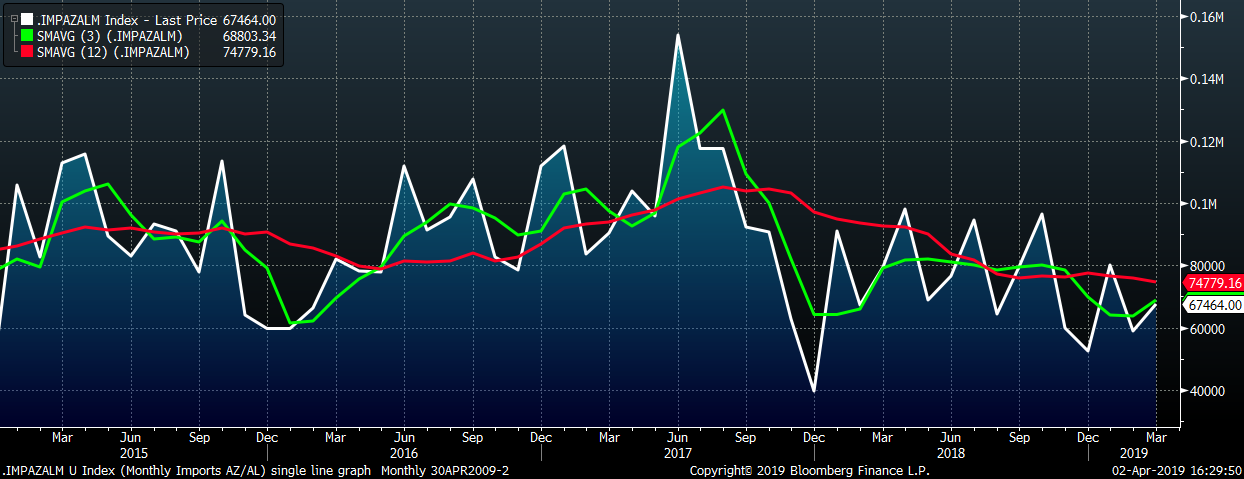
Below is March import license data through April 2, 2019.
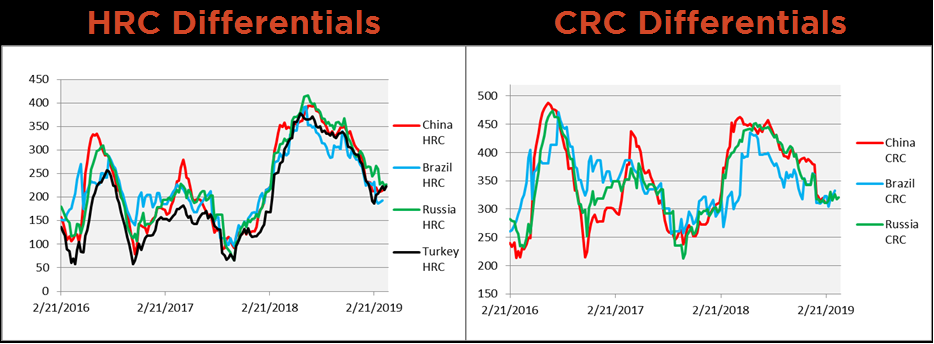
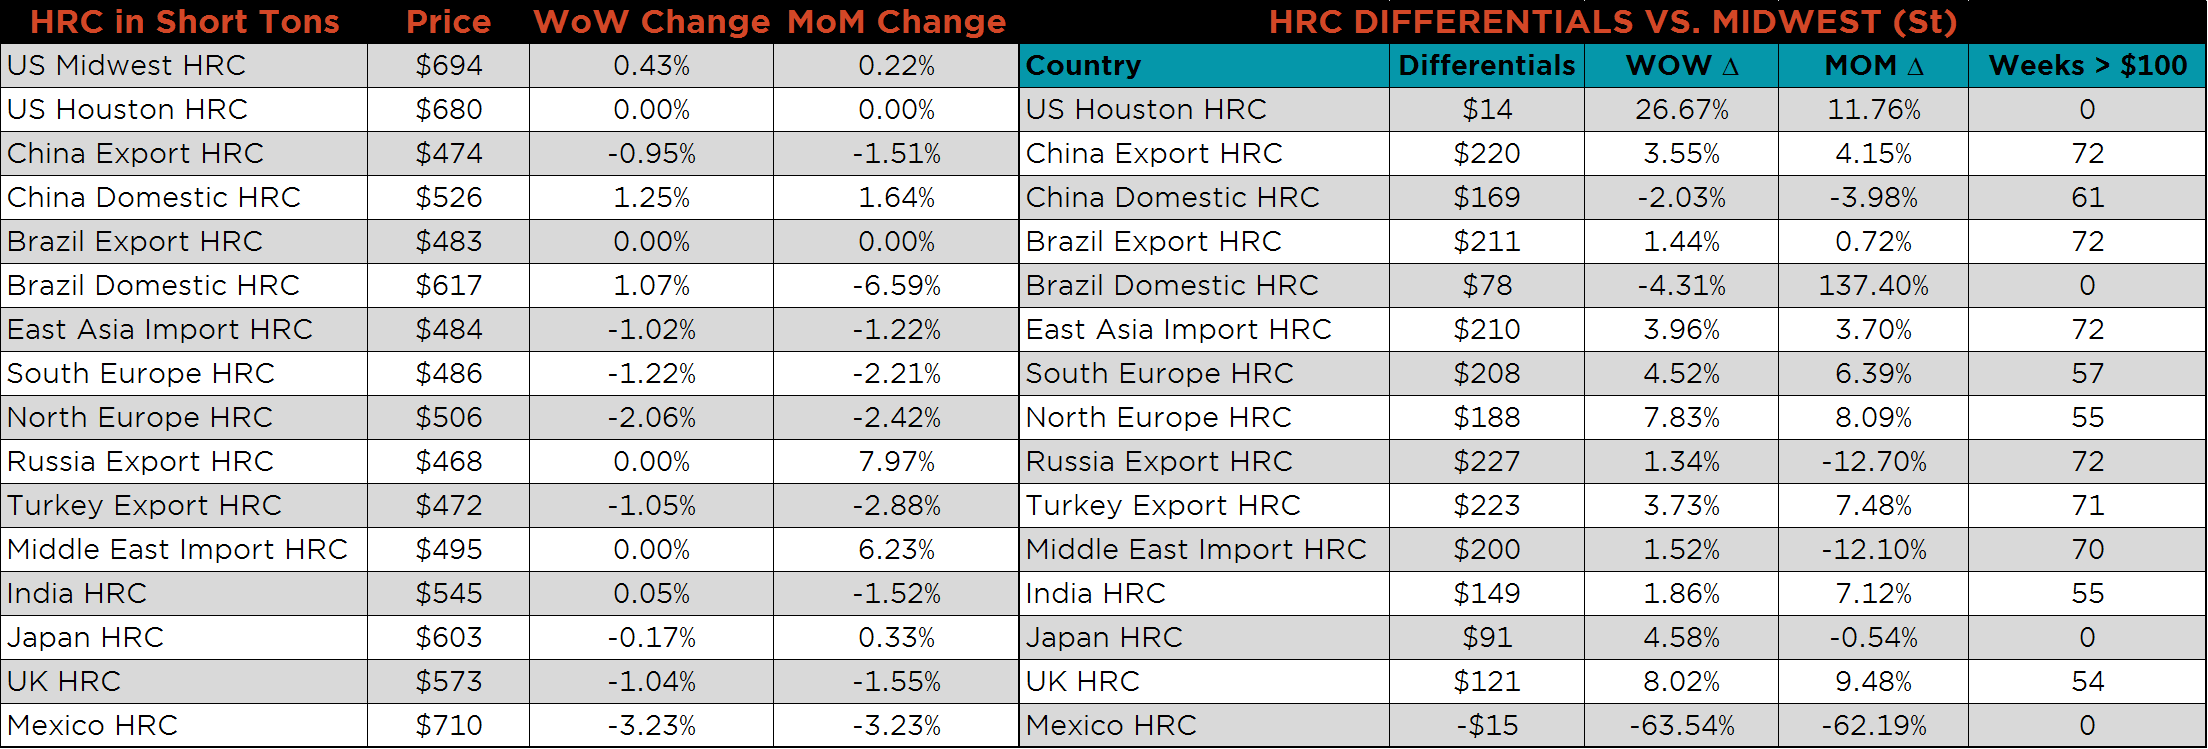
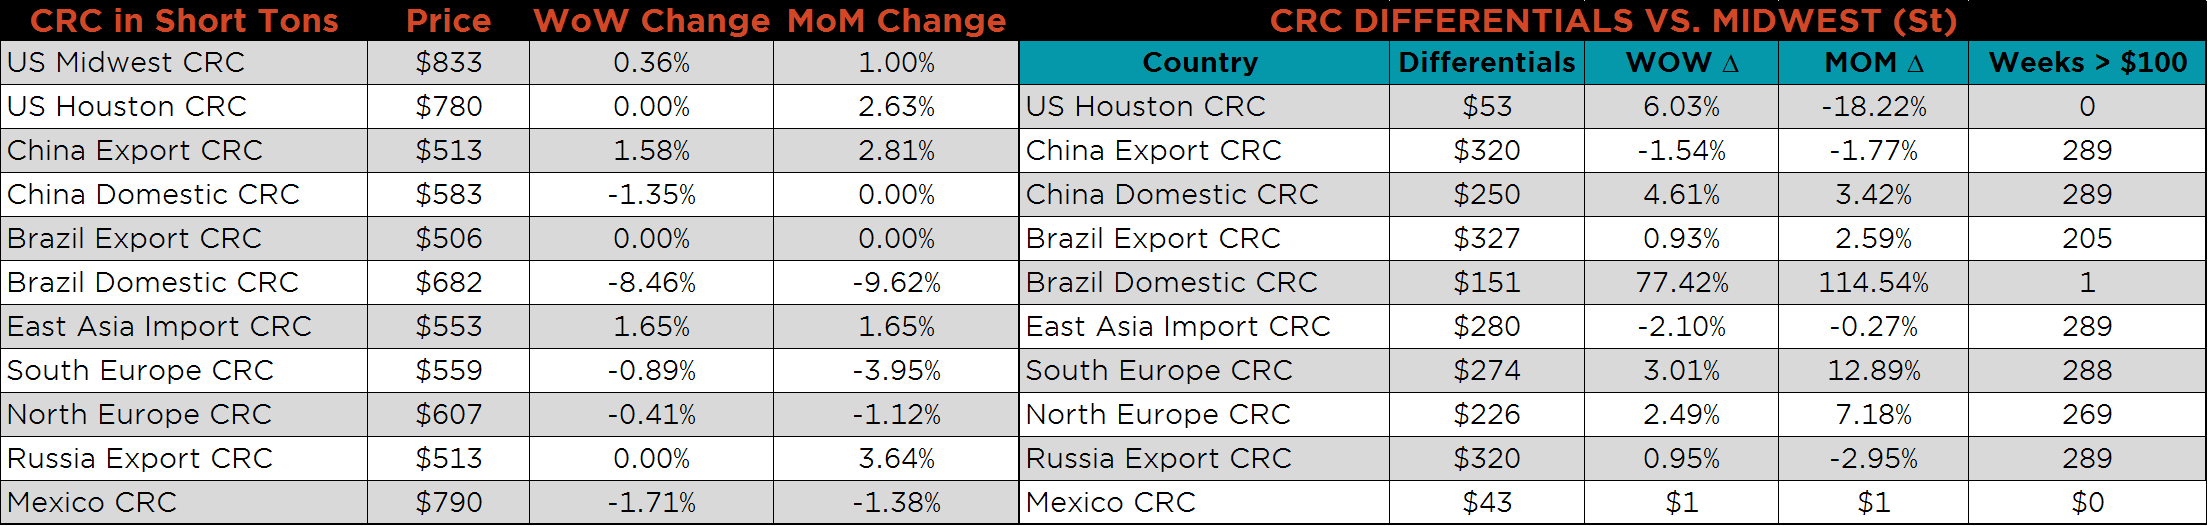
Below are HRC and CRC Midwest vs. each country’s export price differentials using pricing from SBB Platts. The Turkish HRC differential continues to increase while the three CRC differentials showed little change.
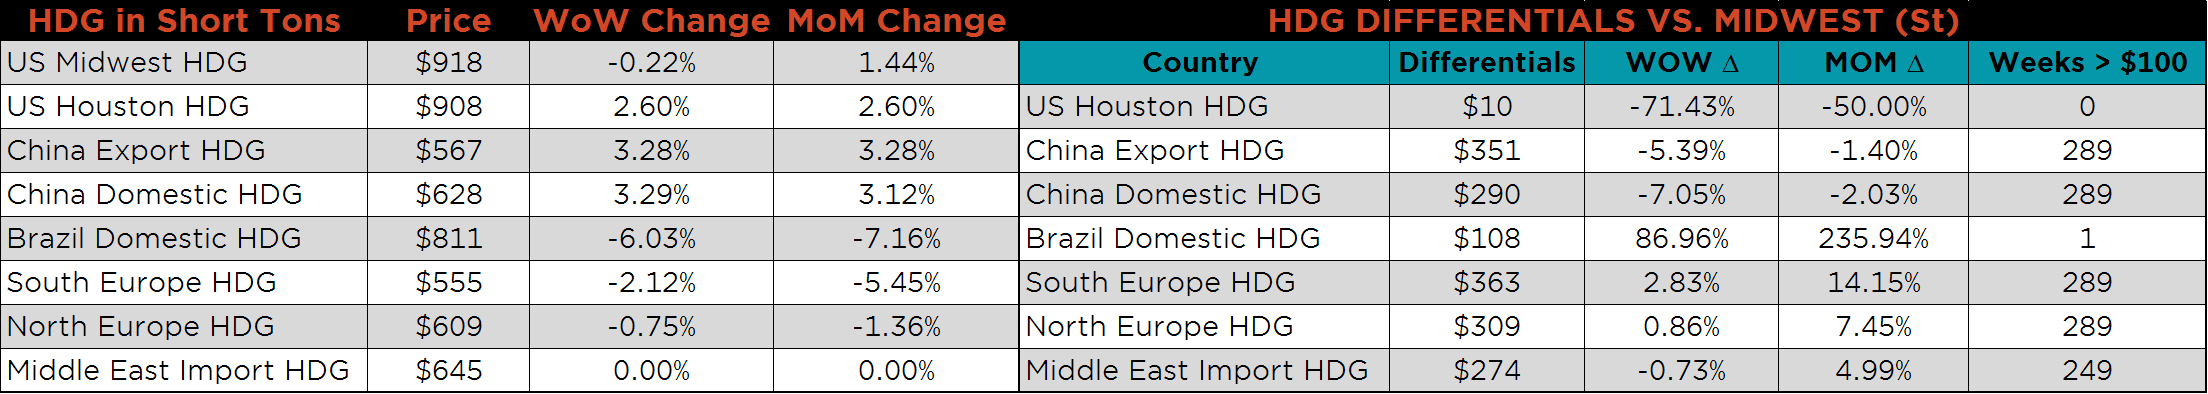
SBB Platt’s HRC, CRC and HDG WoW pricing is below. Midwest HRC and CRC prices are slightly higher, while HDG prices were slightly lower. Brazilian Domestic CRC and HDG prices decreased dramatically, down 8.5% and 6%, respectively.
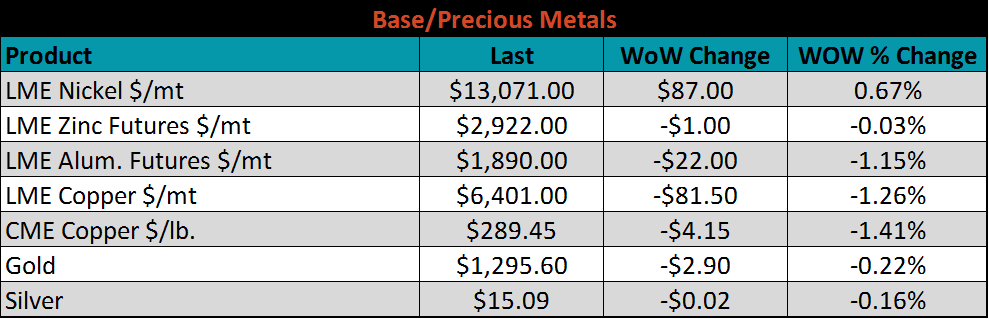
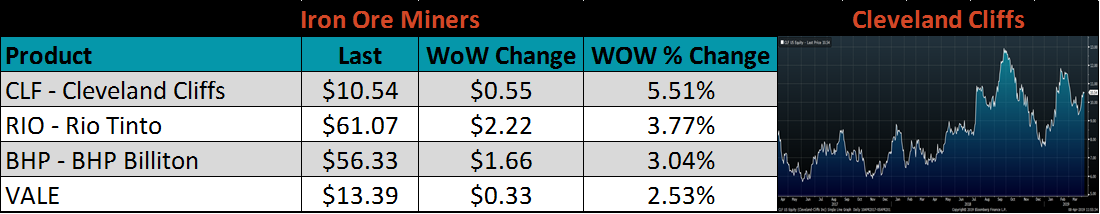
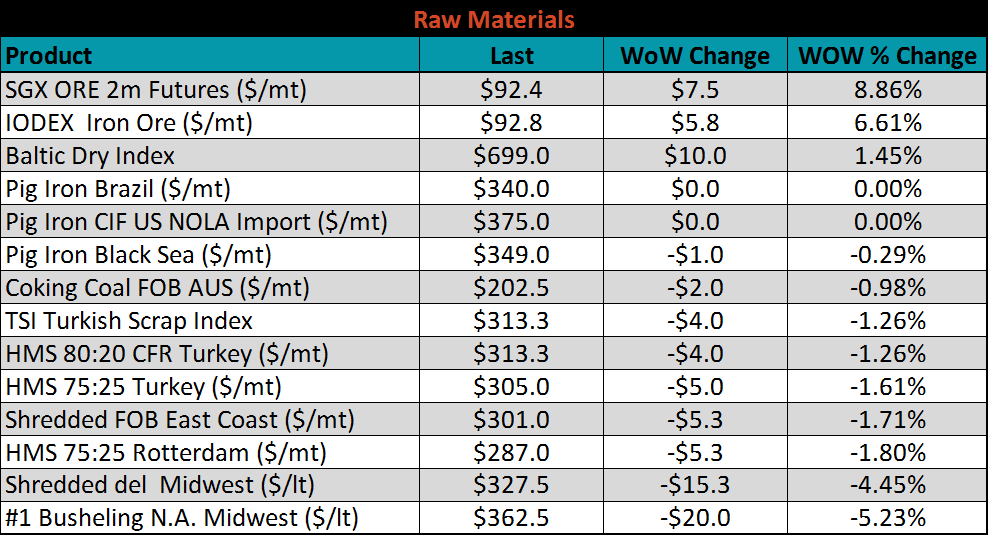
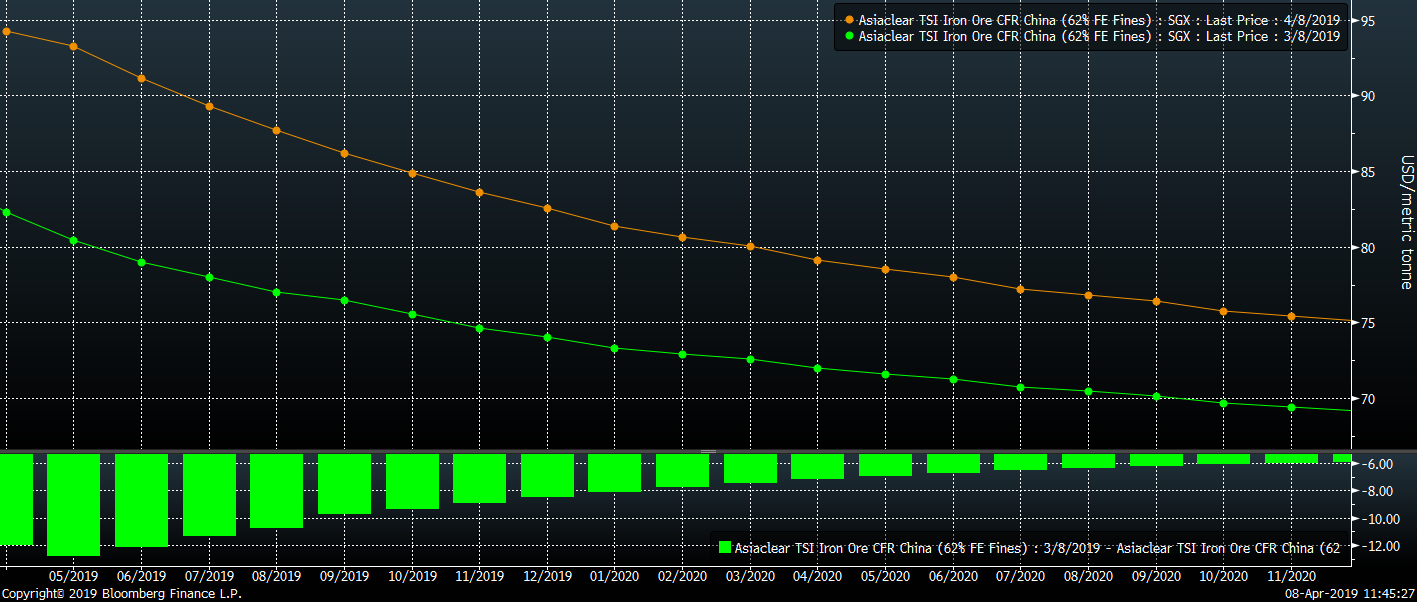
Raw material prices were mostly lower. The exception was iron ore prices, with the May future gaining 8.9% and the IODEX up 6.6%. This comes off the news of reduced production after a tropical storm moved through Western Australian. The future curve continues to push higher. Higher iron ore prices will lead to higher global steel prices if global demand conditions improve. The recovery in global PMIs is may indicate that producers will be able to pass this higher cost on to finished products.
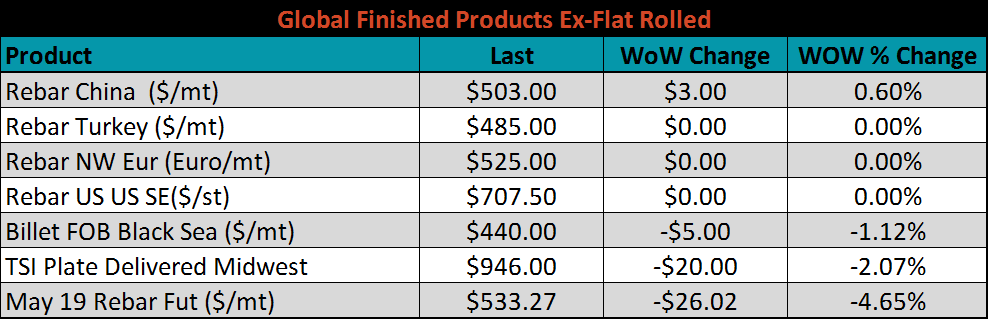
Ex-flat rolled prices are below.

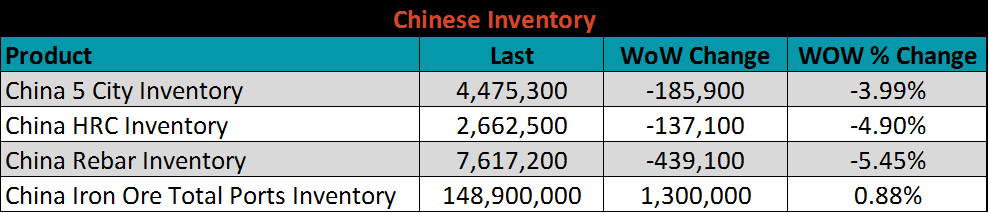
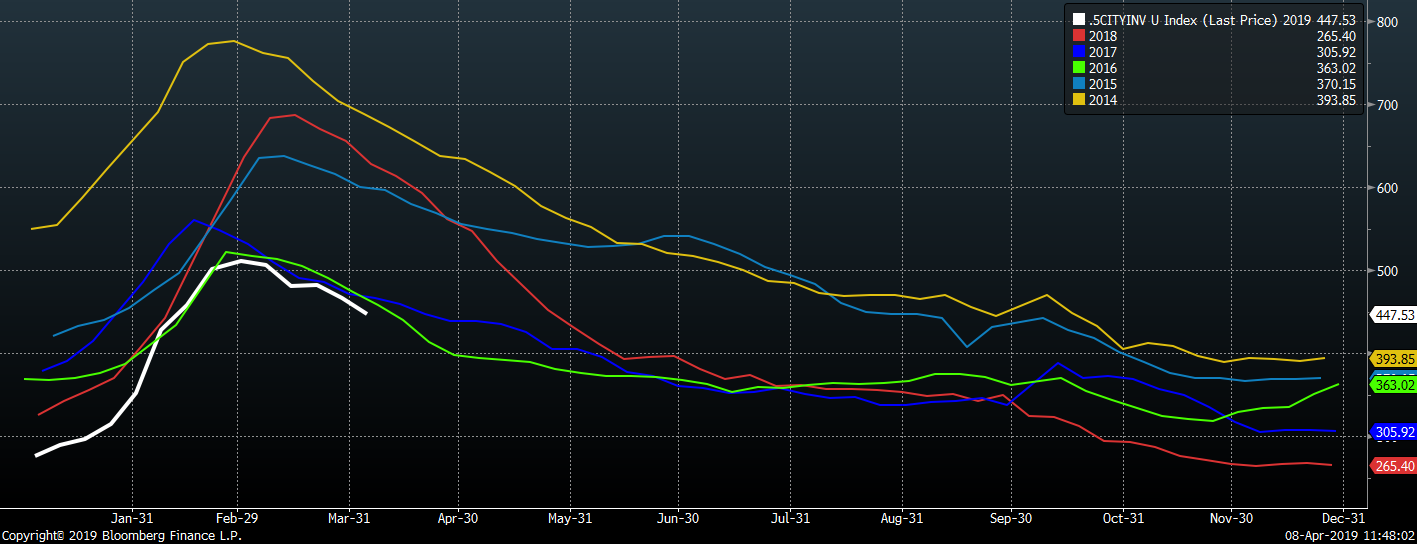
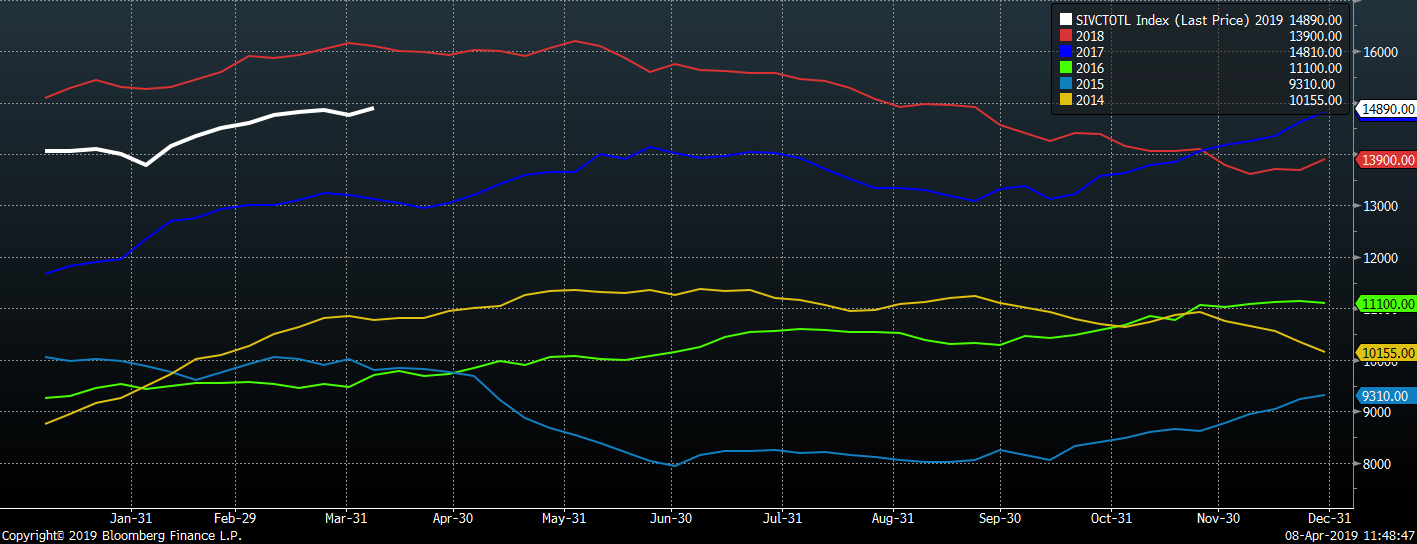
Below are inventory levels for Chinese finished steel products and iron ore. Inventory levels continue to move lower for Rebar and HRC while the Five City Inventory level is the lowest level in the last 6 years on record. With continued global demand growth, these low inventory levels are supportive for higher global steel prices.
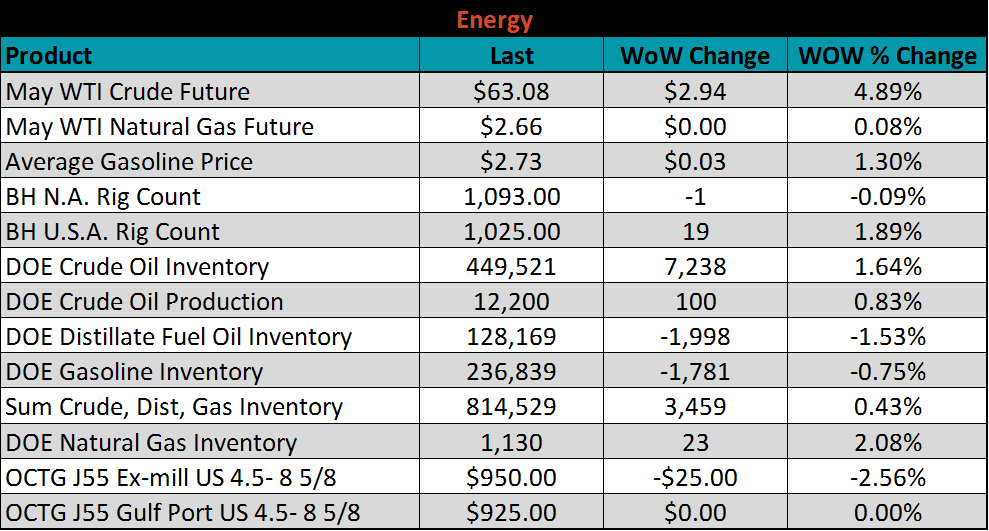
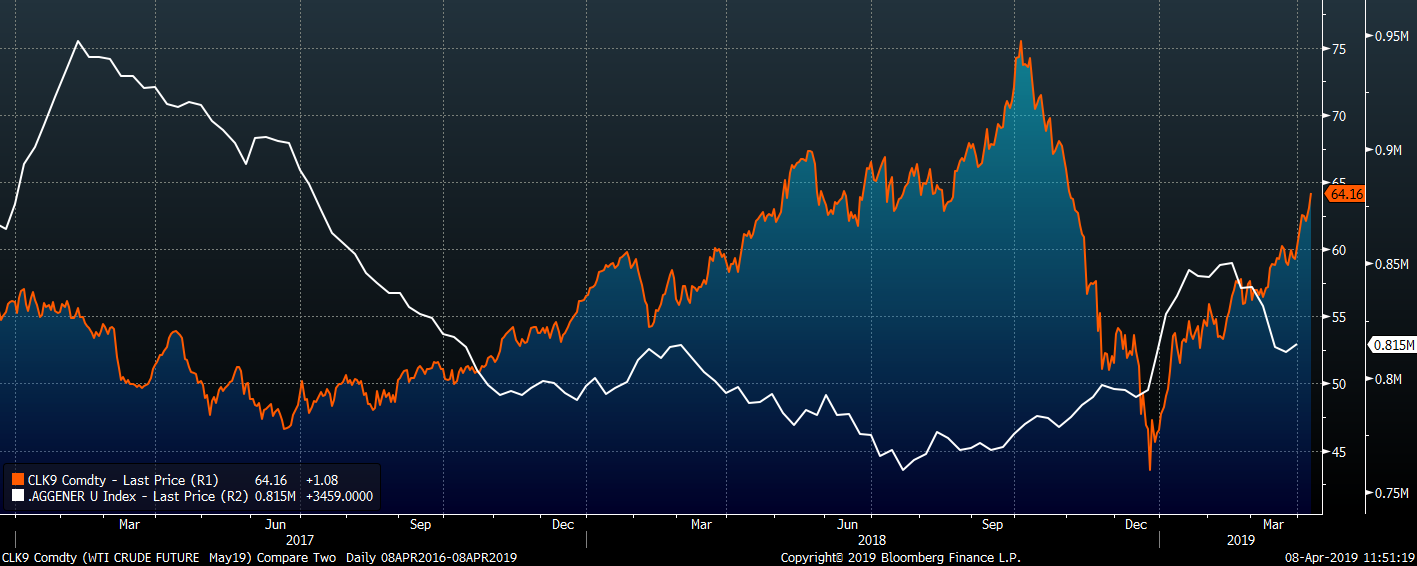
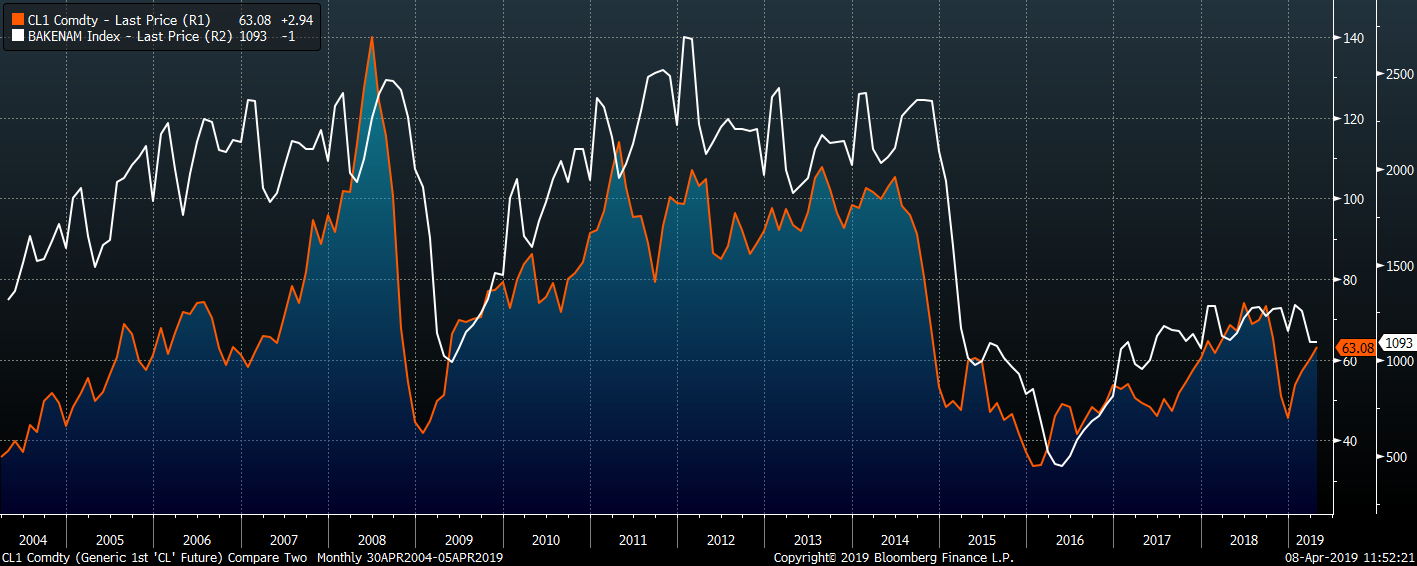
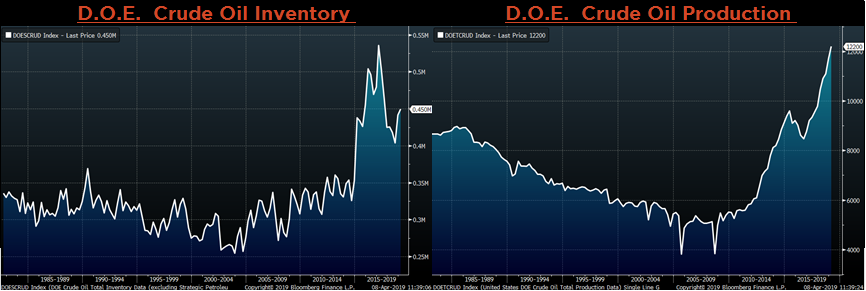
Last week, the May WTI crude oil future gained $2.94 or 4.9% to $63.08/bbl. The aggregate inventory level was slightly up 0.4%. Crude oil production level rose to the highest on record at 12.2m bbl/day. The U.S. rig count gained nineteen rigs while the North American rig count lost one rigs. Oil prices continuing to move higher will incentivize oil producers to increase rig counts, which is supportive for steel prices.
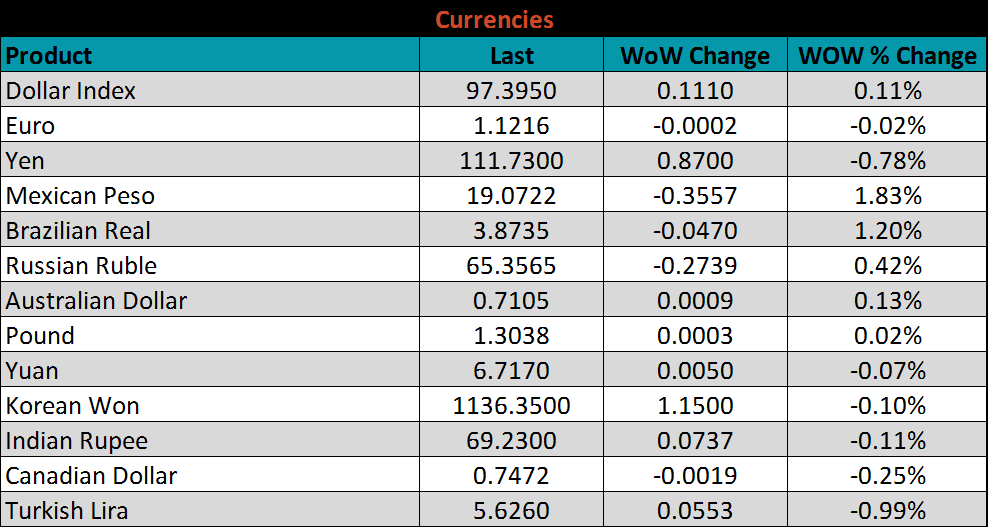
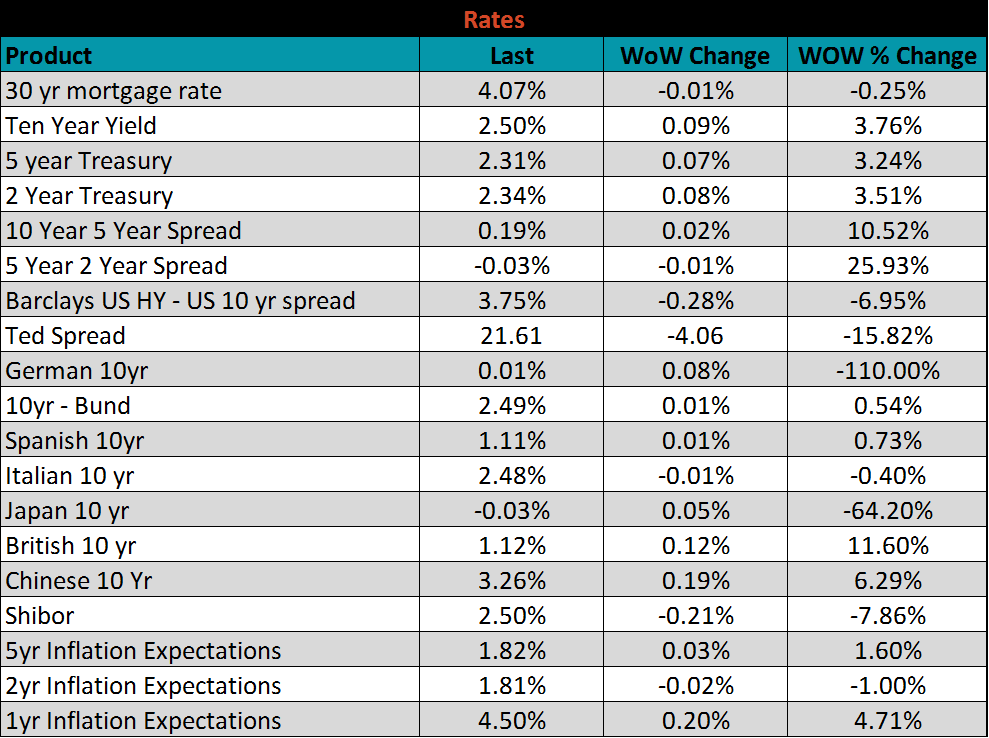
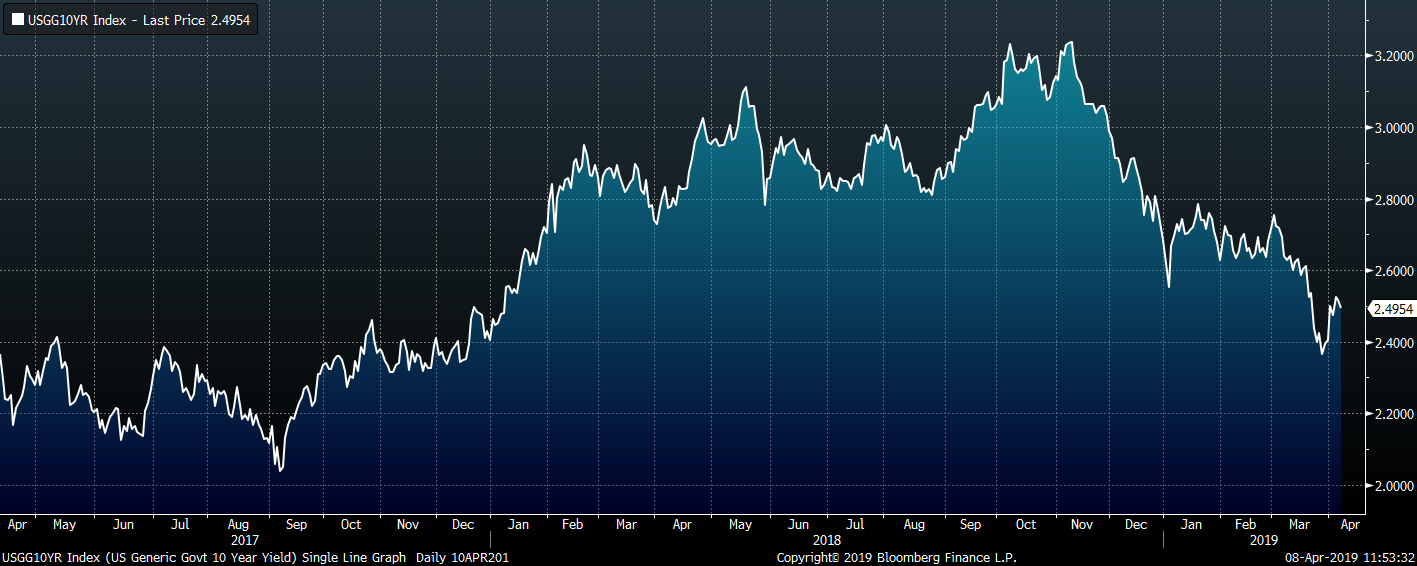
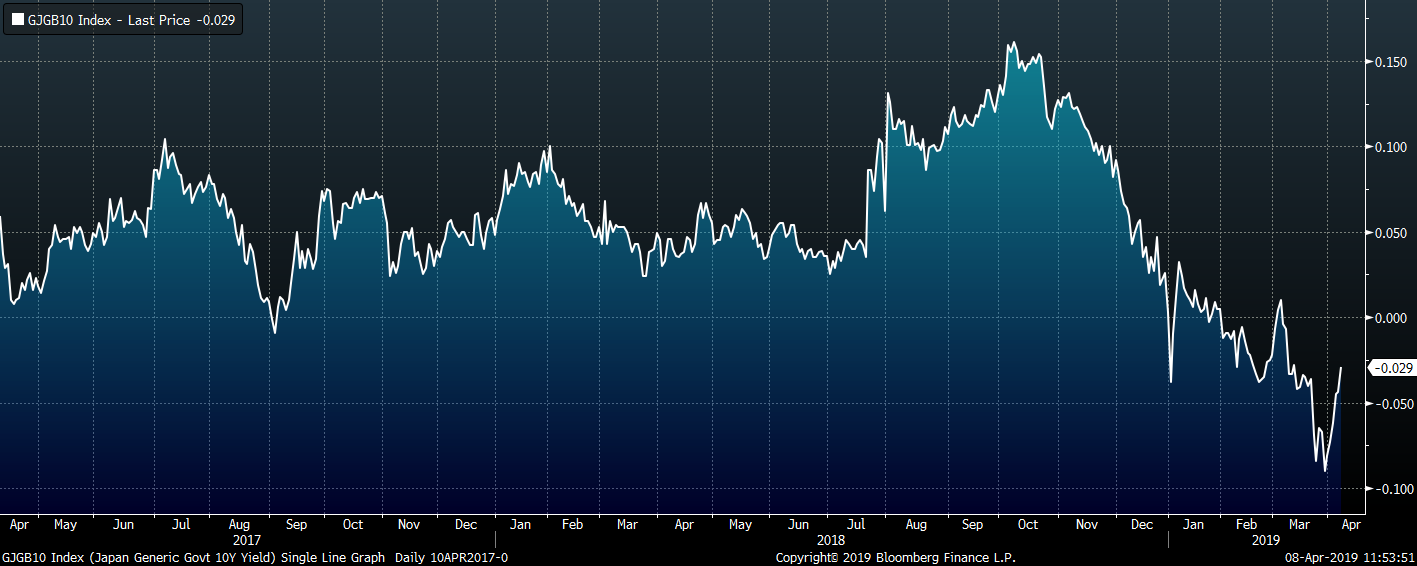
The U.S. 10-year treasury yield was up nine basis points closing the week at 2.5%. The German 10-year yield was up eight basis points and is now back above zero at 0.01%. The Japanese 10-year yield also showed signs of improvement, up five basis points to -0.03%. While rates moved higher over the last week, they remain at historically low levels. The Federal Reserve continues to maintain its pledge to remain “patient” regarding further rate increases, which will stimulate the economy and steel prices.
The list below details some upside and downside risks relevant to the steel industry. The orange ones are occurring or look to be highly likely. The upside risks look to be in control.
Upside Risks:
Downside Risks: