Content
-
Weekly Highlights
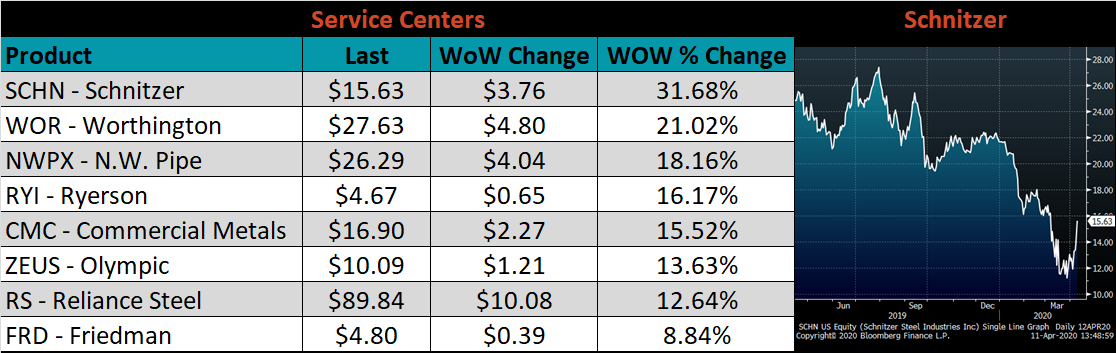
- Market Commentary
- Durable Goods
- Risks


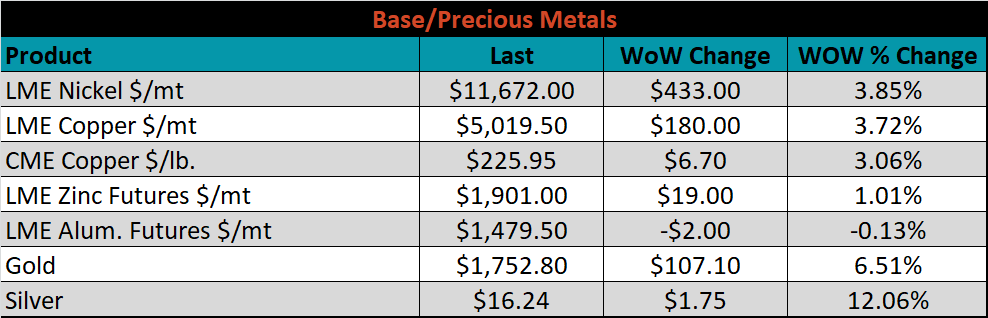
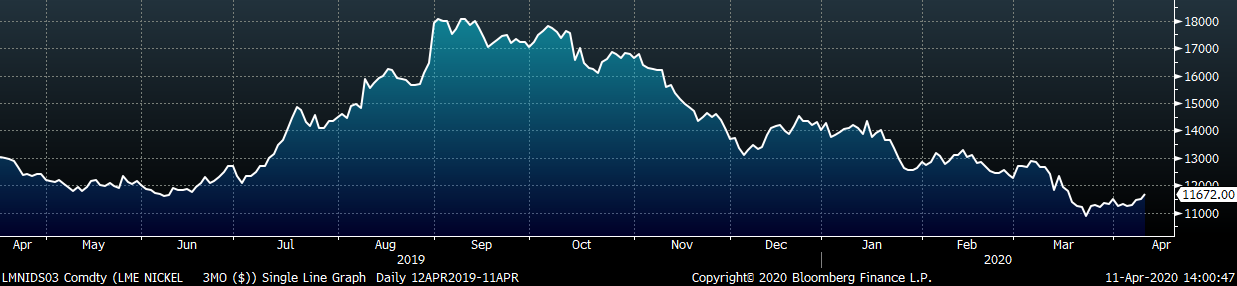
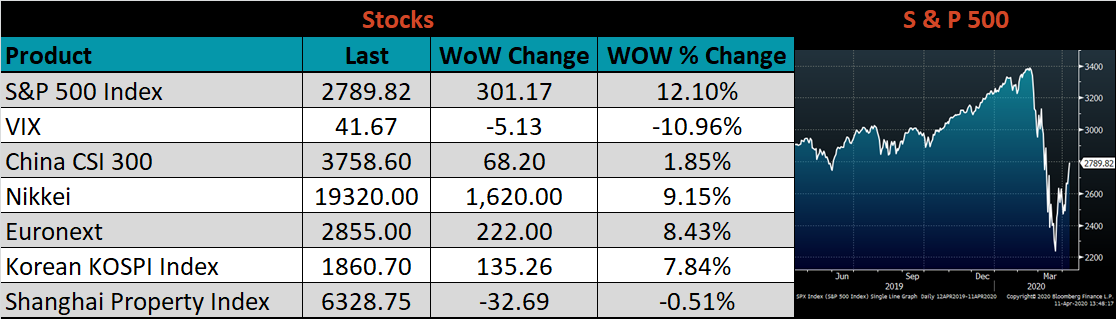
For the first time in several weeks, we saw encouraging numbers concerning the coronavirus pandemic that has halted activity across the globe. The number of new daily cases has started declining, signaling that social distancing and economic shutdowns have helped to “flatten the curve”. This may mean that the economy is closer to resuming some form of normalized activity, and risk assets reflected this promising sentiment. The S&P 500 was up 12% last week, and several industrial commodities rose as well: nickel was up 4%, copper up 3%, iron ore up 4%, and Turkish scrap up 3%. Even HRC futures rallied 2-3% in the summer months.
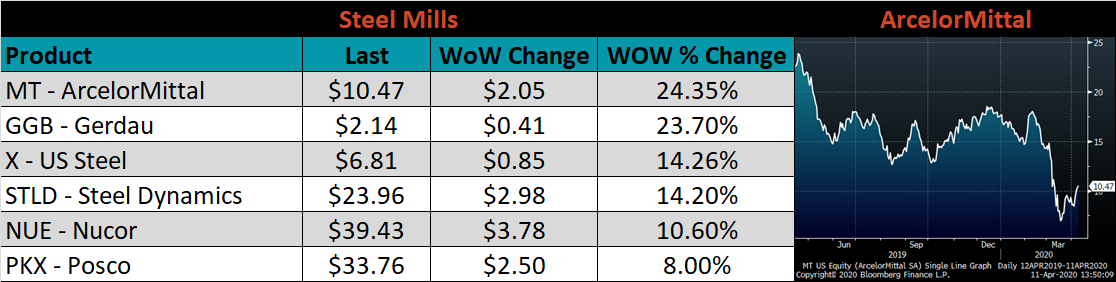
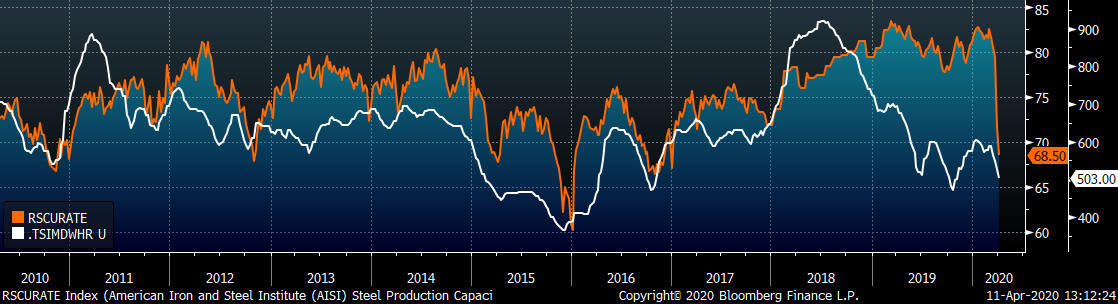
However, for the steel market, that was the extent of the good news. Spot prices continue to decline, and some transaction are occurring below $500/st for HRC. Now that contract pricing is locked in with the second week of the month index pricing, mills have shifted to filling order books rather than holding higher prices. However, they have struggled to do so at the current spot prices, and have chosen to remove production rather than drive the price lower. Over the last month, US Steel has announced it is idling four furnaces, removing a total of approximately 4.3 million carbon sheet tons annually. ArcelorMittal has also idled two furnaces, removing 2.6 million tons annually. The below chart shows the decline in raw steel production (all steel products), reaching the lowest levels since 2009.
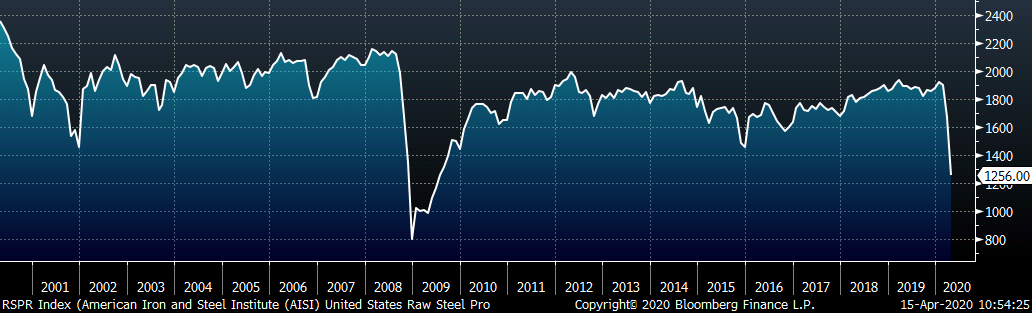
This rapid drop in production is a combination of mills idling furnaces and operating their remaining capacity at reduced rates. Through the size and changes of their order books, mills have the unique ability to gauge demand within the market, and the reductions in production reflect a weak demand picture. Moreover, it reveals the expectation that mill will not be able to prevent prices from falling below their cost to produce. Although scrap prices declined in April, scrap and iron ore prices have held up better than finished good prices, pressuring profitability. Additionally, as mills reduce output, their fixed costs to operate are spread over fewer tons, increasing their cost per ton. Our modeling shows profitability declining, most significantly for BOFs who are breaking even on the marginal ton produced at current prices. This is not promising for future production as the forward curve expects spot prices to fall further. If the spot price continues to decline, further reductions in production are possible.
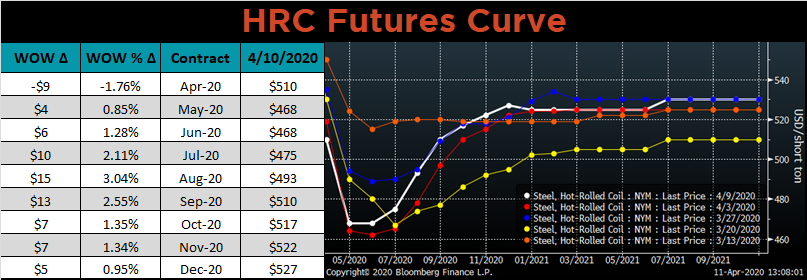
From an economic perspective, mills reducing production aligns with the domestic market’s need to reduce current supply to match the lower demand level. However, eventually demand will recover and the market will be short physical steel, as production remains low. Mills will not try to get ahead of this through adding production capacity to match increasing demand. Instead, they will increase prices first in order to ensure that they can profitably produce material before increasing the supply in the market. This will create a short squeeze in the market for a period where buyers fight for limited tons amid increasing prices. This type of environment tends to rapidly push prices higher, often to unreasonable levels. However, those with a need for physical material can protect against this through securing low prices on the forward curve. We have already seen some buyers prudently remove this risk from their business, and the curve is continuing to grind higher, leaving those low prices on the curve in the past.
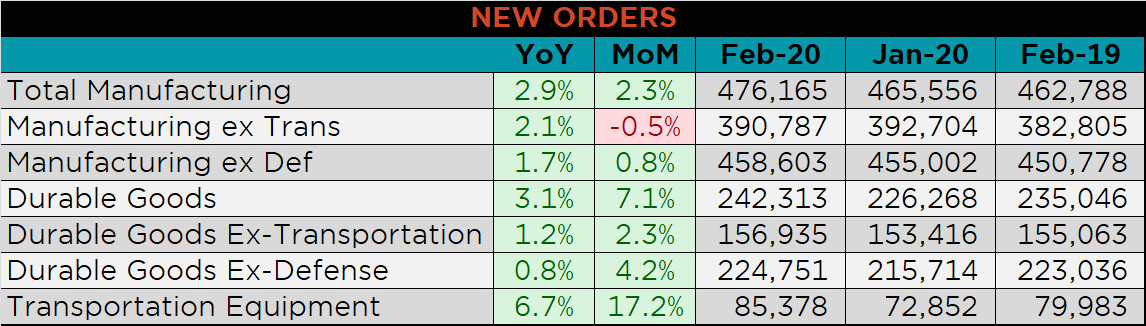
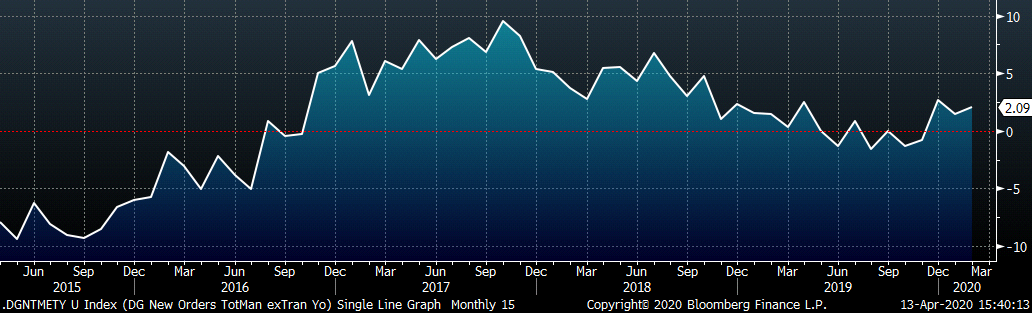
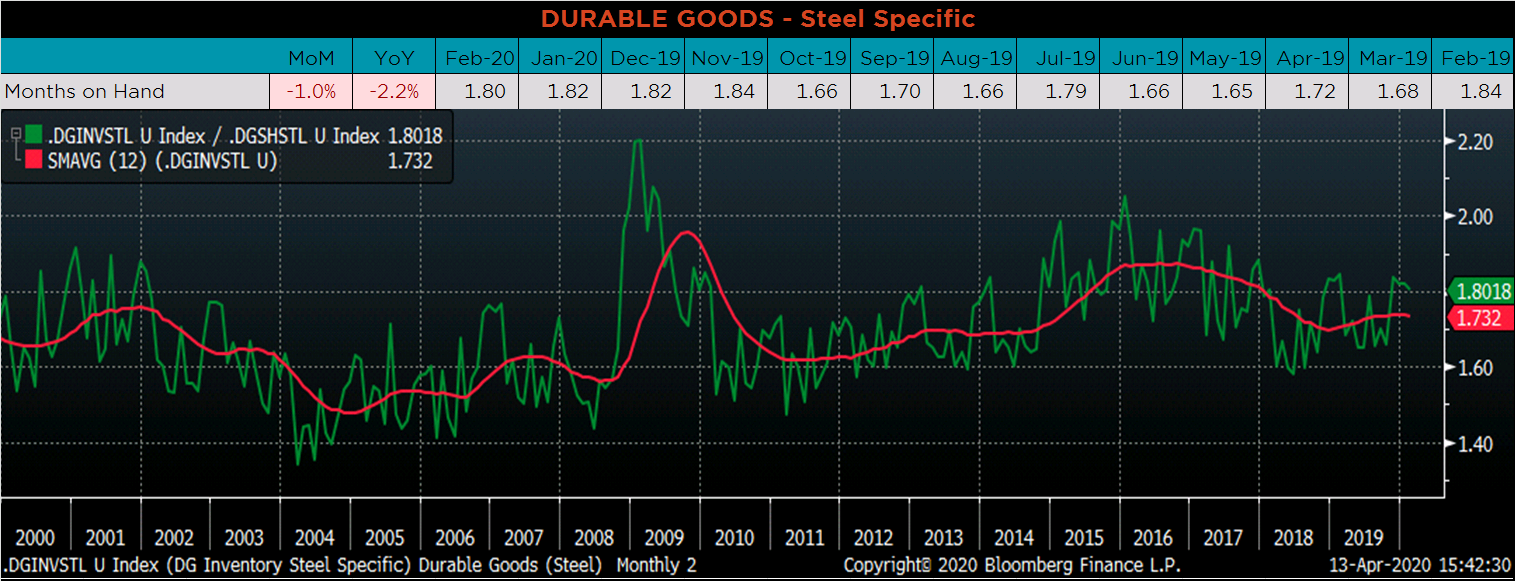
Below are final February new orders from the Durable Goods report. Overall, new orders for Durable Goods were higher MoM, and YoY. Transportation appears to be a main driver of the increase in new orders, as they were up 17.2% compare to last month. The final chart looks at the months on hand (inventory divided by shipments) for durable goods categories that are steel intensive. MOH decreased slightly as monthly shipments increased by more than monthly inventory levels.
Below are the most pertinent upside and downside price risks:
Upside Risks:
Downside Risks:
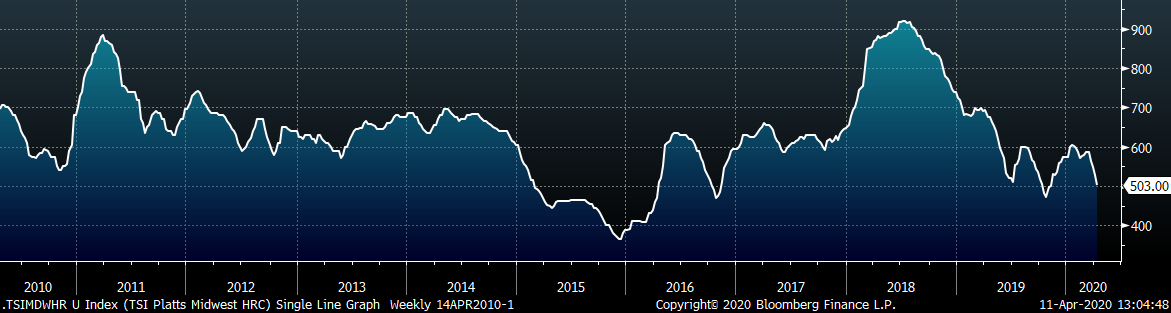
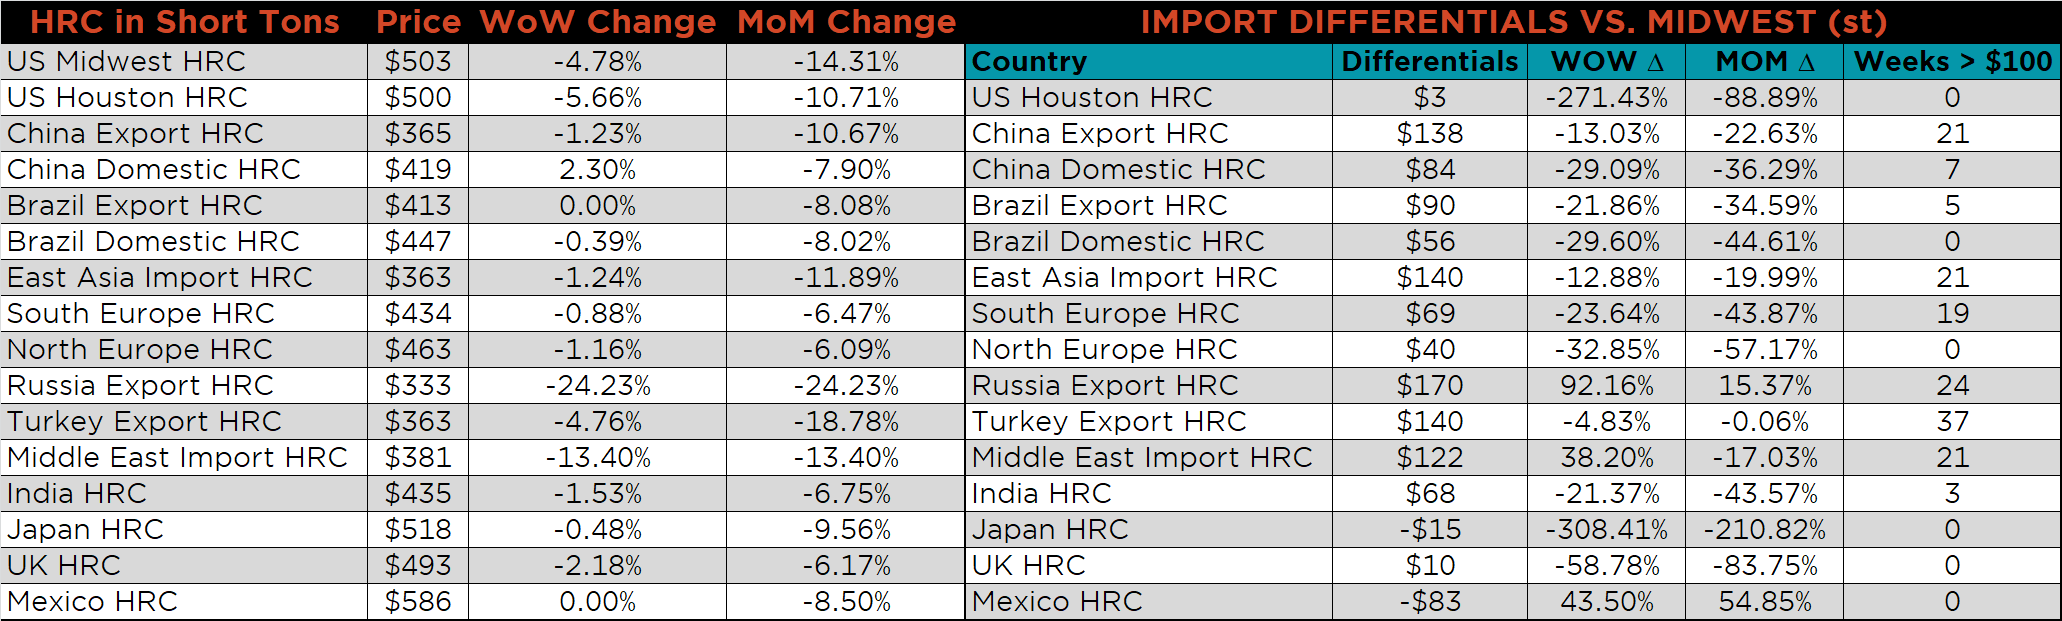
The Platts TSI Daily Midwest HRC Index was down another $23.25 to $503.
May ferrous futures were mostly higher, led by Busheling, up 12.2%.
May ferrous futures were mostly higher, led by Busheling, up 12.2%.
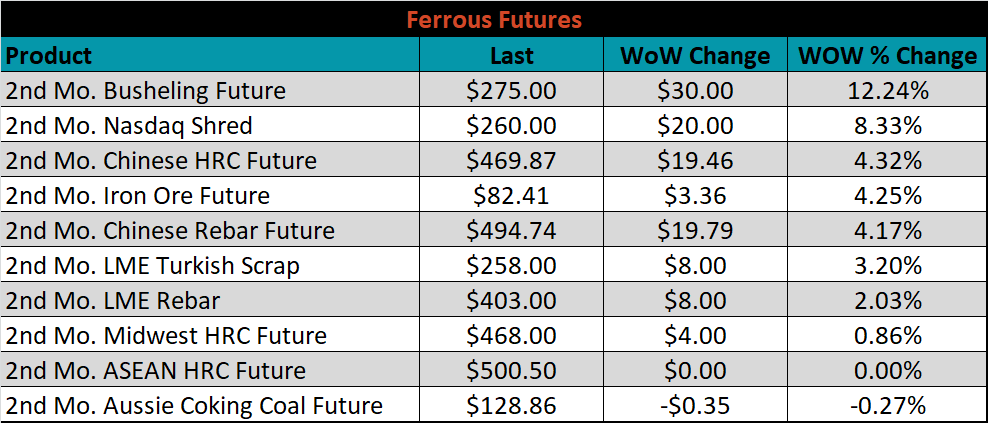
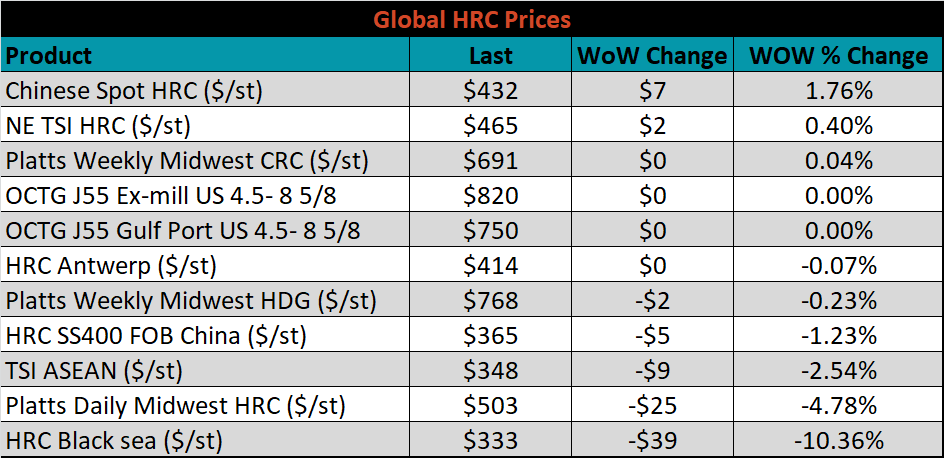
The global flat rolled indexes were mixed. Black Sea HRC was down 10.4%, while Chinese spot HRC was up 1.8%.
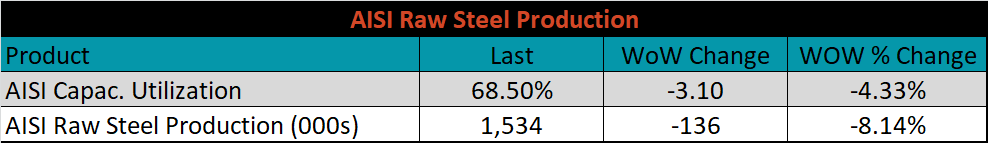
The AISI Capacity Utilization Rate was down another 3.1% to 68.5%.
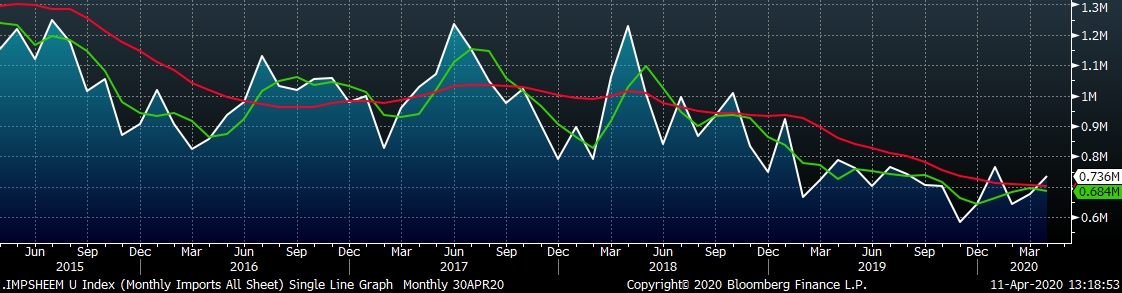
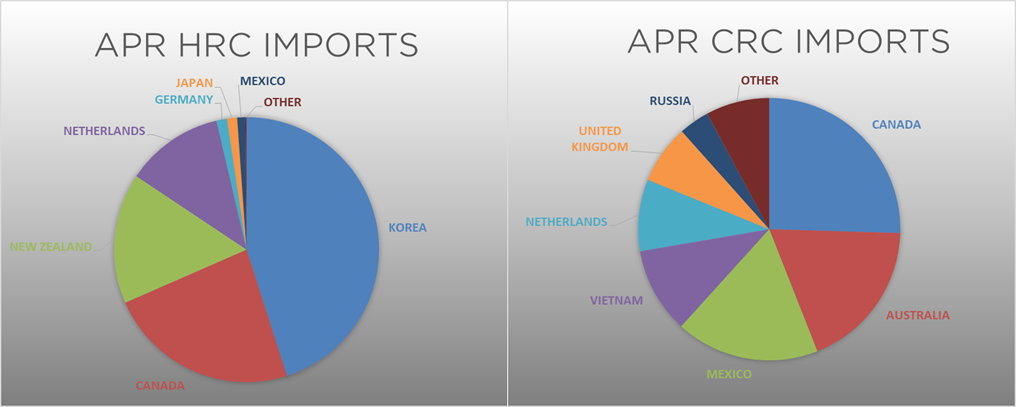
April flat rolled import license data is forecasting an increase of 62k to 736k MoM.
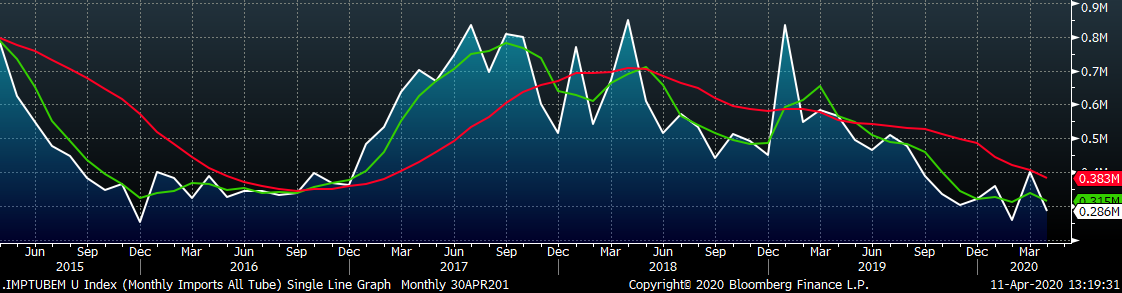
Tube imports license data is forecasting a MoM decrease of 115k to 286k tons in April.
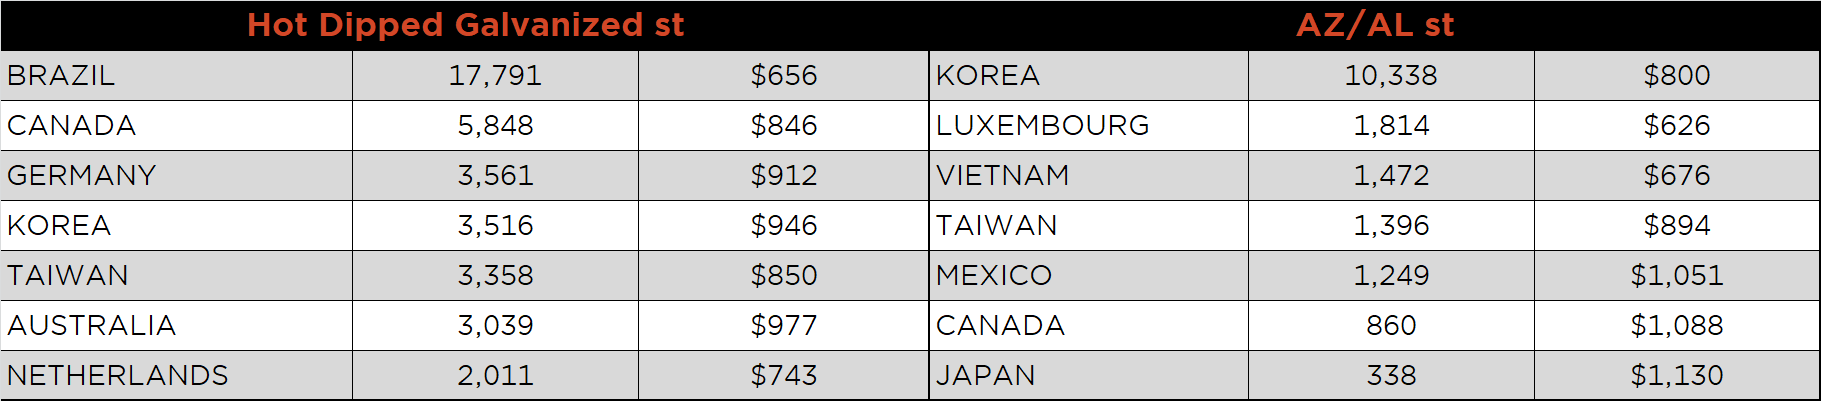
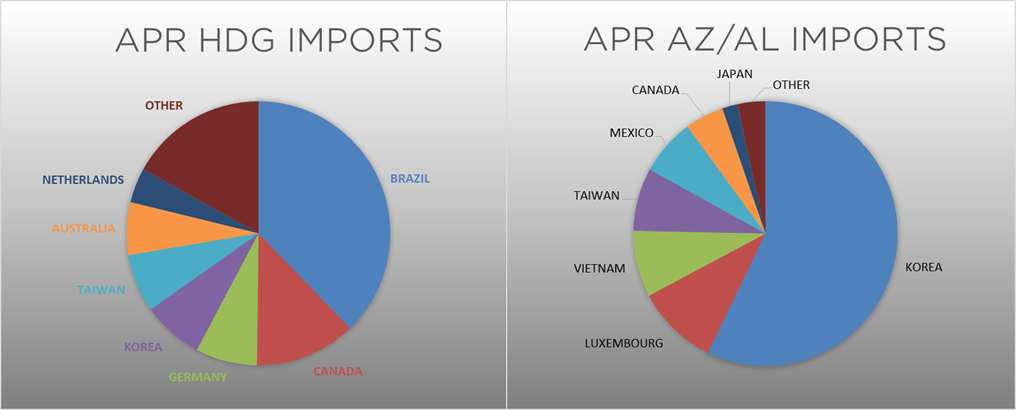
AZ/AL import license data is forecasting an increase of 8k in April to 65k.
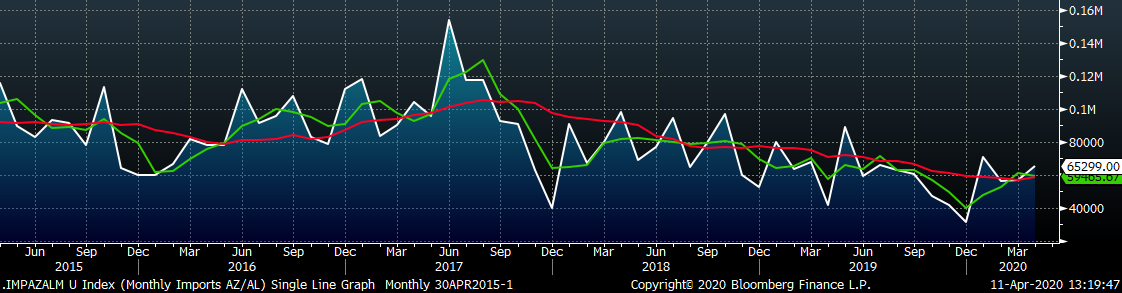
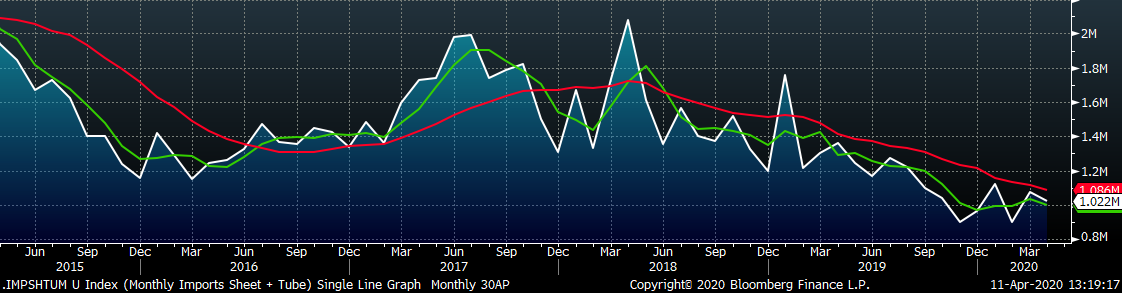
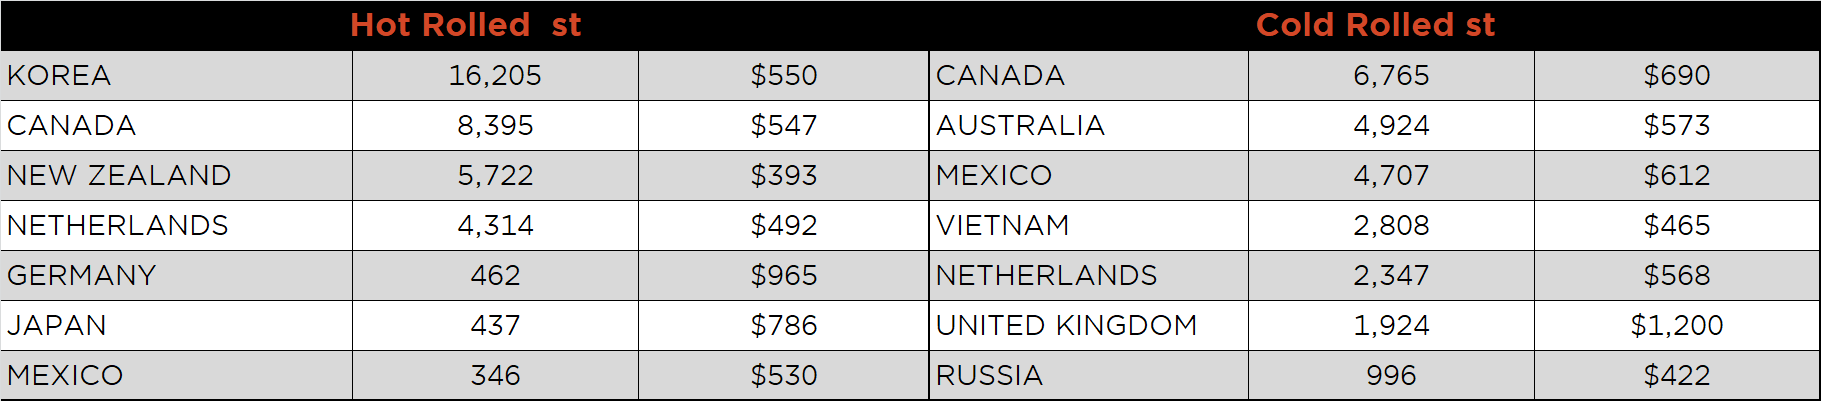
Below is April import license data through April 7, 2020.
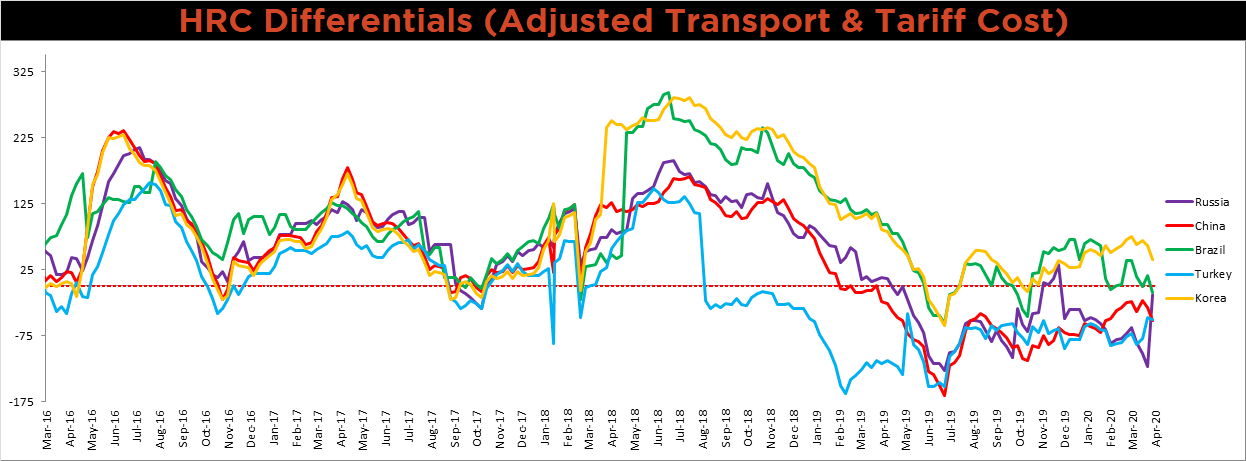
Below is the Midwest HRC price vs. each listed country’s export price using pricing from SBB Platts. We have adjusted each export price to include any tariff or transportation cost to get a comparable delivered price. The Russian HRC differentials increased dramatically, while the Chinese, Brazilian, Turkish and Korean differentials decreased as their prices held up better than the U.S. domestic price.
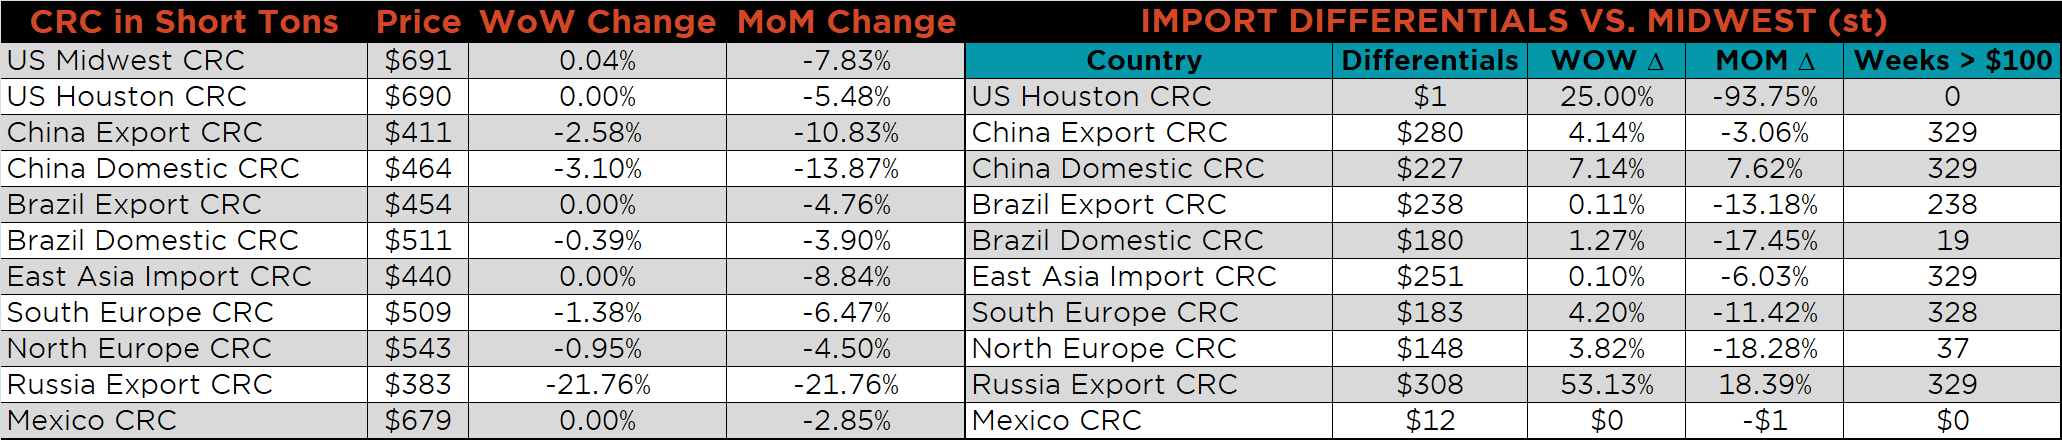
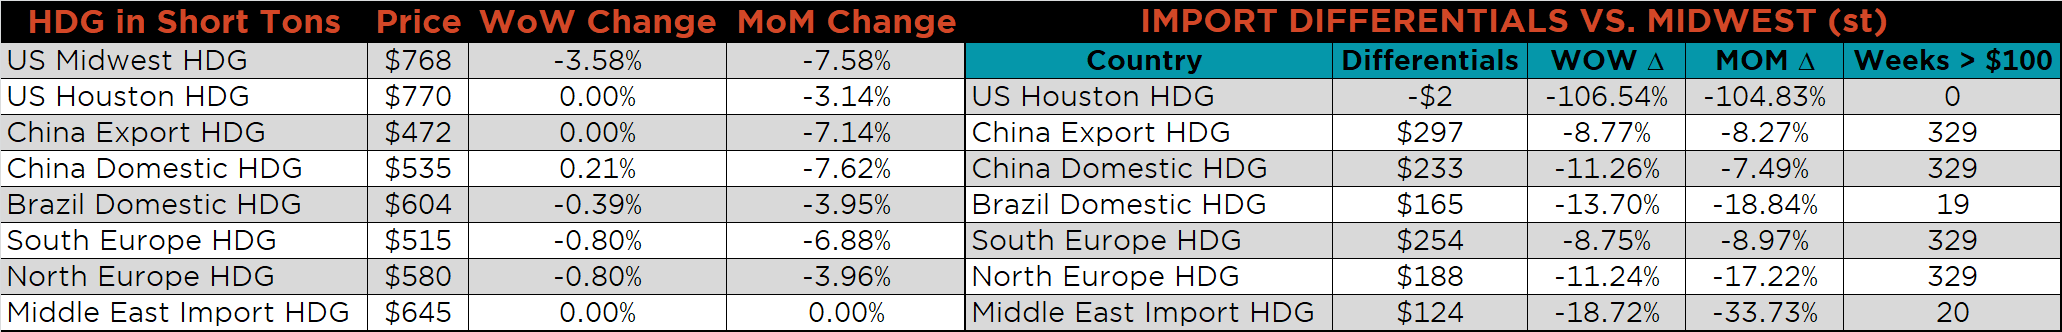
SBB Platt’s HRC, CRC and HDG pricing is below. The Midwest HRC and HDG prices were down 4.8 %, 3.6%, respectively, while the CRC price was flat. Russian HRC and CRC export prices were down 24.2% and 21.8%, respectively.
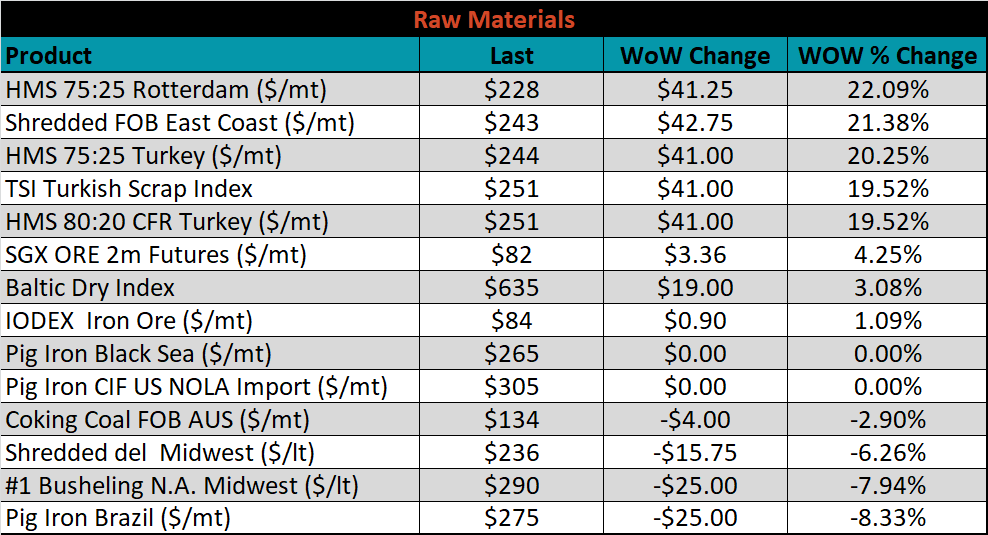
Raw material prices were mixed. Brazilian Pig Iron was down 8.3%, while Rotterdam HMS was up 22.1%.
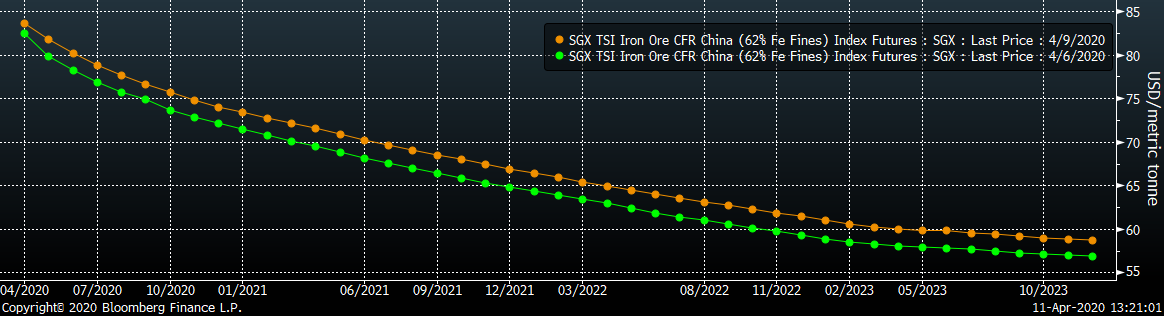
Below is the iron ore future curve with Friday’s settlments in orange, and the prior week’s settlements in green. The entire curve shifted slightly higher.
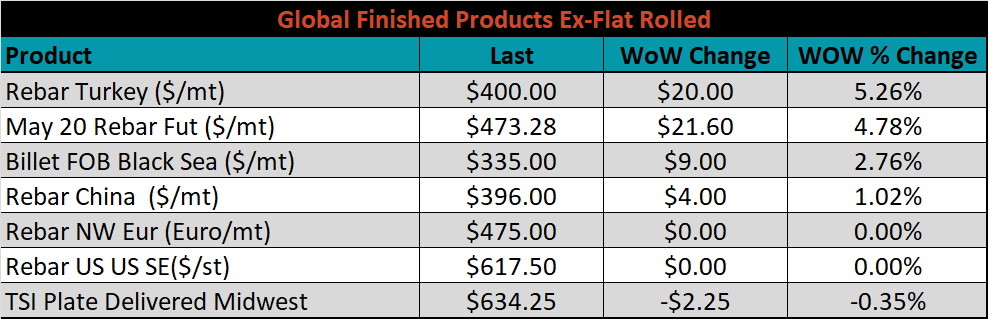
The ex-flat rolled prices are listed below.

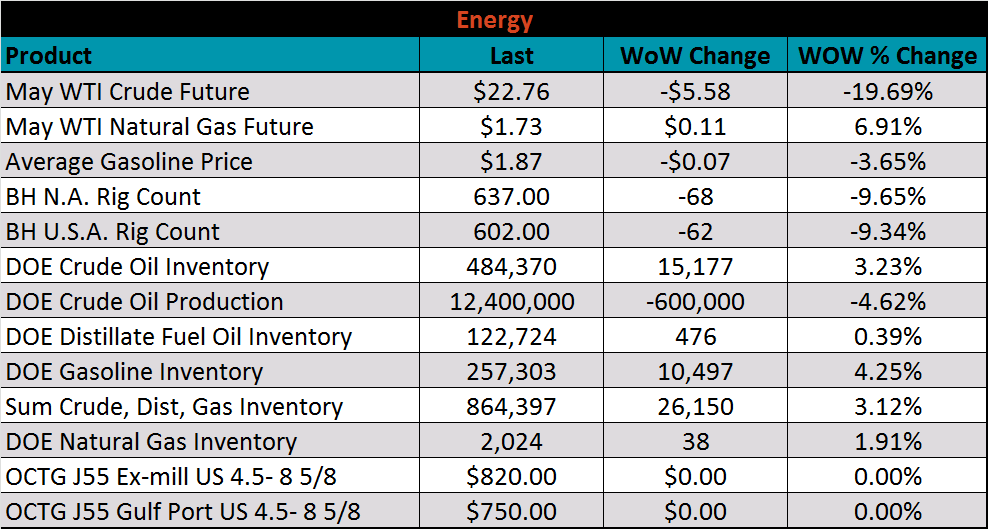
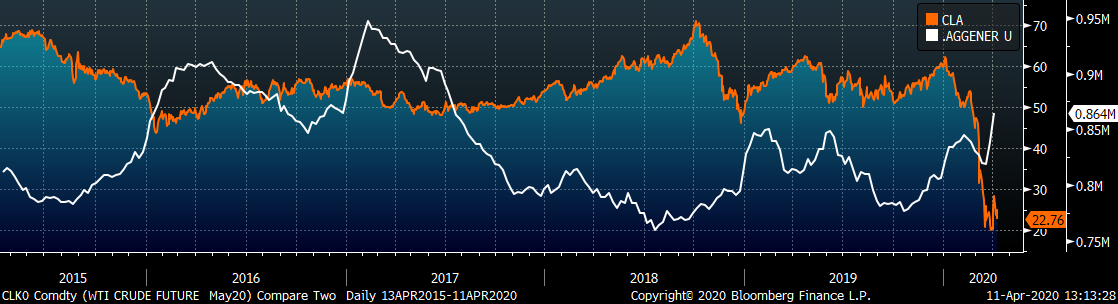
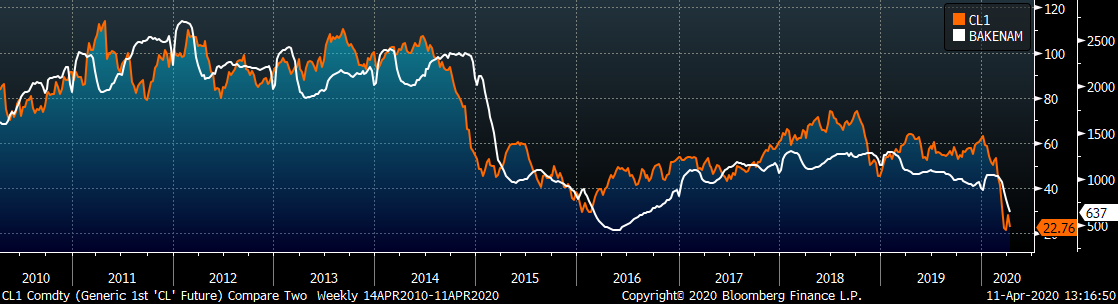
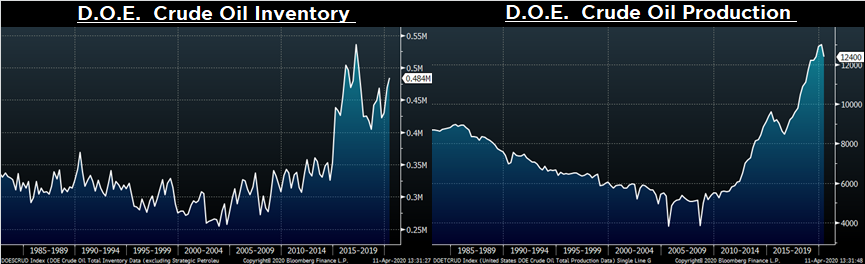
Last week, the May WTI crude oil future lost $5.58 or 19.7% to $22.76/bbl. The aggregate inventory level was down 3.1% and crude oil production was down 4.6% to 12.4m bbl/day. The Baker Hughes North American rig count was down 77 rigs and the U.S. rig count was down 64 rigs.
The list below details some upside and downside risks relevant to the steel industry. The orange ones are occurring or look to be highly likely. The upside risks look to be in control.
Upside Risks:
Downside Risks: