Content
-
Weekly Highlights
- Market Commentary
- Durable Goods
- Risks


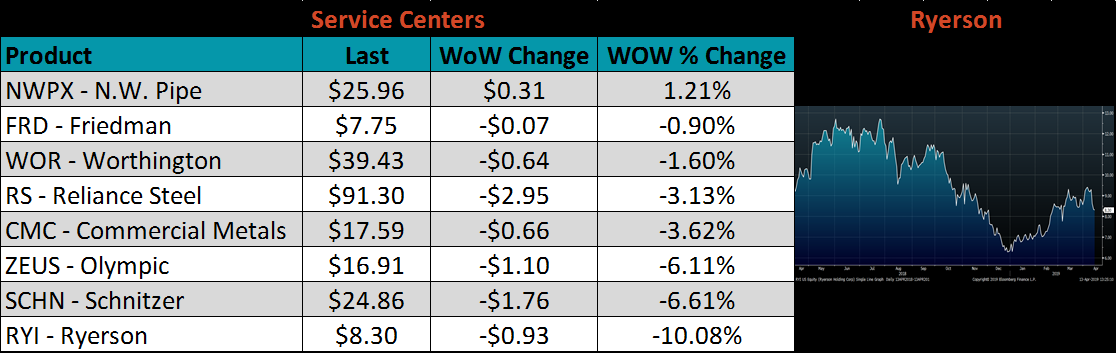
The inventory hangover discussed recently in this report continues to drag out, and the longer it lasts, the worse it will get for service centers. The cost to hold high priced material accumulates daily, increasing the incentive to move it at lower prices. However, market activity remains sparse, as mills have filled most of their capacity with contracts, and several end users wait for the weather to turn before they put material on the ground. The dispersion in prices was vast for the transactions that did occur, creating uncertainty around a stable market price or direction.
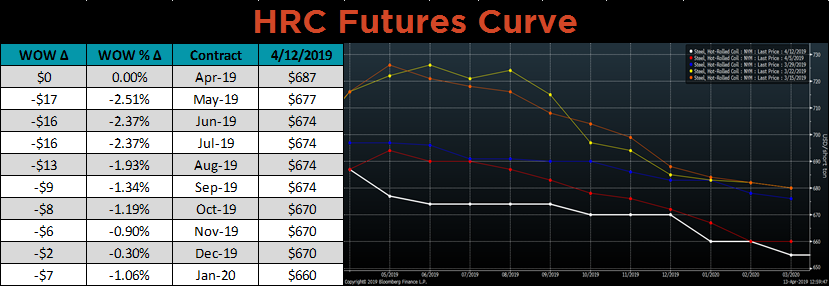
The HRC futures market reflected this uncertainty and displayed a similar subdued activity. The price rally that many expected on the back of the first quarter price hikes has not materialized. As such, the futures curve moved into backwardation in the front maturities, matching the shape of the rest of the curve. Due to the large dispersion in transaction prices in the physical market, it is risky to take a large position, in either direction, on the futures curve.
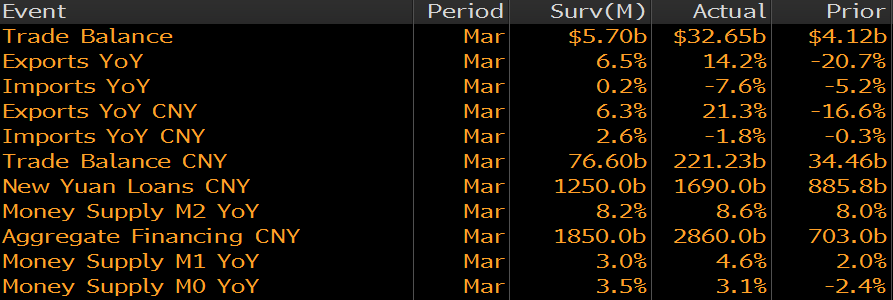
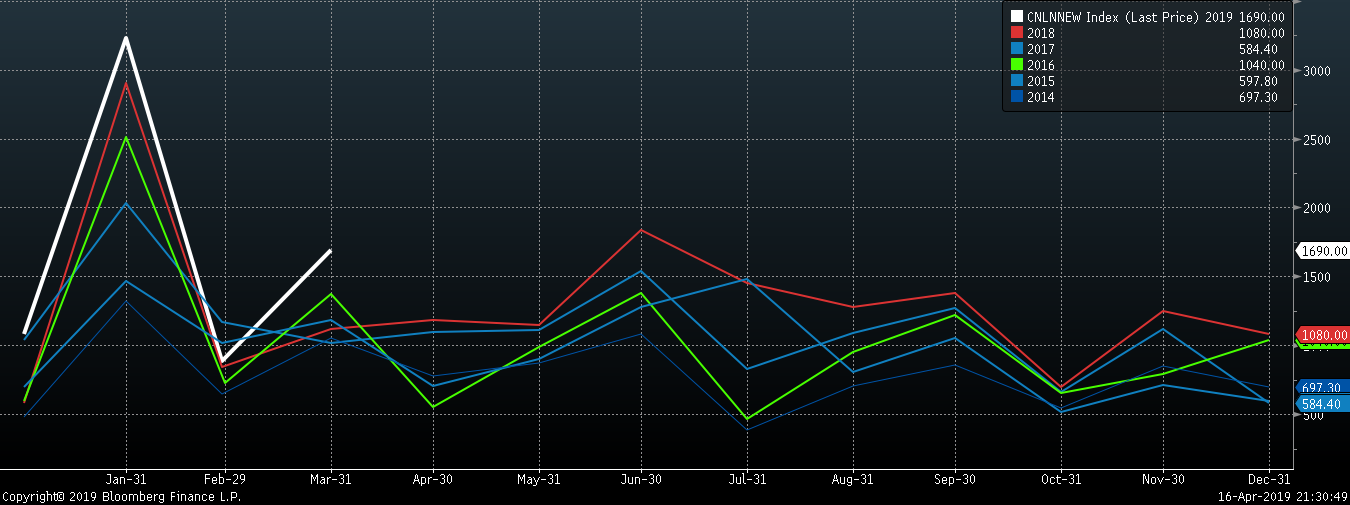
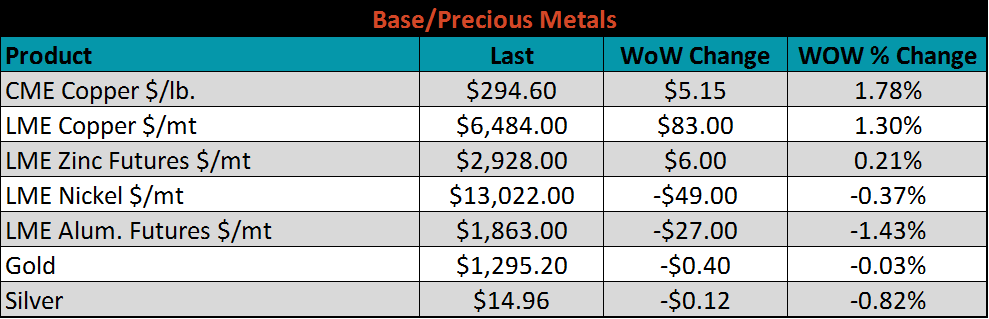
While the domestic physical steel and derivative market dynamics remained generally unchanged over the last week, credit data released in China (below) was encouraging. The data shows exports rebounding in March and significant stimulus above what was expected. Global industrial metal prices rallied on the prospect of a strong recovery from the global demand swoon that occurred at the beginning of the year. China’s spot HRC price continues to grind higher, dragging the world price with it. This puts imported material prices at increasingly unattractive levels, and we expect these low import levels to persist.
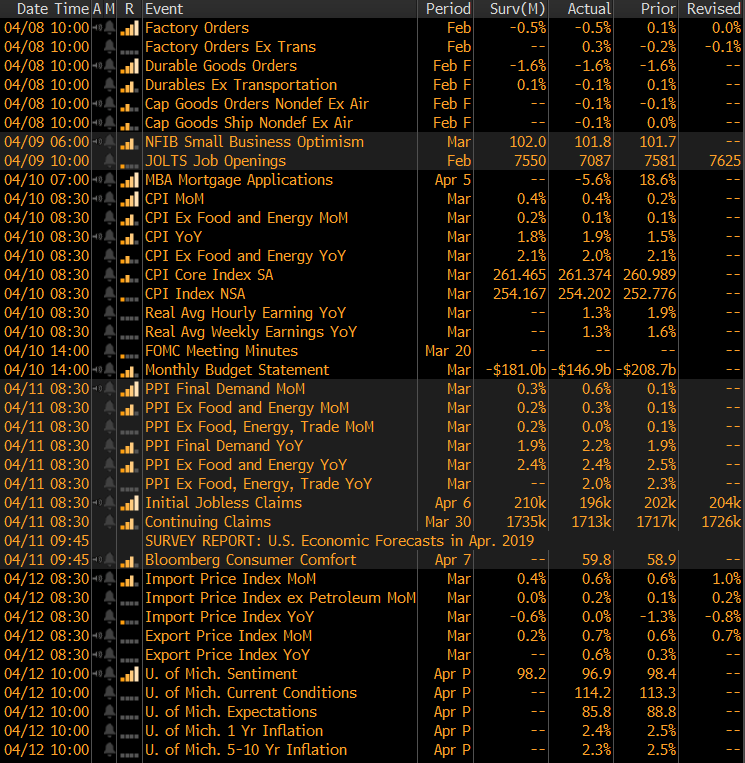
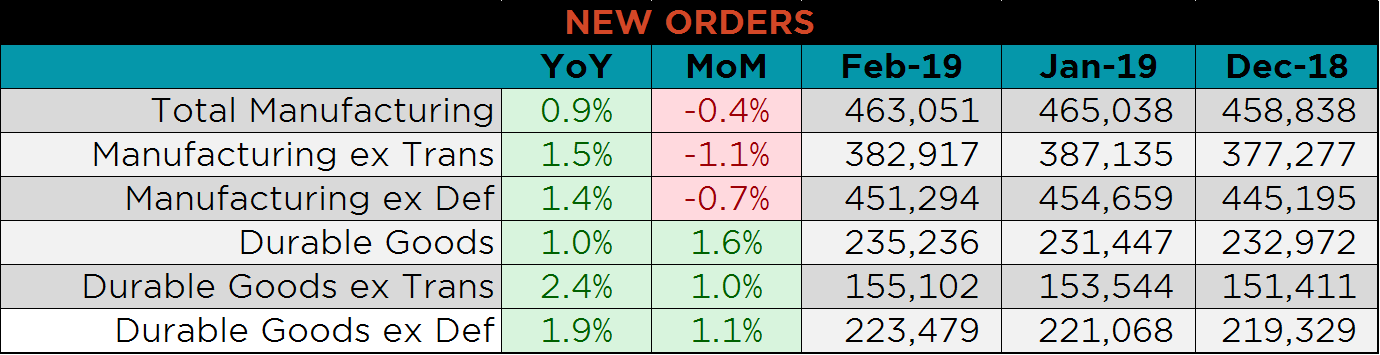
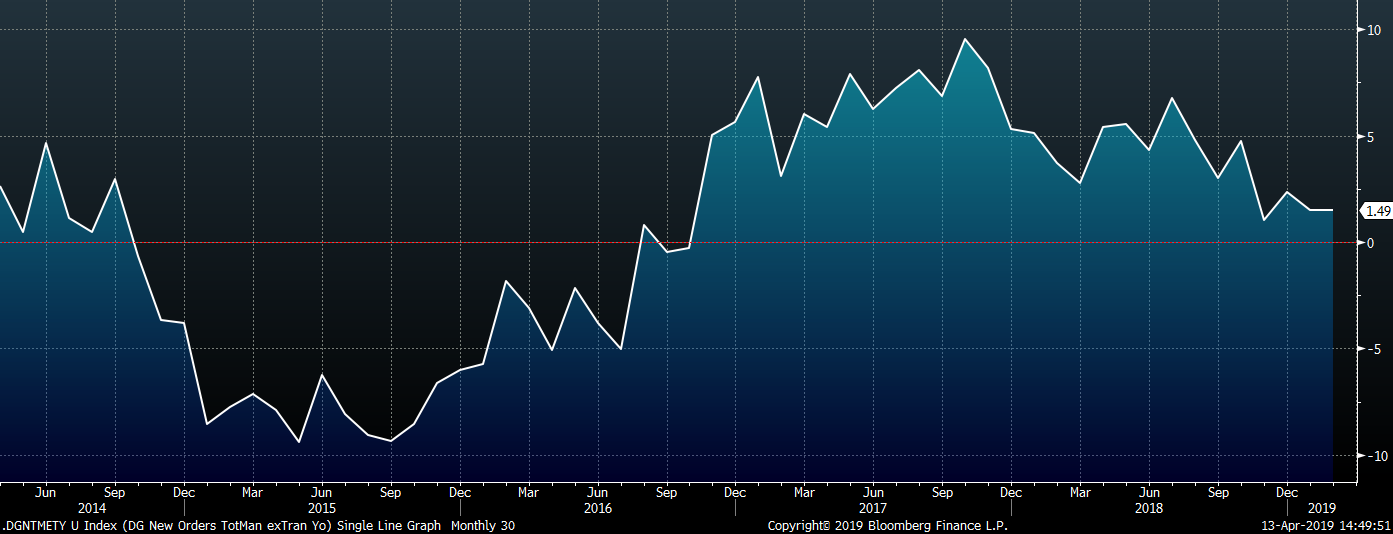
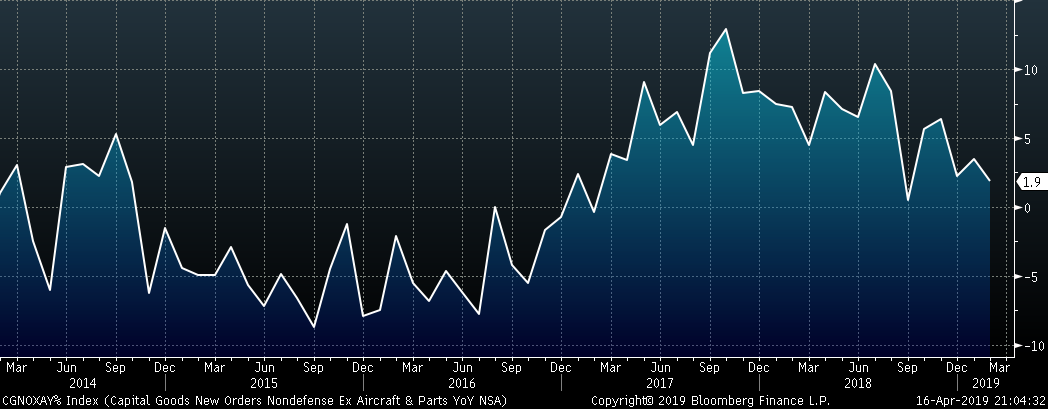
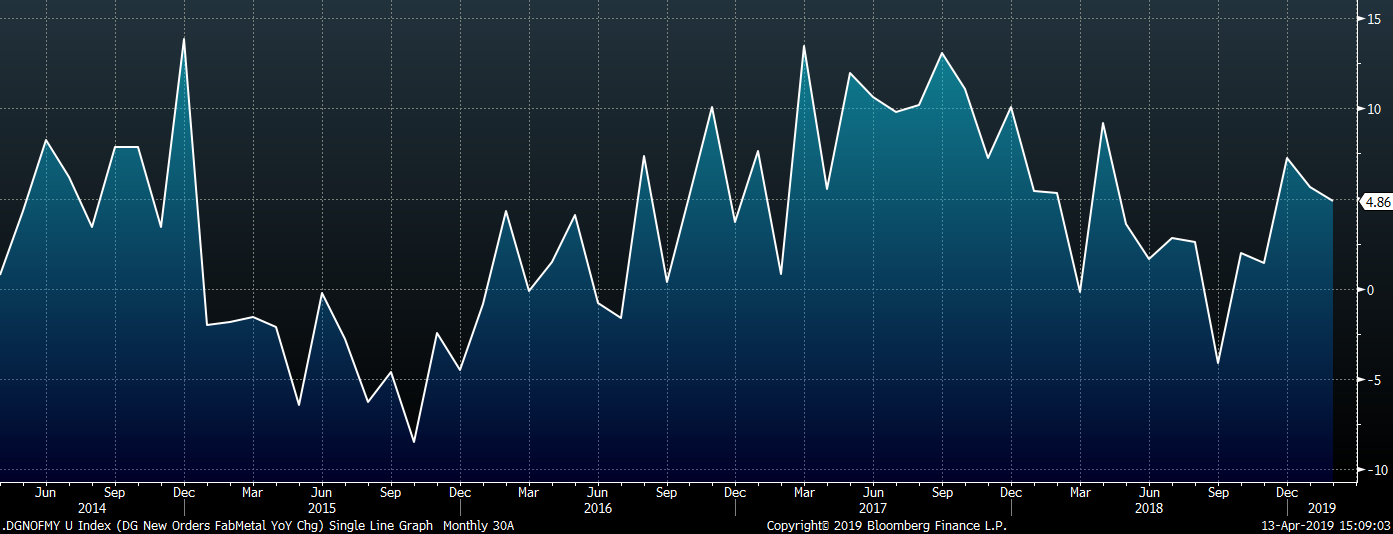
The following table shows YoY and MoM percentage change in February new orders from the durable goods report. These charts show the YoY percentage change in new orders in February for the following categories. While manufacturing activity slowed recently, new orders have stabilized, and continue to show growth on top of the strong levels of 2018. Capital goods orders nondefense ex-transportation are an indication of CapEx.
Below are the most pertinent upside and downside price risks:
Upside Risks:
Downside Risks:
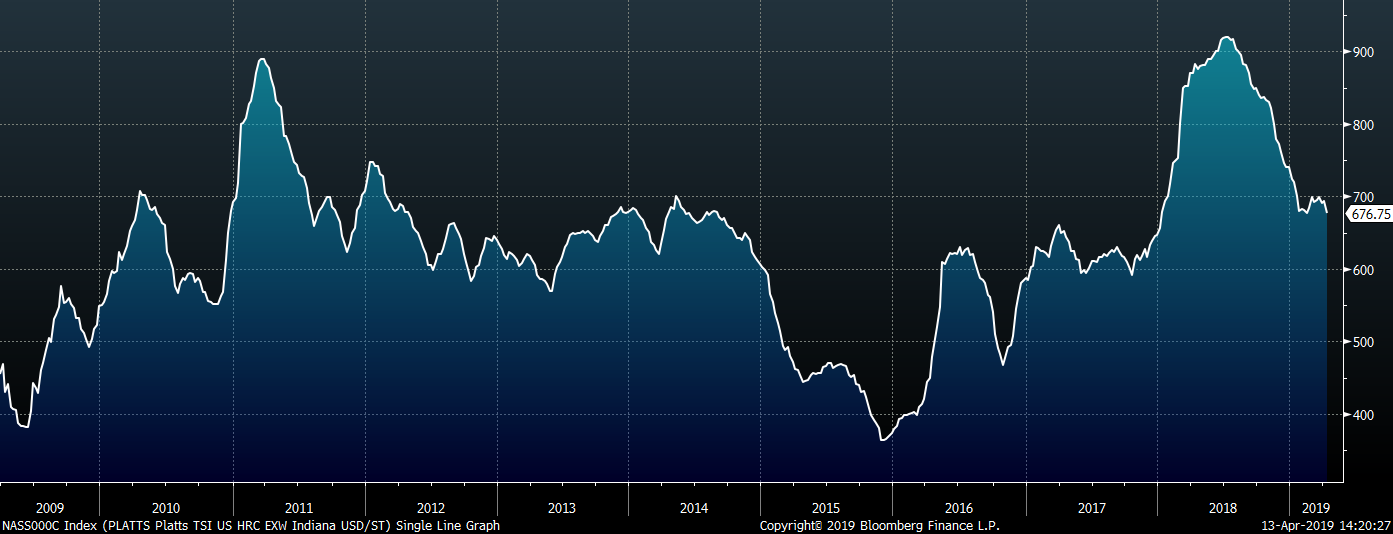
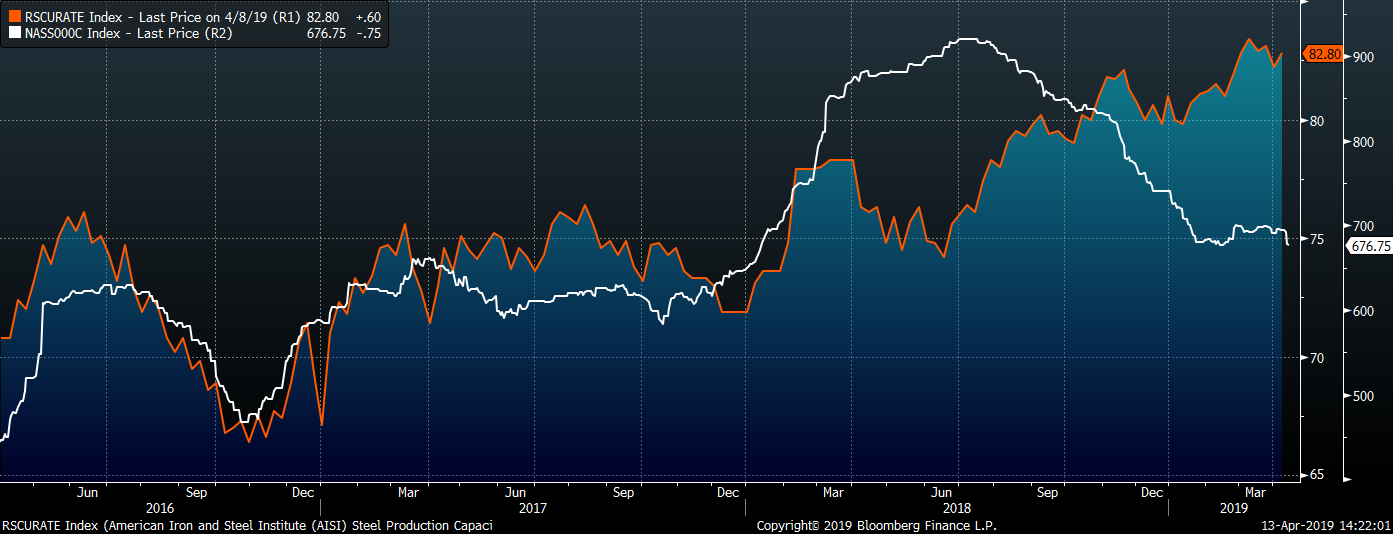
The Platts TSI Daily Midwest HRC Index was down $17.5 to $676.75.
The CME Midwest HRC futures curve shown below with last Friday’s settlements in white. The front of the curve moved lower WoW, and it continues to be flat through the remainder of 2019.
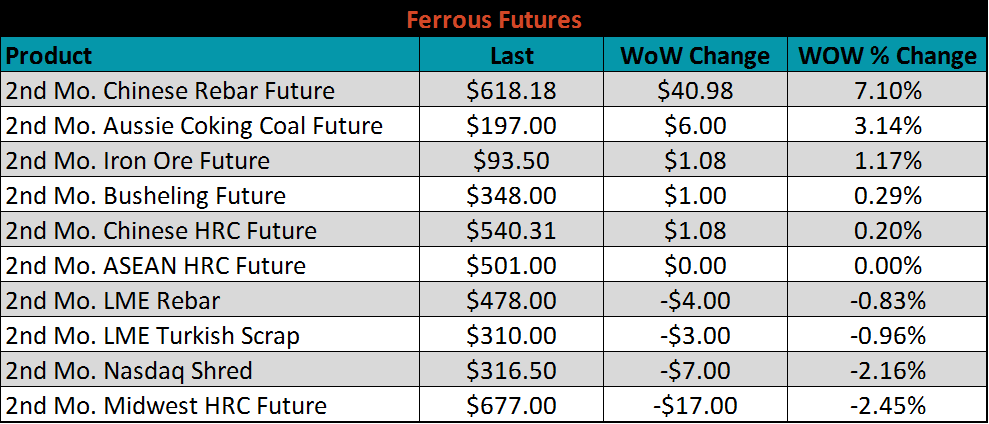
May ferrous futures were mixed. Chinese Rebar gained 7.1%, while Midwest HRC lost 2.5%.
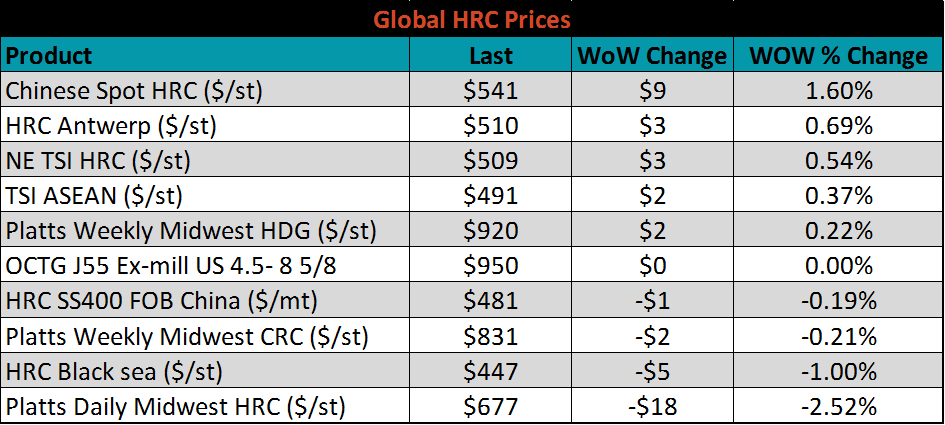
Flat rolled indexes saw little change, or were lower in the U.S. and Europe while Chinese spot was up again, this time 1.6%. The lack of a significant decline in global prices continues to make importing less attractive compared to buying from domestic mills.
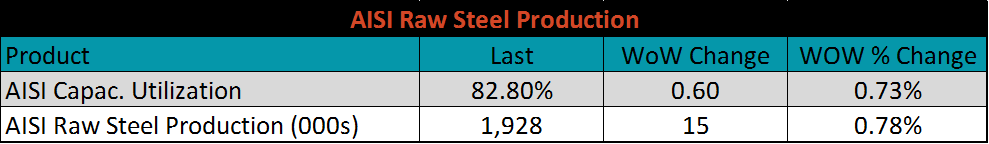
The AISI Capacity Utilization Rate is up 0.6 points to 82.8%. The Trump administration’s goal of 80% Capacity Utilization Rate has held since October 2018.
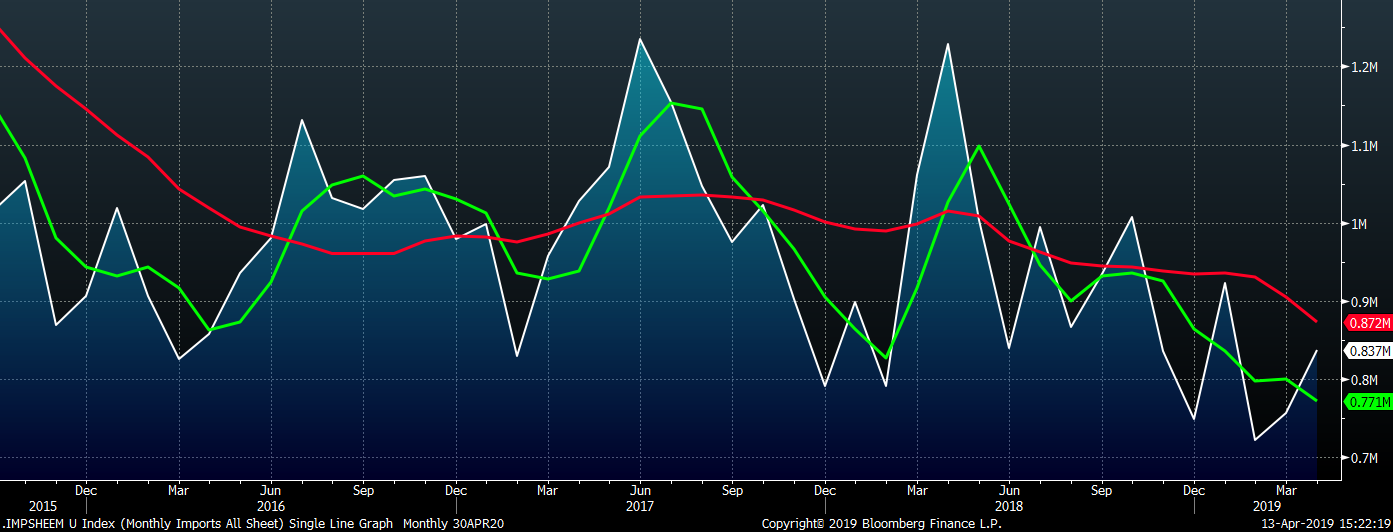
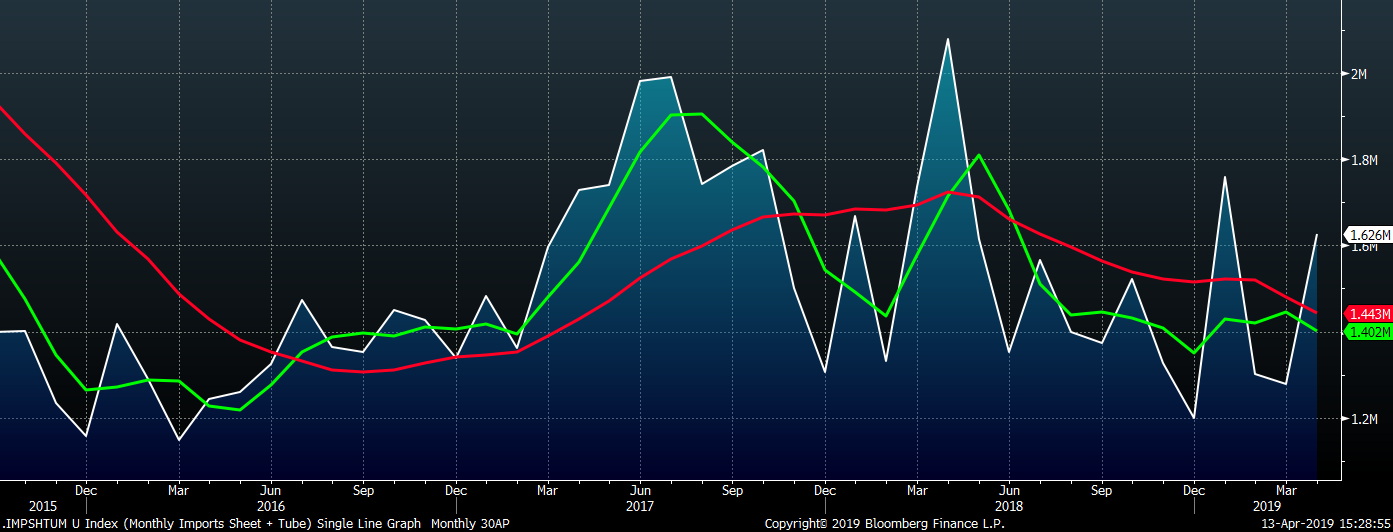
April flat rolled import licenses are forecast to increase to 837k MoM, while March flat rolled import licenses are forecasted to increase 34k tons MoM to 755k.
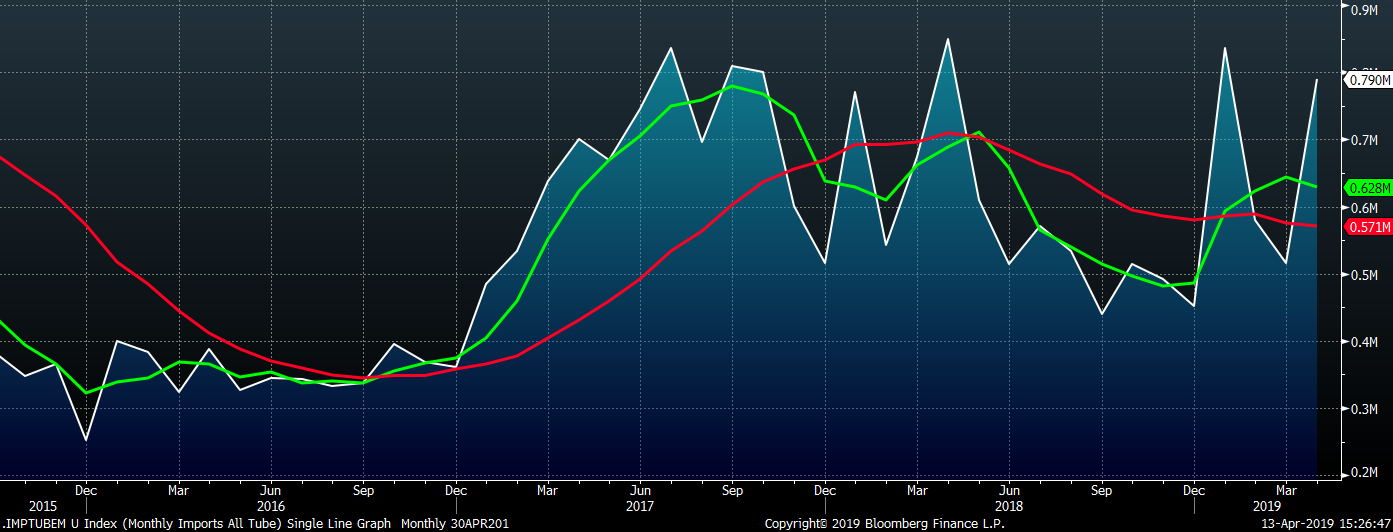
April tube import license data is forecasted to increase 274k to 790k tons MoM after a decrease of 65k in March.
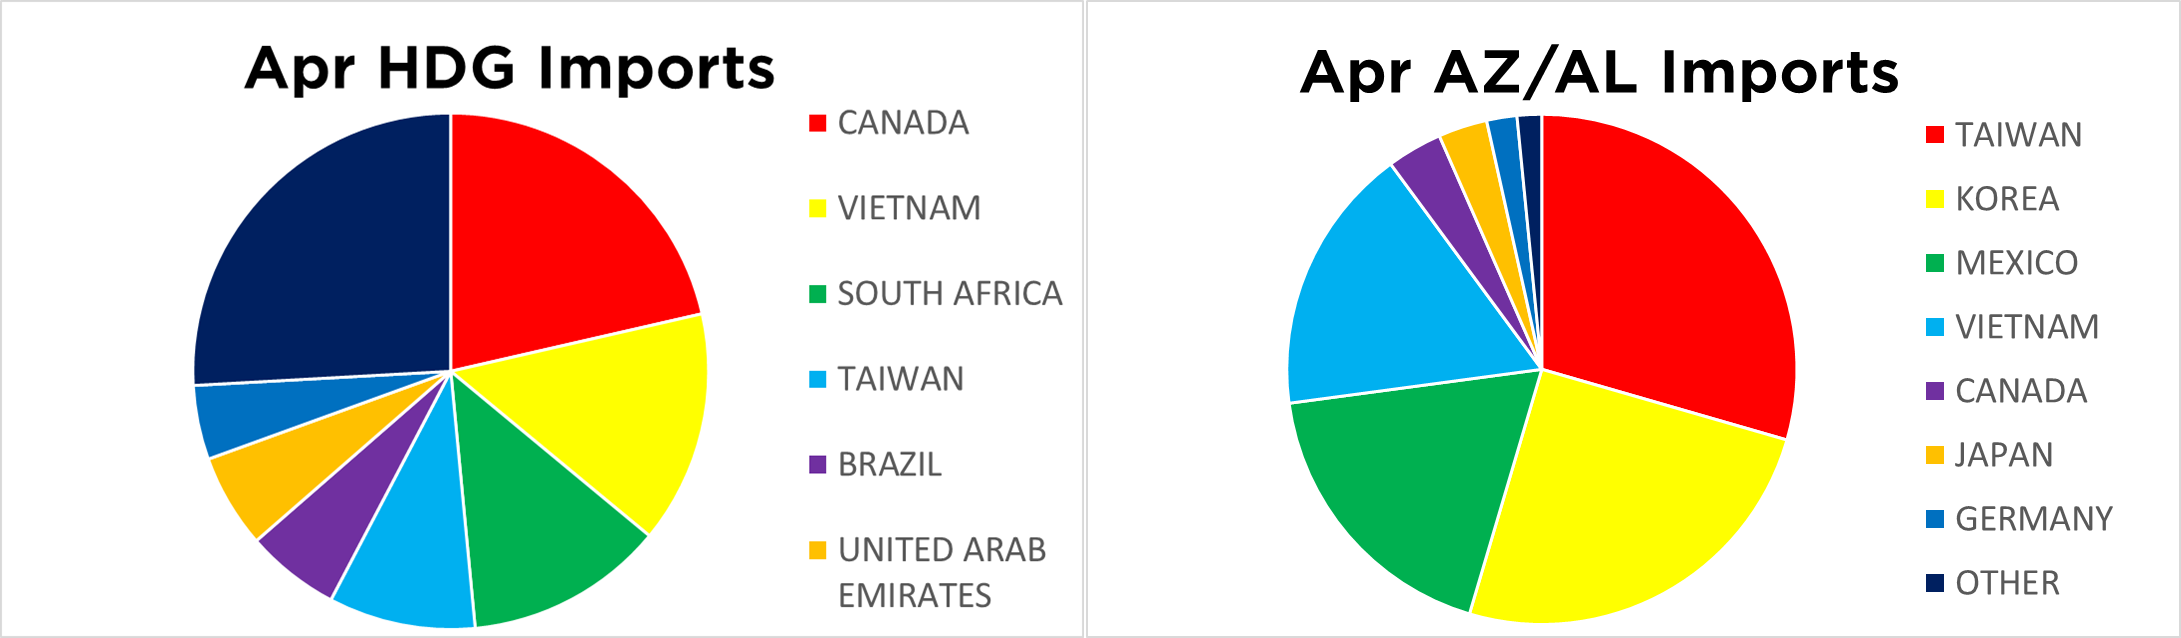
AZ/AL import licenses forecast a decrease of 16k to 50k in April.
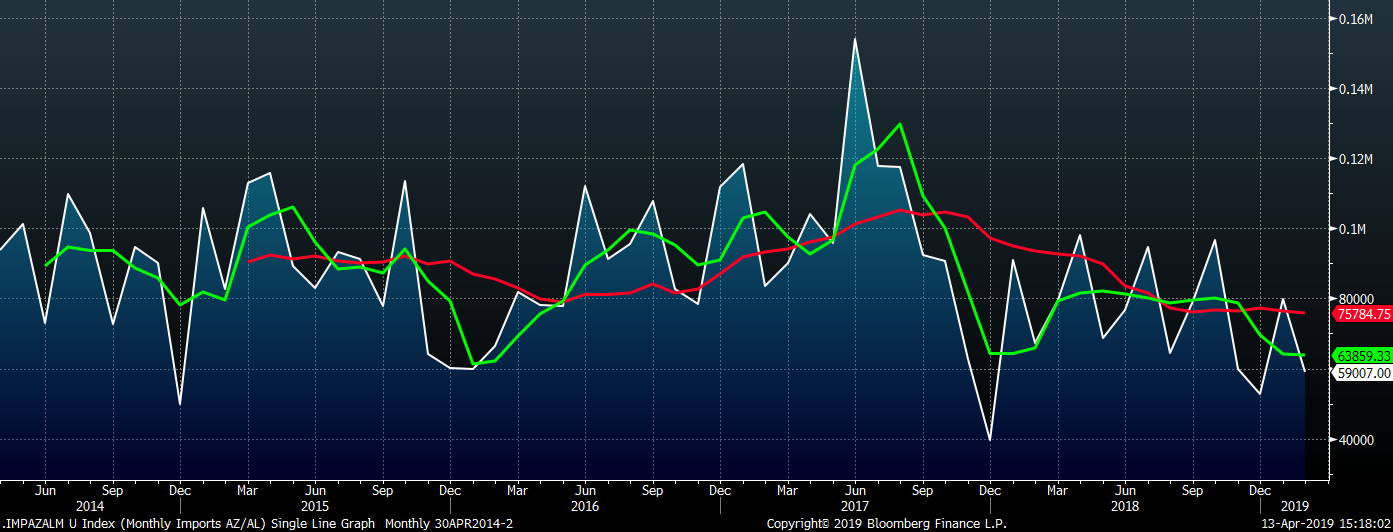
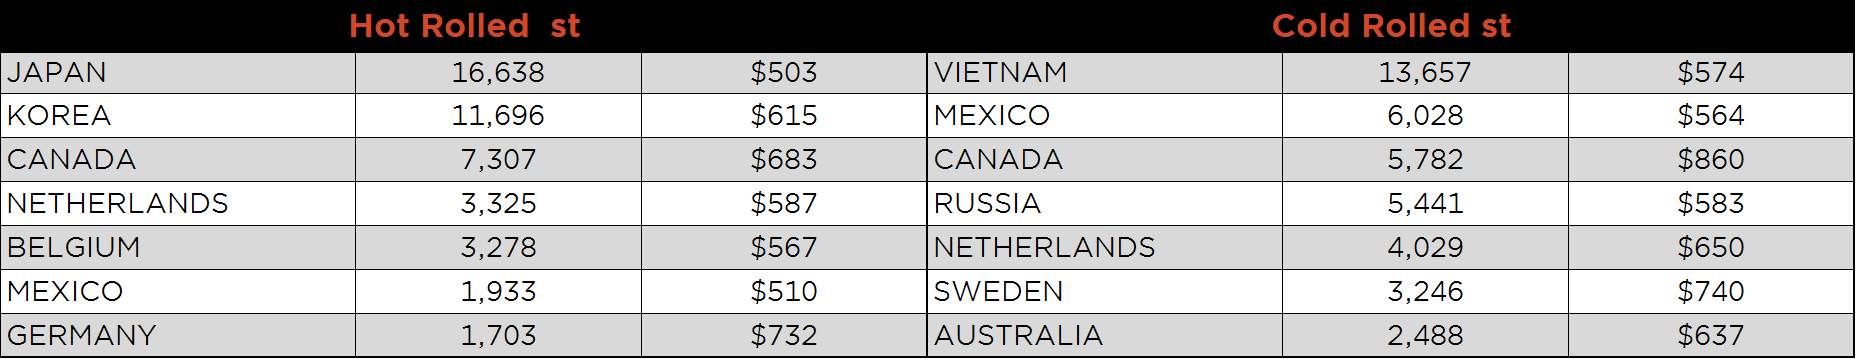
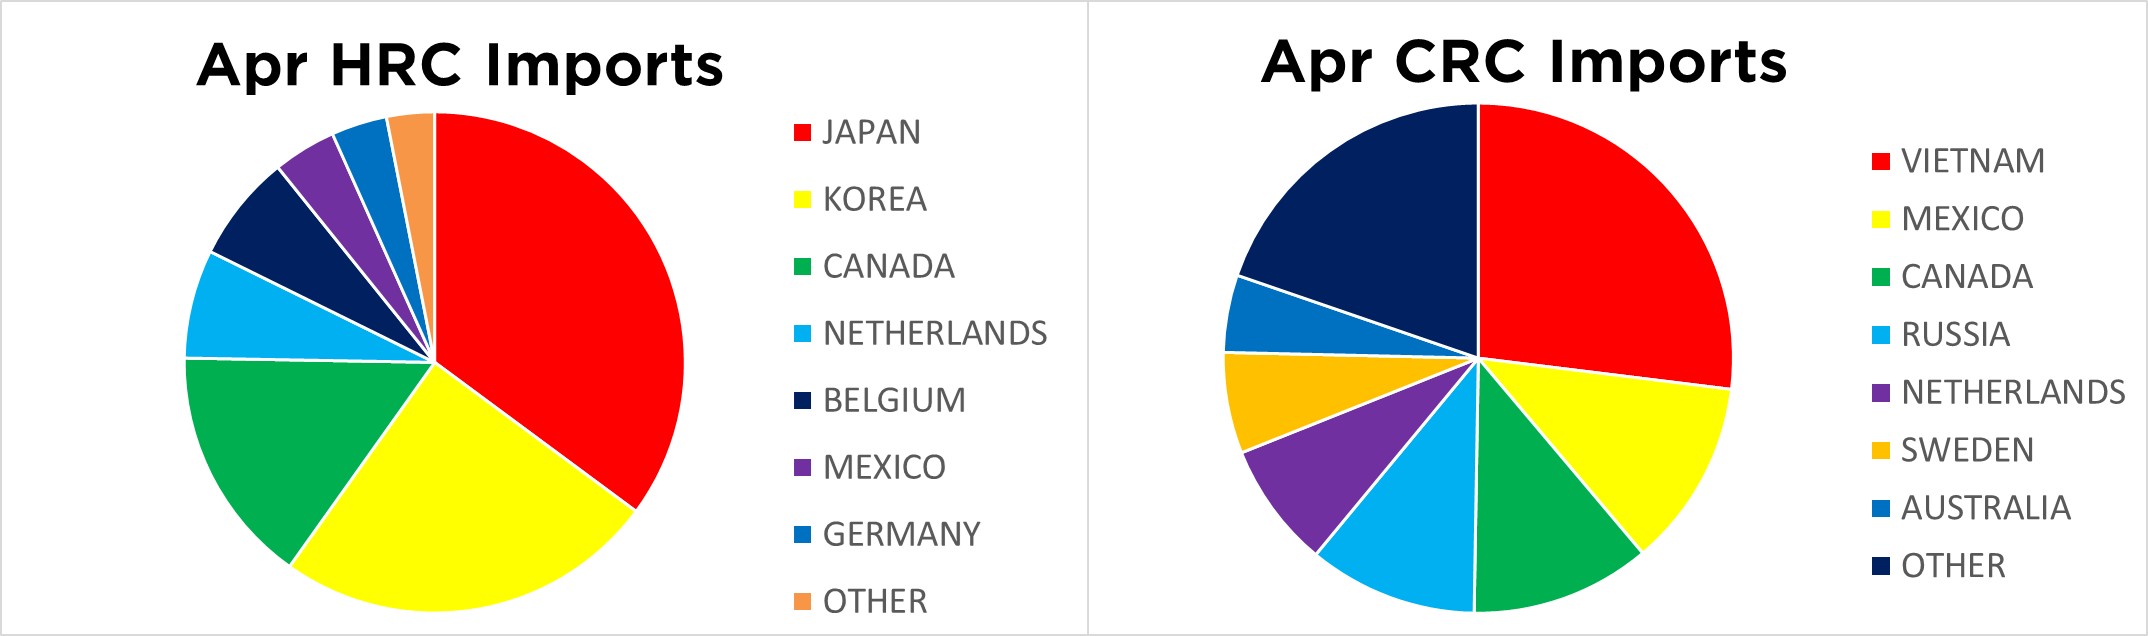
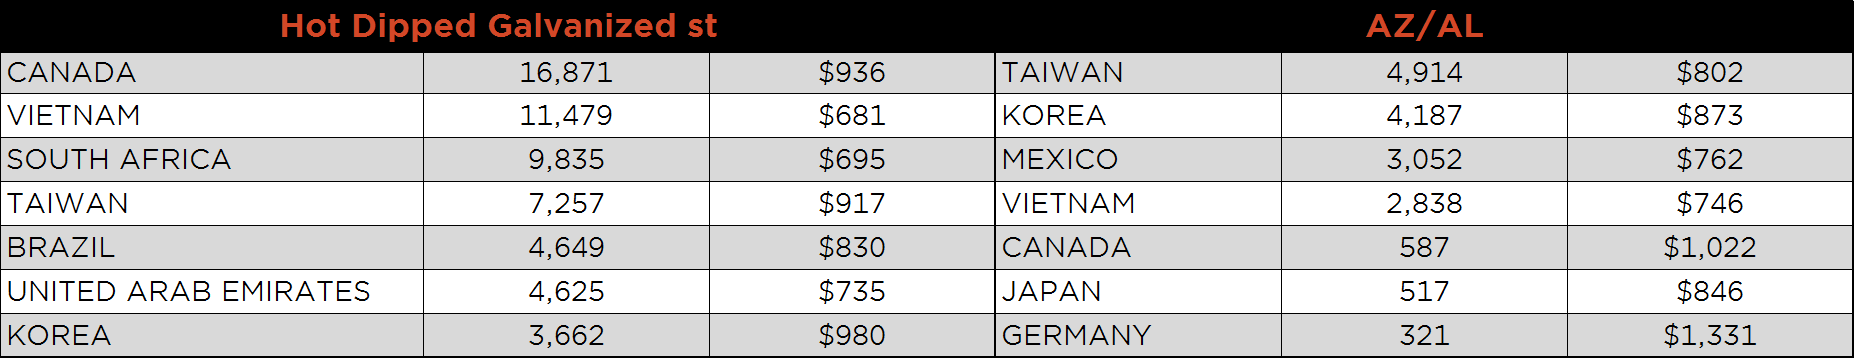
Below is April import license data through April 9, 2019.
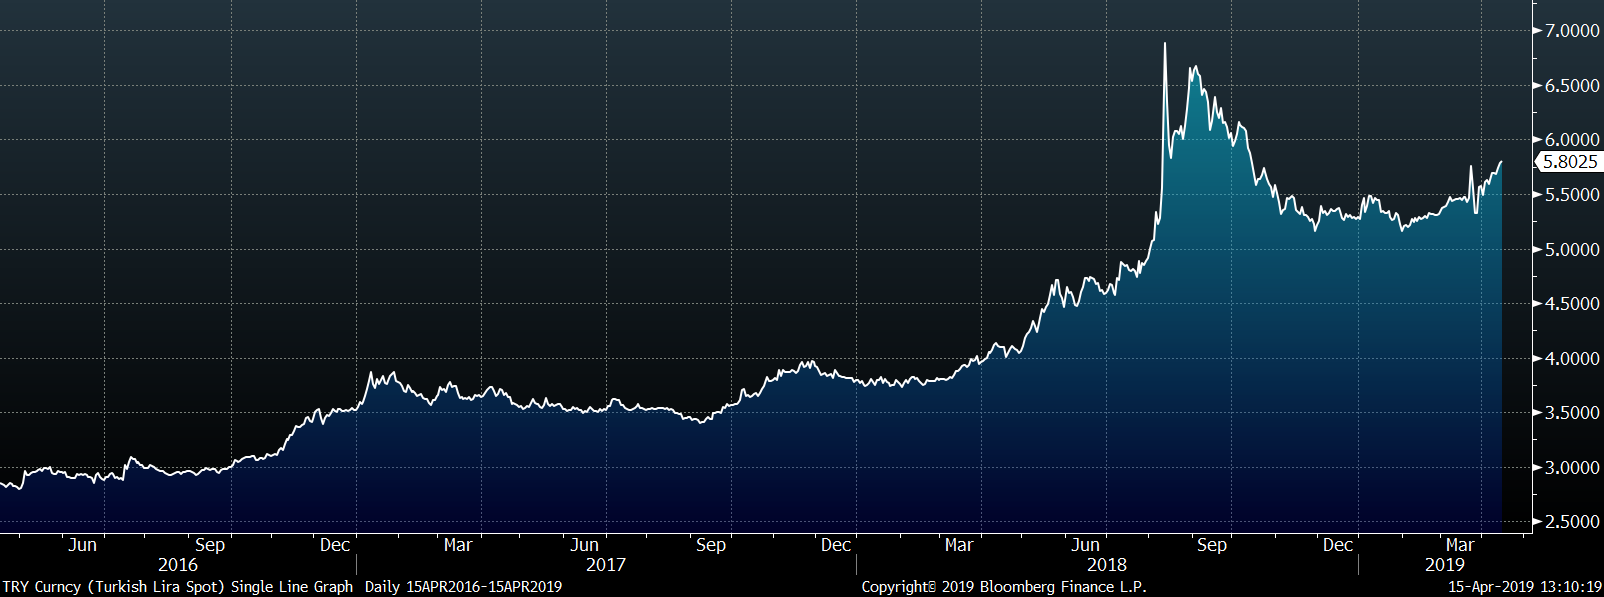
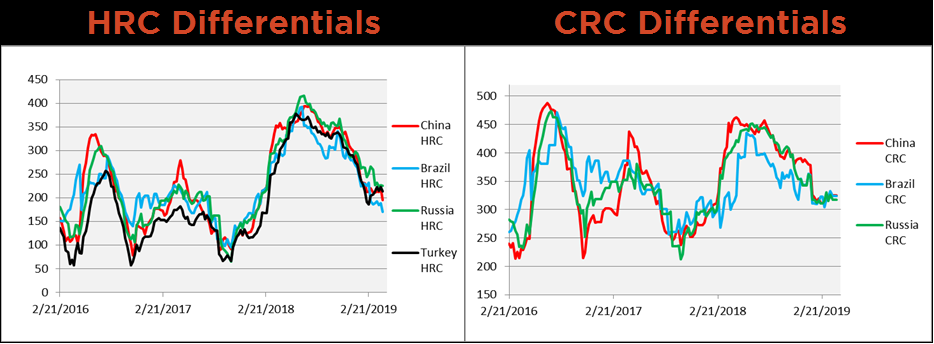
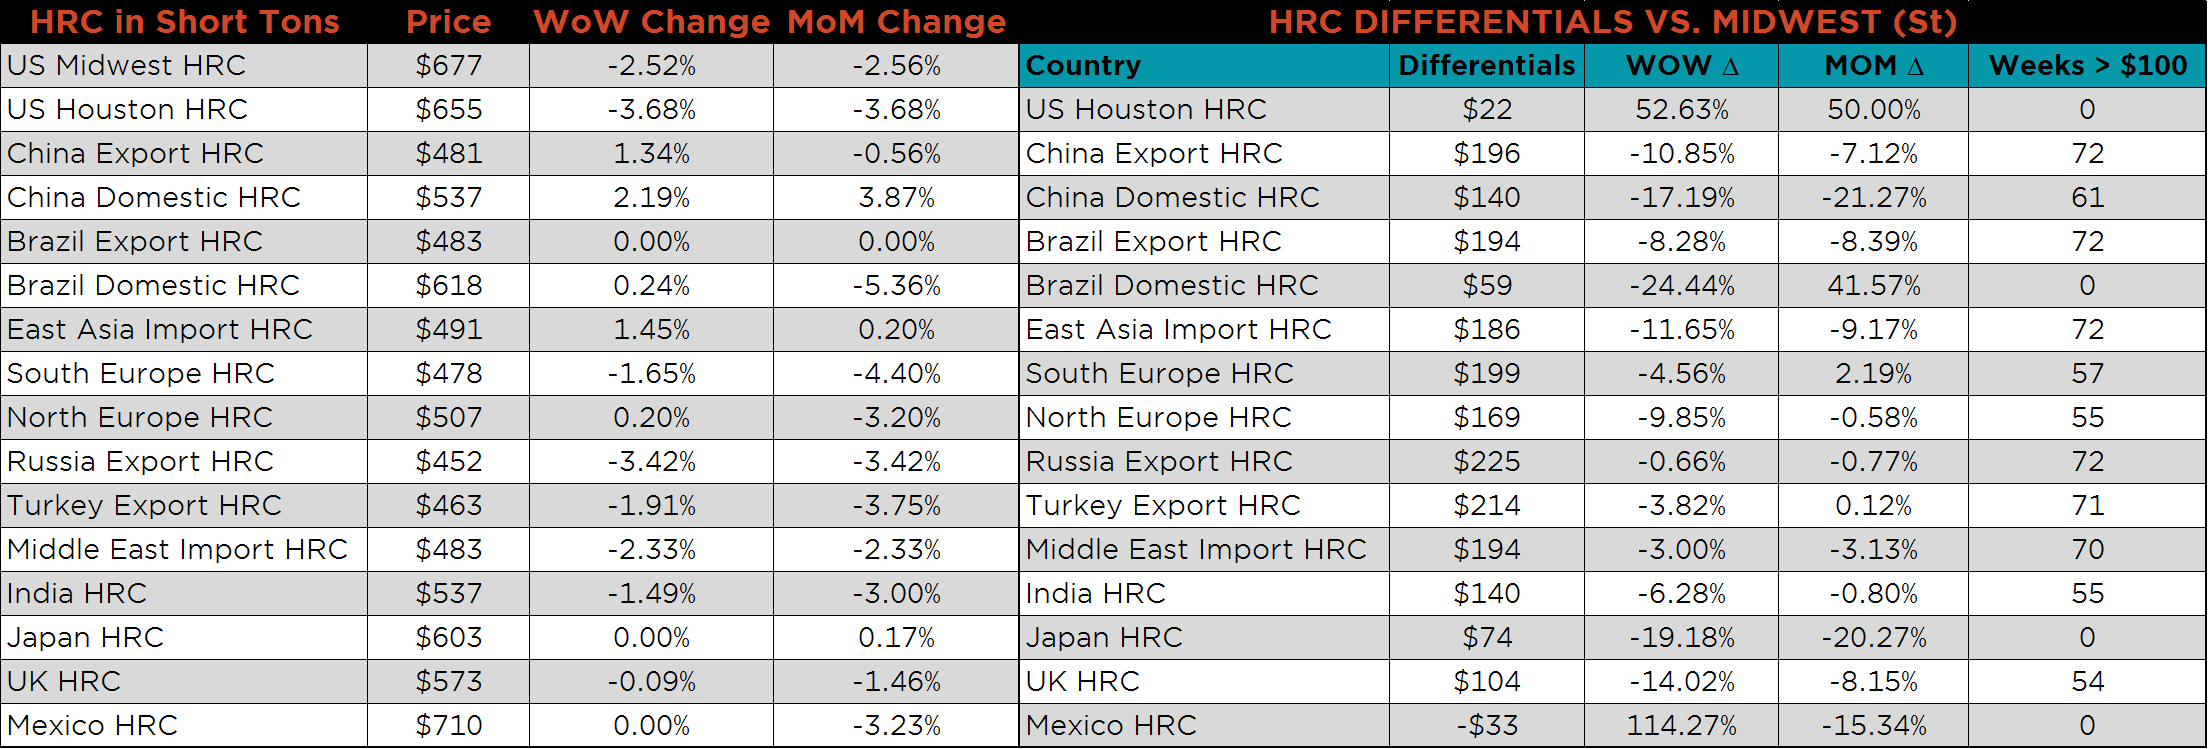
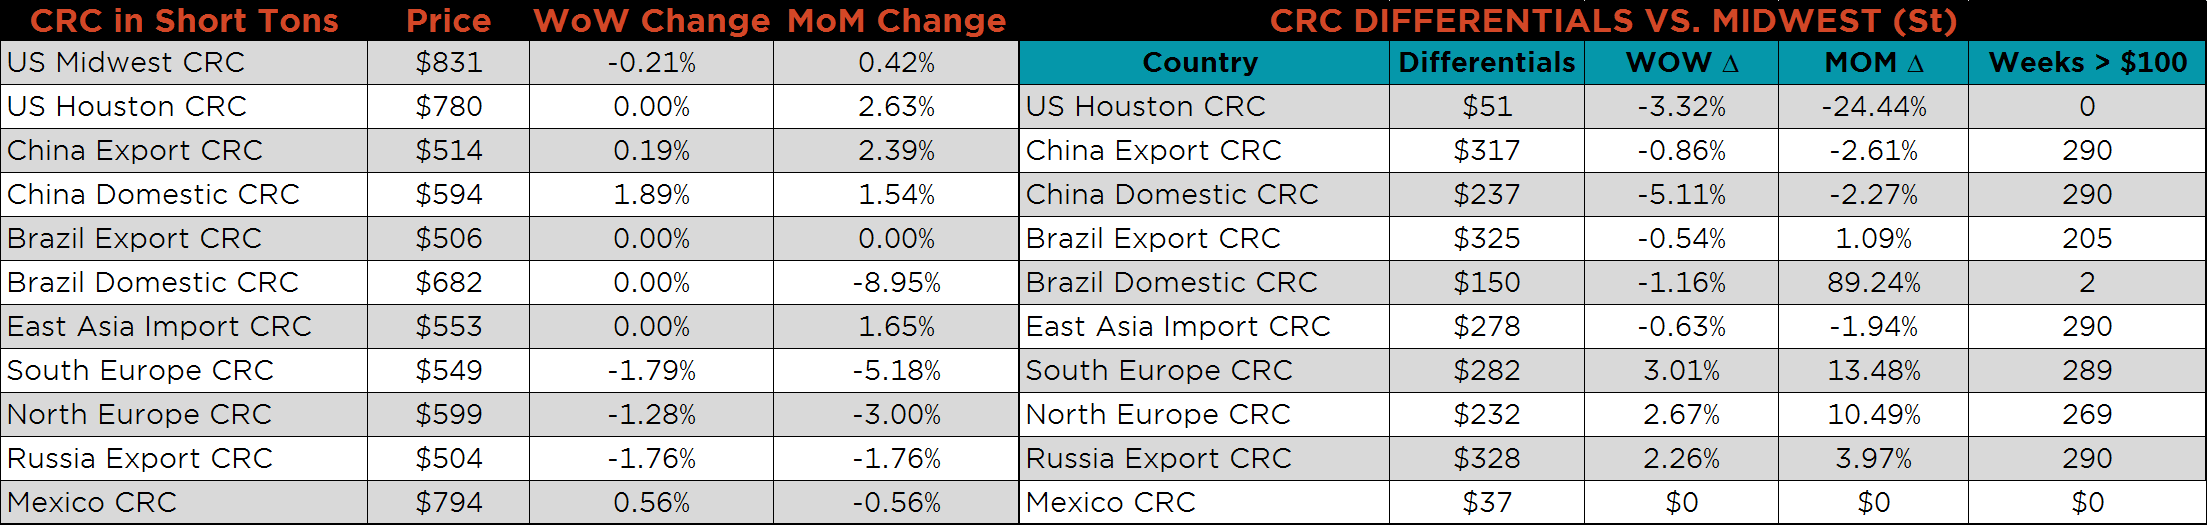
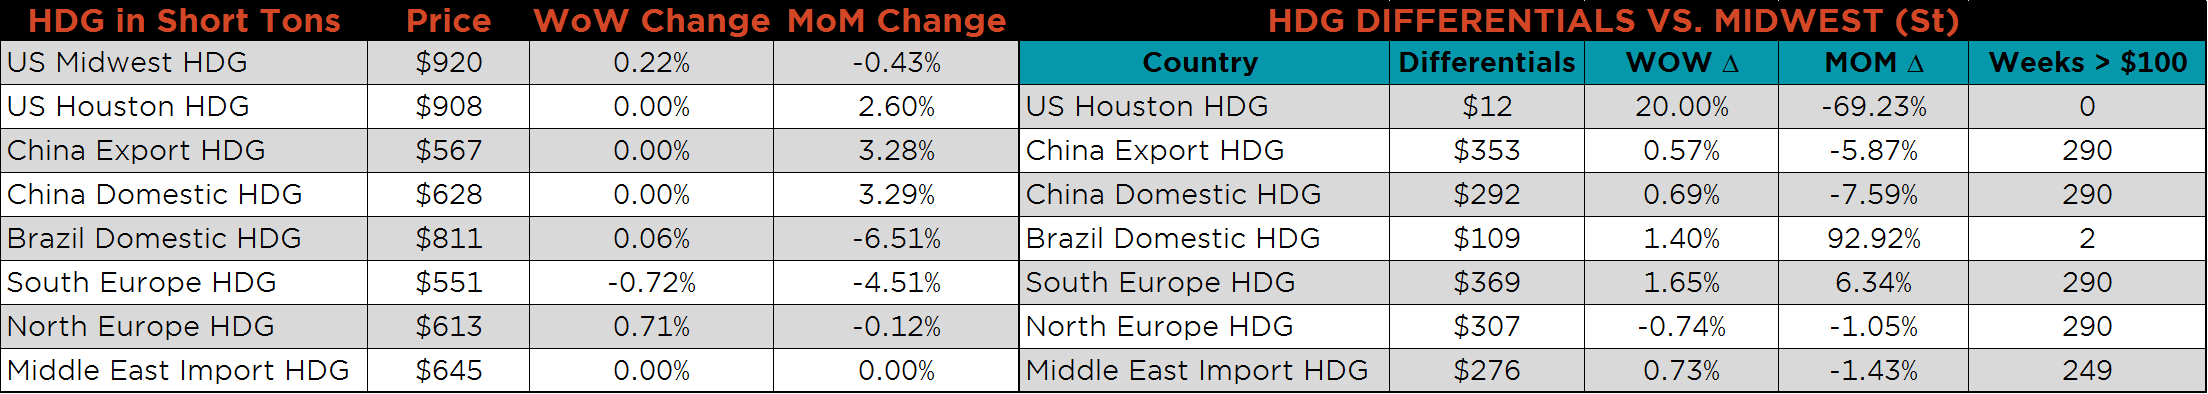
Below are HRC and CRC Midwest vs. each country’s export price differentials using pricing from SBB Platts. The Turkish HRC differential appears to have lost its momentum and fell along with the Chinese, Brazilian and Russian differentials. All three CRC differentials showed little change.
SBB Platt’s HRC CRC and HDG WoW pricing is below. Midwest HRC prices were down 2.5%, while CRC and HDG prices showed very little change. Russian Export HRC prices fell 3.4%, while Chinese Export prices rose 1.3%.
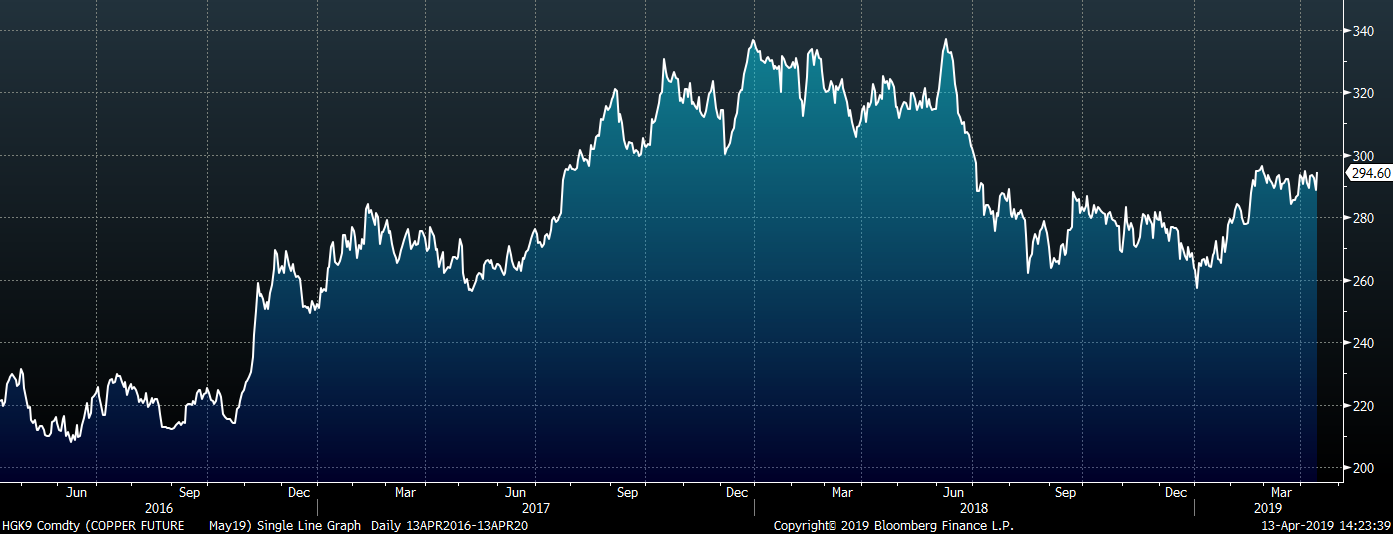
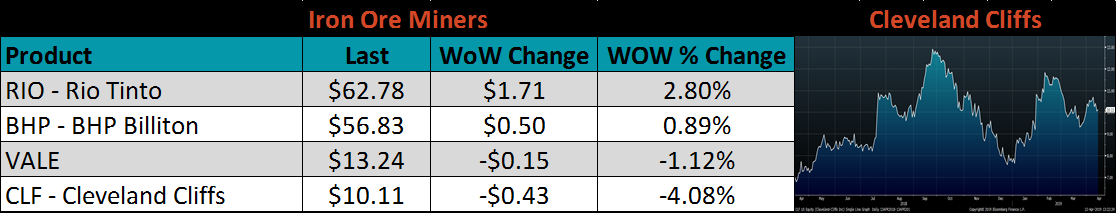
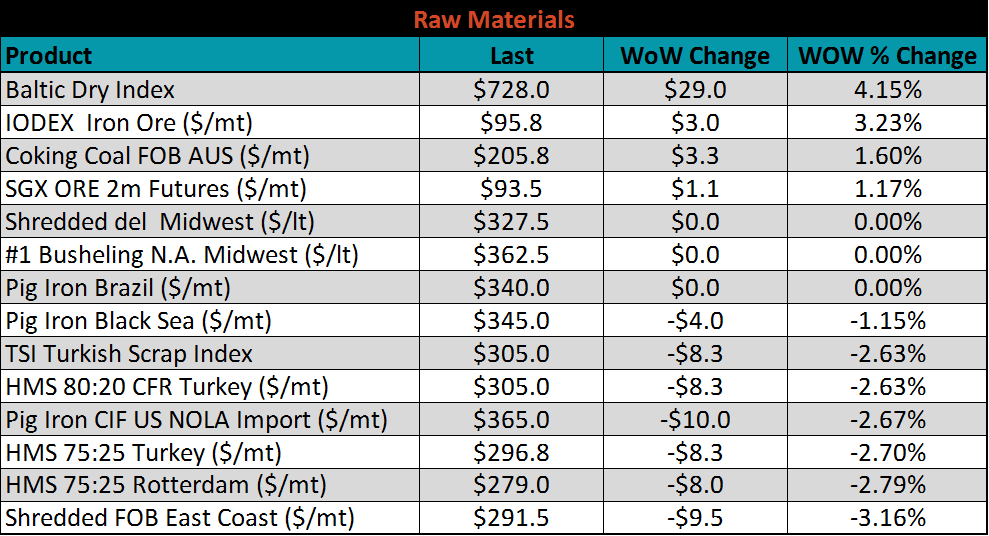
Raw material prices were mostly lower. The exception again this week was iron ore prices, with the IODEX up 3.2% and the June future gaining 1.2%. While the price move in iron ore has been driven by supply concerns, eventually higher prices will affect demand for the raw material. Mills will look to deplete iron ore inventory stocks, and wait for prices to move lower before restocking.
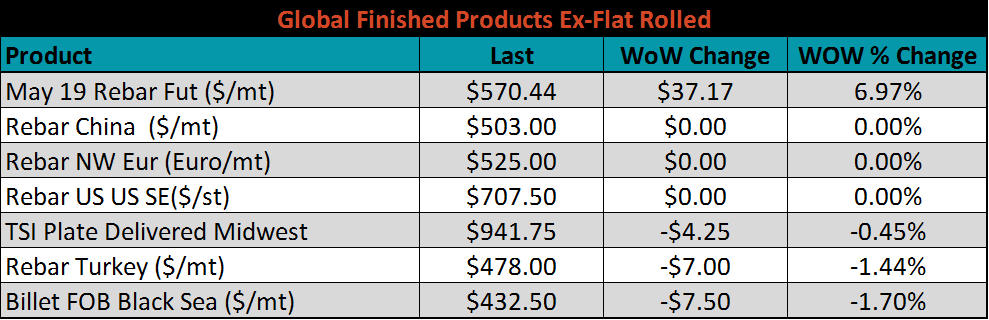
Ex-flat rolled prices are below.

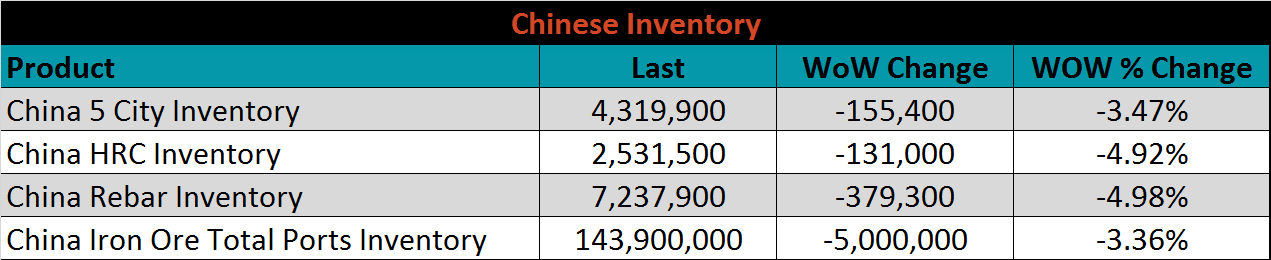
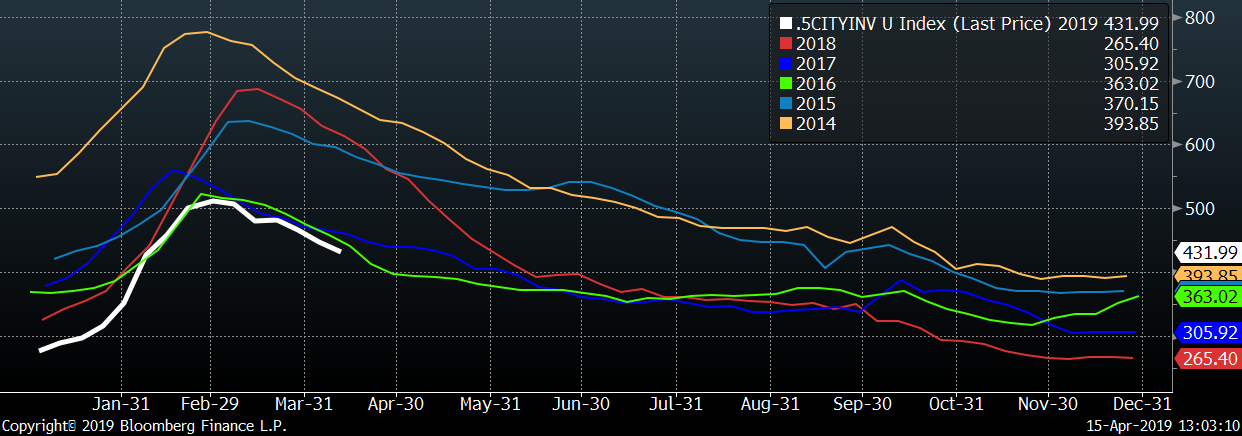
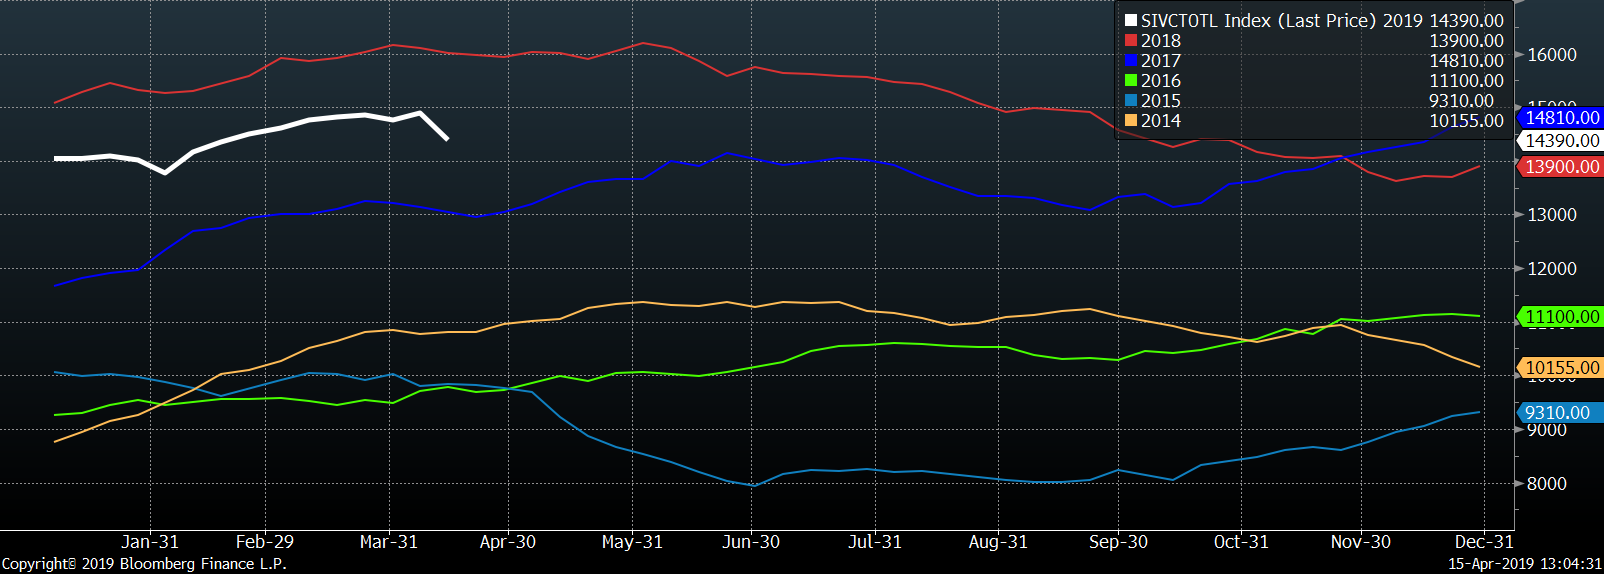
Below are inventory levels for Chinese finished steel products and iron ore. Inventory levels continue to move lower for Rebar and HRC. Iron ore ports inventory began to decline as the supply disruptions reverberated through the global market. The Five City Inventory level is still at the lowest level in the last 6 years.
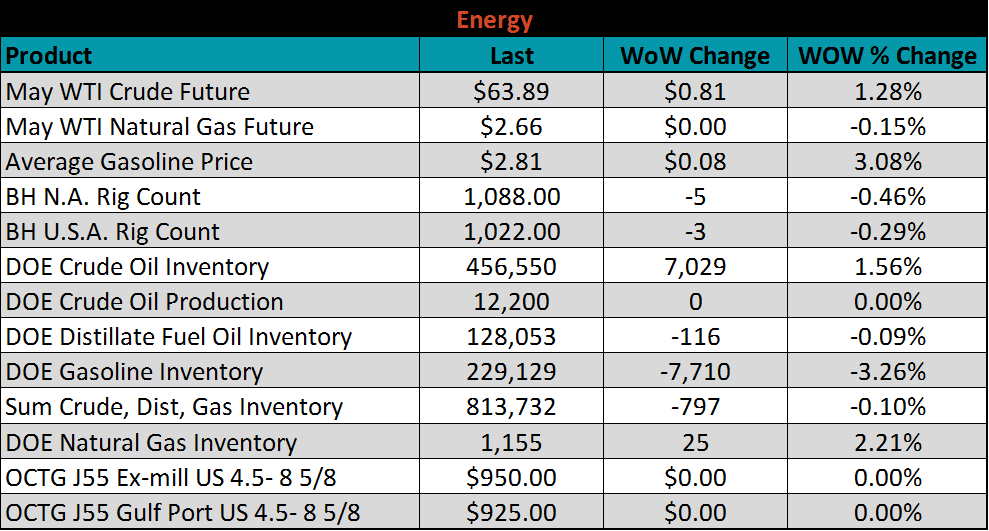
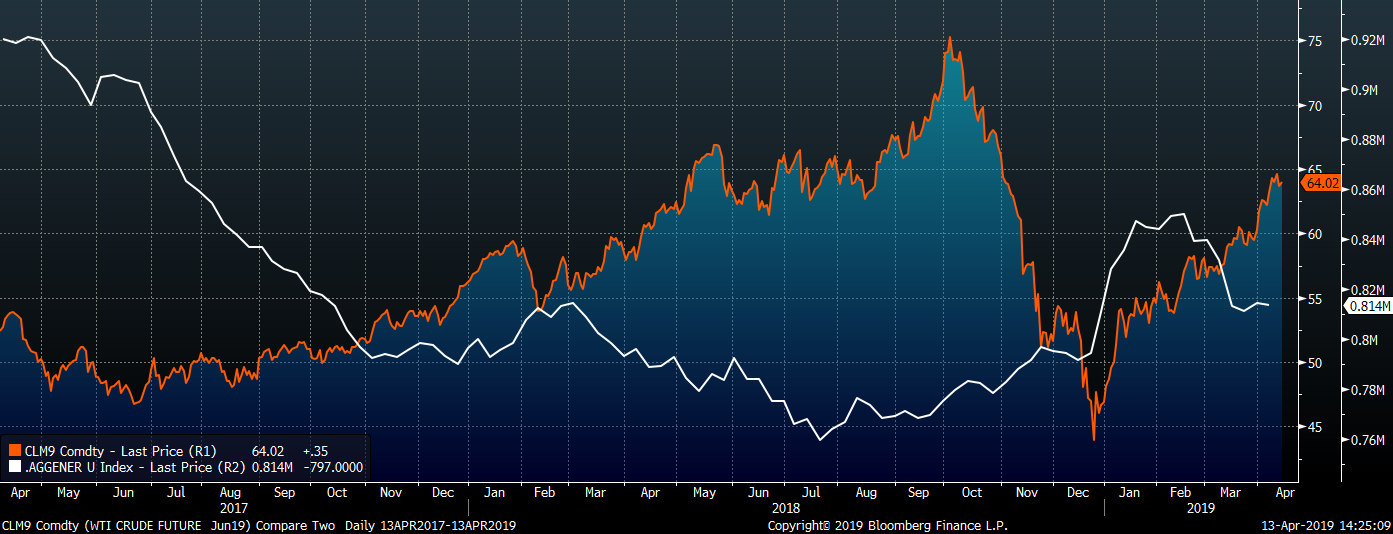
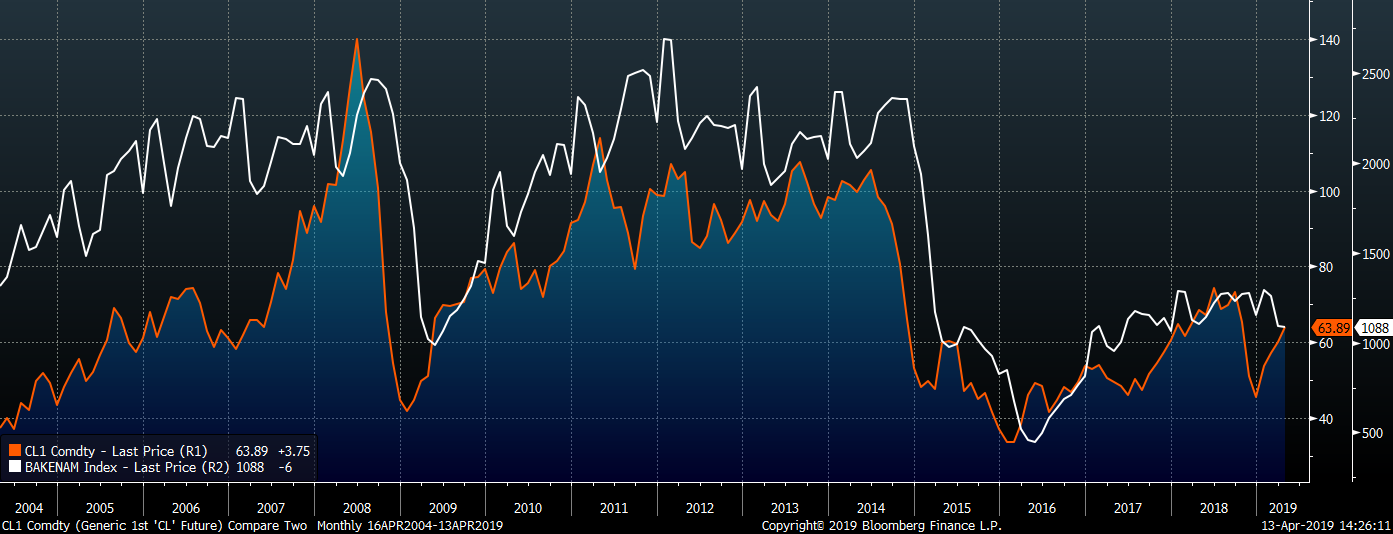
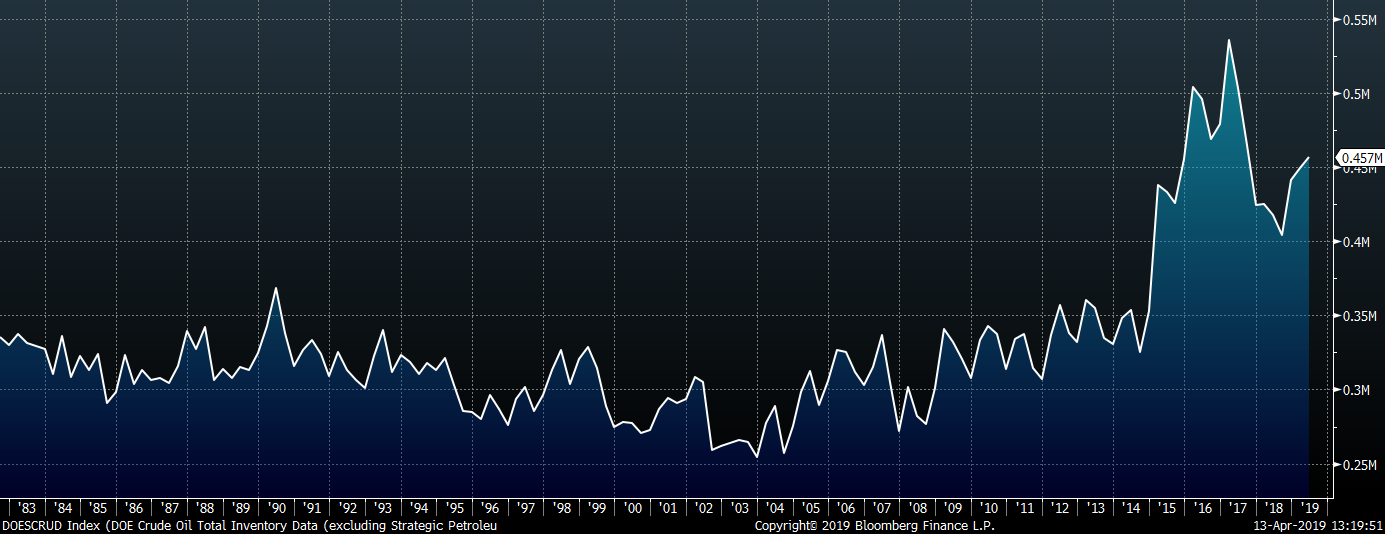
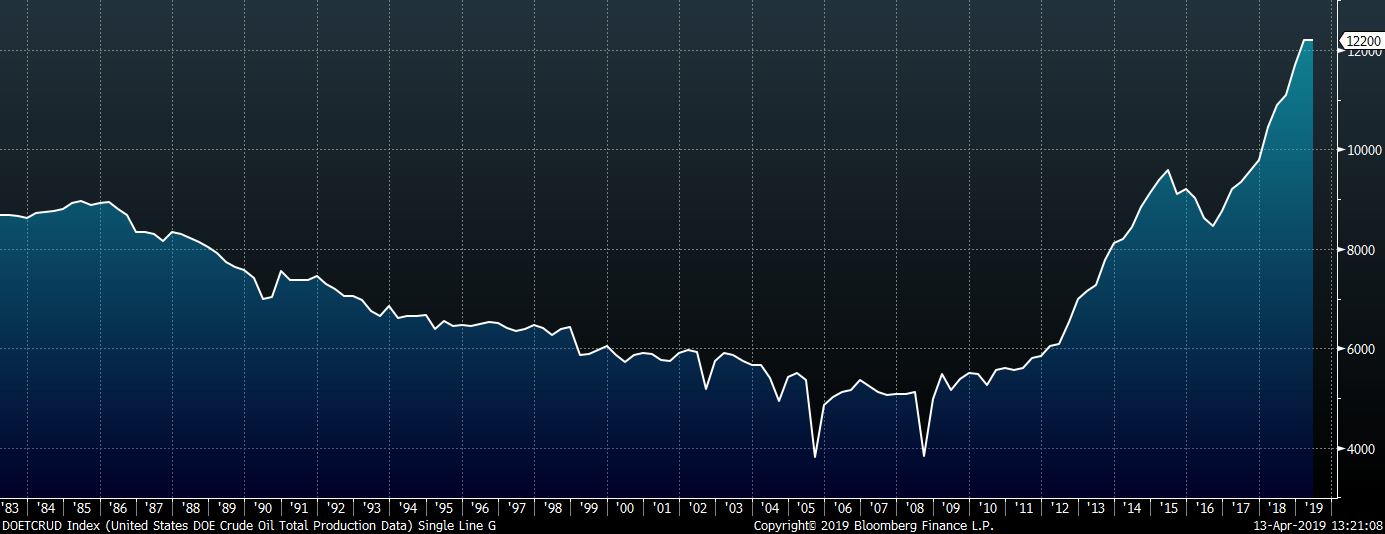
Last week, the May WTI crude oil future gained $0.81 or 1.3% to $63.89/bbl. The aggregate inventory level was slightly down 0.1%, driven by a 3.3% reduction in gasoline inventory. Crude oil production remains at the record high of 12.2m bbl/day. The U.S. rig count lost three rigs while the North American rig count lost five. Price strength in the oil market should incentivize participants to build additional rigs, increasing the demand for tubular products.
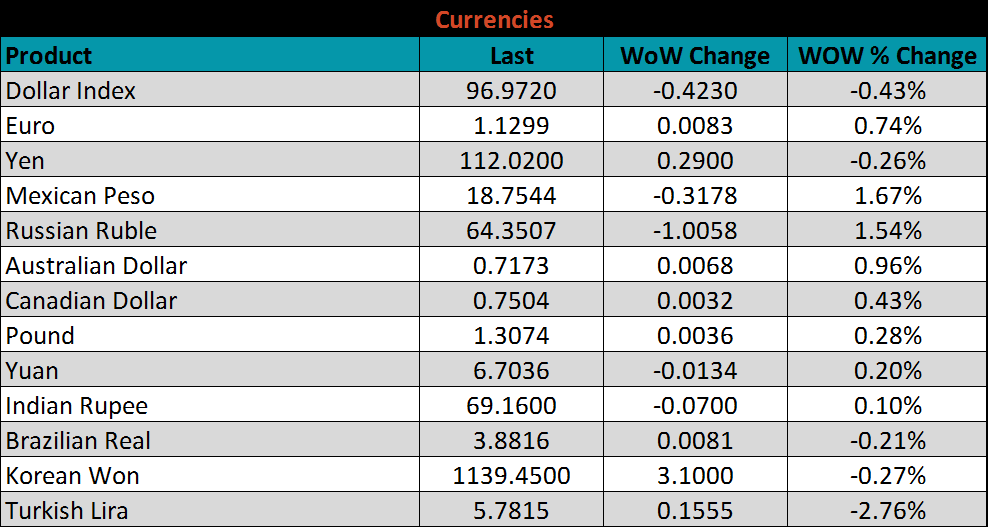
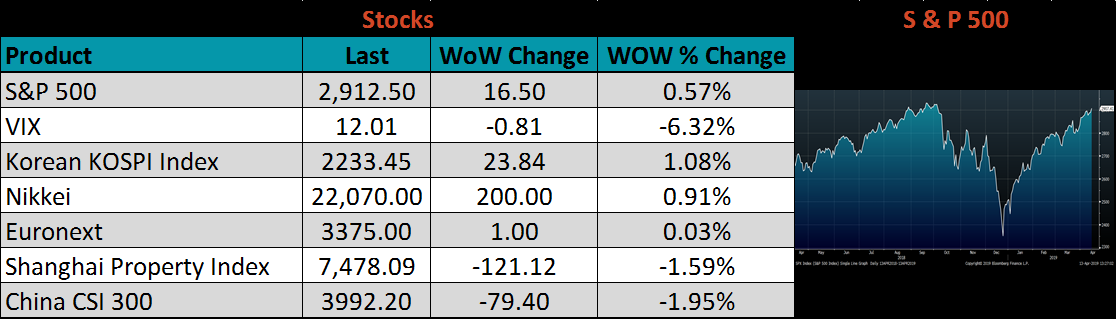
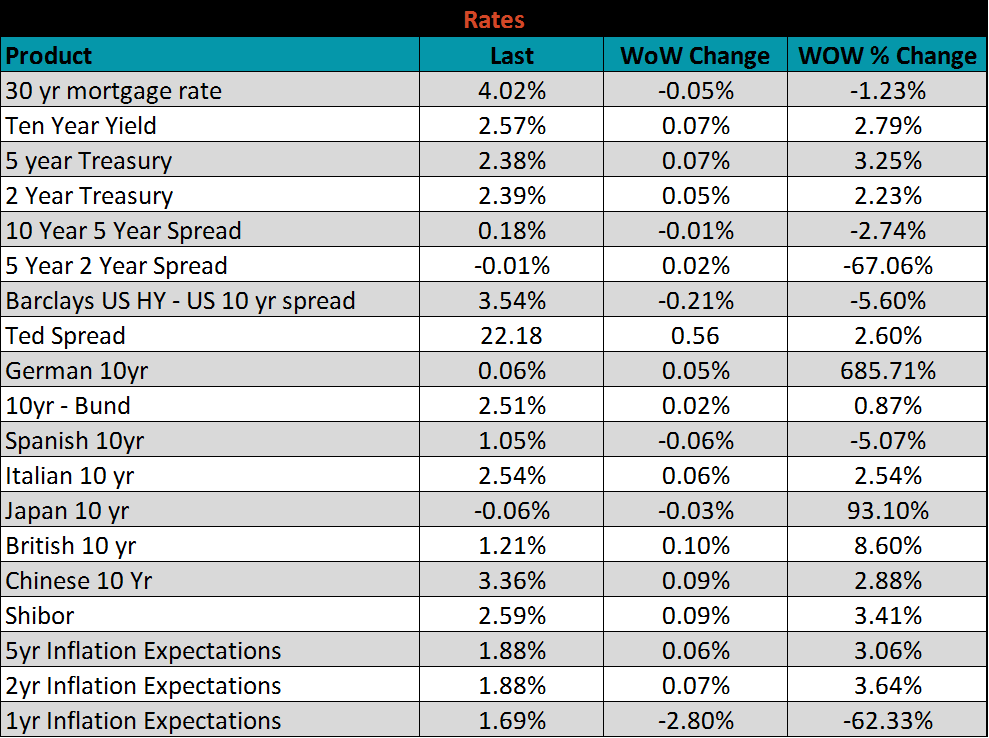
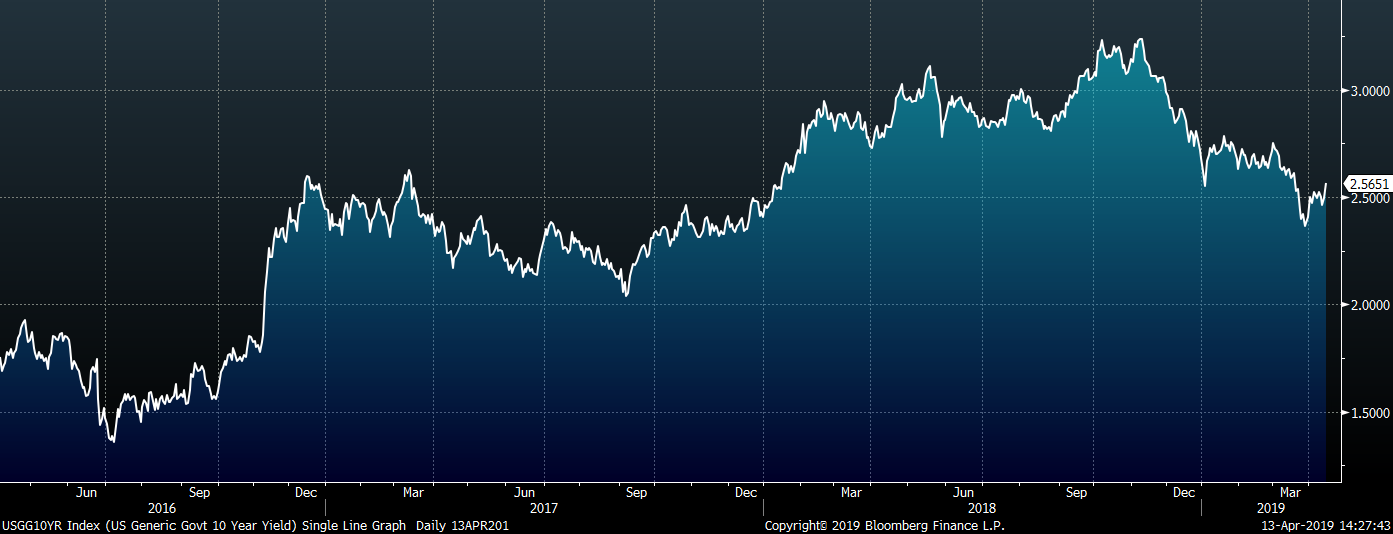
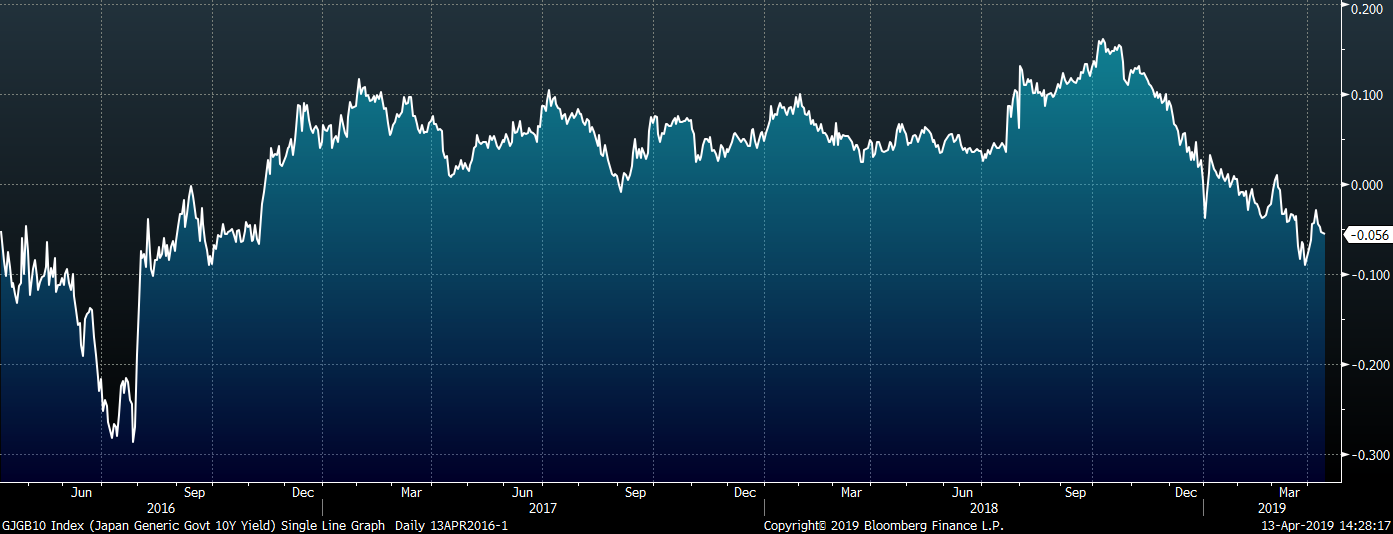
The U.S. 10-year treasury yield was up seven basis points closing the week at 2.57%. The German 10-year yield was up another five basis points to 0.06%, increasing its position above zero. The Japanese 10-year yield moved in the opposite direction, down three basis points to -0.06%. While recent data has subsided fears of an impending global recession, the ECB discussed a rate cut at its meeting last week to incentivize growth in Europe. This, along with recent comments from multiple members of the Federal Reserve suggest no further rate hikes this year. This “patient”, data-driven approach should stimulate liquidity in the economy allowing prices to move higher.
The list below details some upside and downside risks relevant to the steel industry. The orange ones are occurring or look to be highly likely. The upside risks look to be in control.
Upside Risks:
Downside Risks: