Content
-
Weekly Highlights
- Market Commentary
- Risks


After a few weeks of dislocation between tight physical market availability and a flat spot market, prices are finally catching up to sentiment and marching well above $1,400. As demand continues to build, more and more buyers are met with the reality that spot availability through the end of the year will be severely limited compared to recent years. With lead times firm at 9 weeks and current imports arriving at a slower pace than initially expected relief from the structural steel shortage does not appear to be in sight. This week, we will explore the systemic factors that led to this leg higher in prices for both spot tons and futures.
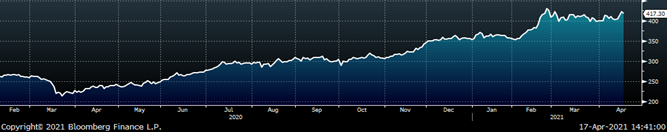
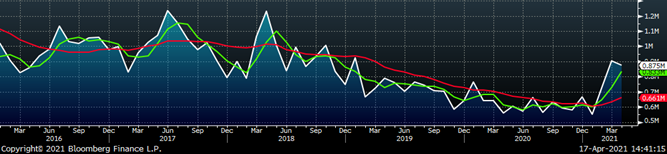
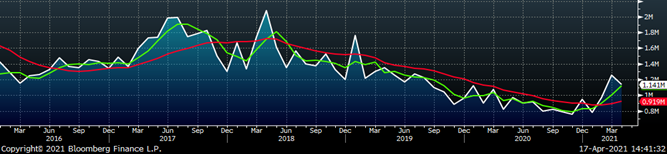
In the beginning of the rally, most analysts looked back and applauded steel mill’s ability to dramatically cut production to meet apparent demand in the Spring of 2020. As prices continued to climb through the end of the year, the supply shortage was constantly noted as the driver of the record prices. This type of singular focus left many with a perspective that an increase in supply would lead to a reversion to the mean, while ignoring what may have been (and continues to be) more important – demand. As this report has repeatedly noted, demand has far surpassed even estimates to the upside for manufactured goods, appliances, autos and housing. We believe a behavioral bias that results in price consolidation followed by jumps higher like we just witnessed are caused by industry watchers and participants holding too tightly to their previous playbooks. The chart below is the HRC Net Speculative position (in blue) and HRC open interest (in white).
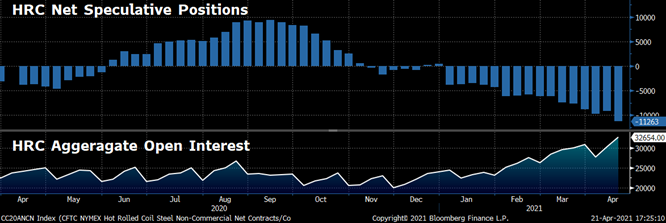
As mentioned in previous reports when speculators are net short, commercial participants are net long. To take it one step further, the open interest refers to the number of futures contracts that are open. As this number grows, it means firms are adding to their position (getting either longer or shorter). As the market currently stands, Open Interest is at its highest level, the Net Speculative position is as short as it has ever been, and this trend appears to have accelerated since the beginning of March. Looking back, this was a breakpoint. For months, prognosticators have been proposing the idea that imports would flood the market and prices would plummet.
This thinking also led to a significant drop in futures prices in mid-January based merely on a proposal for trade normalization with the E.U. (pushing 3Q21 prices below $800). The difference between now and then is that imports have in fact started to increase, supporting the first part of the thesis. However, anyone involved in the physical market will tell you this was also the point when the true strength of demand for steel in the U.S. was becoming clear, and buyers were jumping over each other for whatever was available. With everyone looking to call the peak, beware periods where price momentum stalls based on predictions of future supply, as they have proven to be buying opportunities over the course of the is rally due to continued growing demand. This market has shown how quickly prices can increase – if you are looking out at your company’s backlog and have customers willing to pay elevated prices for your goods, locking in margin now might be the most prudent decision you make in the next 18 months.
Below are the most pertinent upside and downside price risks:
Upside Risks:
Downside Risks:
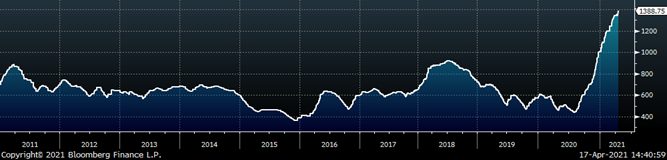
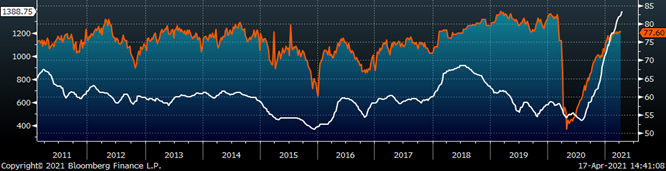
The Platts TSI Daily Midwest HRC Index increased by $37 to $1,388.75.
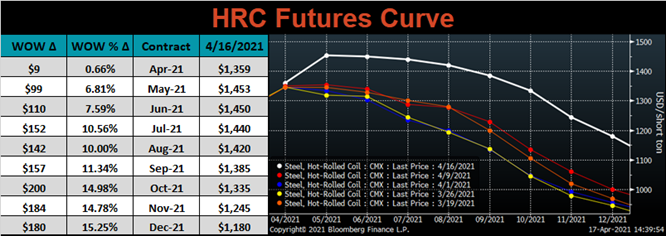
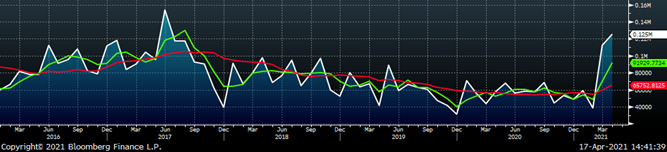
The CME Midwest HRC futures curve is below with last Friday’s settlements in white. Last week, the entire curve exploded higher, most significantly in the later expirations. The curve was strong all week as fears about the physical availability of steel through the end of the year are surfacing.
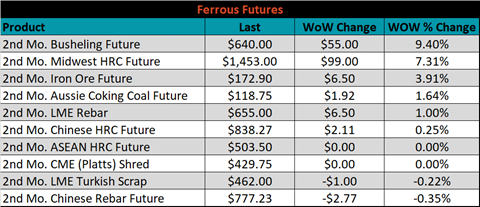
May ferrous futures were mixed. The busheling future gained 9.4%, while Chinese rebar lost 0.4%.
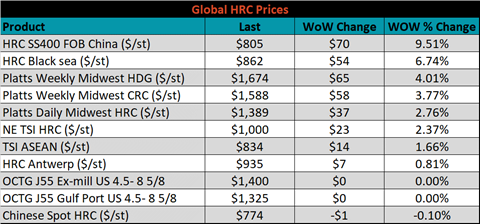
Global flat rolled indexes were all higher, led by Chinese export HRC, up 9.5%.
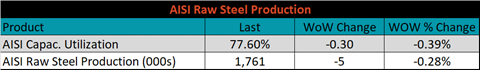
The AISI Capacity Utilization rate increased 0.3% to 77.9%.
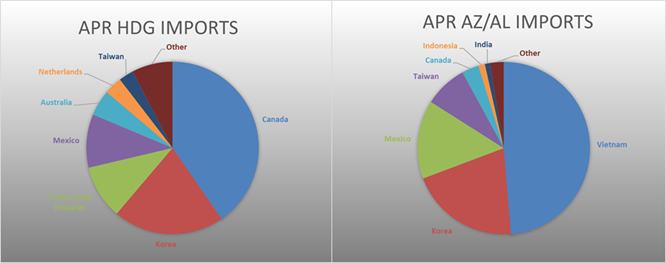
April flat rolled import license data is forecasting a decrease of 29k to 875k MoM.
Tube imports license data is forecasting a decrease of 90k to 266k in April.
April AZ/AL import license data is forecasting an increase of 13k to 125k.
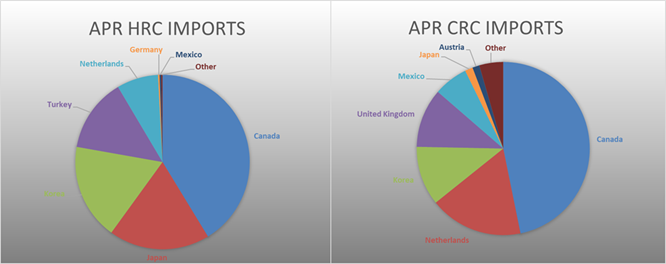
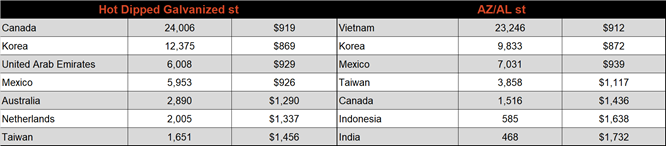
Below is April import license data through April 13, 2021.
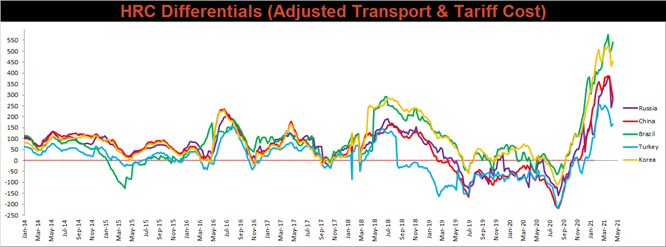
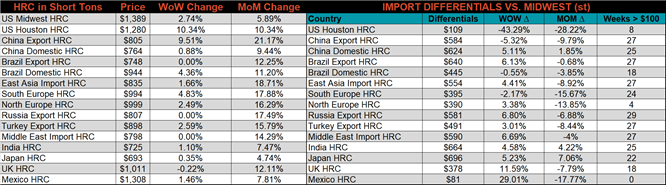
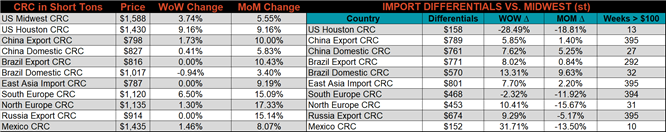
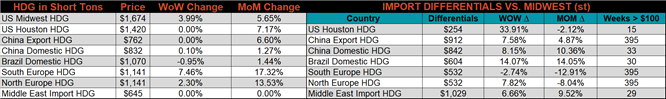
Below is the Midwest HRC price vs. each listed country’s export price using pricing from SBB Platts. We have adjusted each export price to include any tariff or transportation cost to get a comparable delivered price. All the watched differentials increased, except for the Chinese, as the U.S. price jumped higher at the end of the week. Even with the uptick, differentials are well below levels from 2 weeks ago.
SBB Platt’s HRC, CRC and HDG pricing is below. The Midwest HDG, CRC & HRC prices were up slightly, 4%, 3.7% and 2.7%, respectively. Globally, the Chinese export HRC price was up 9.5%.
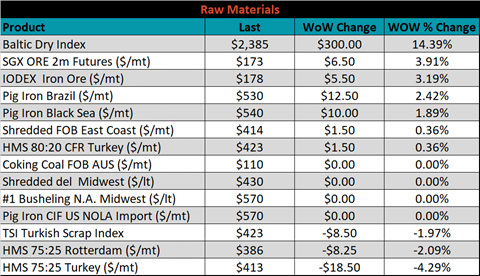
Raw material prices were mixed, May iron ore futures gained another 3.9% while Turkish HMS 75:25 was down 4.3%.
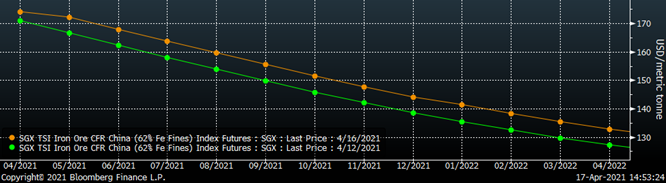
Below is the iron ore future curve with Friday’s settlements in orange, and the prior week’s settlements in green. Last week the curve shifted higher at all expirations.
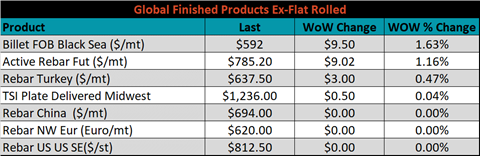
The ex-flat rolled prices are listed below.

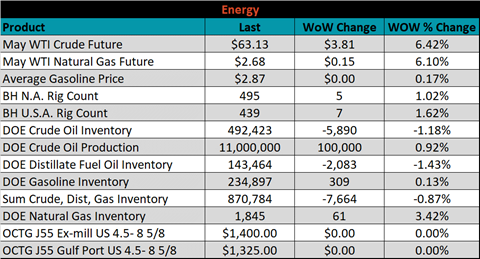
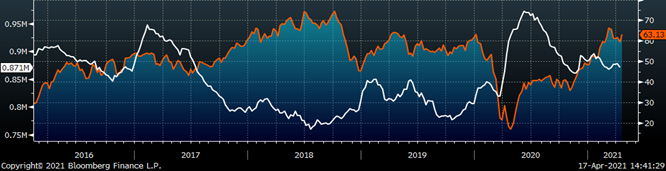
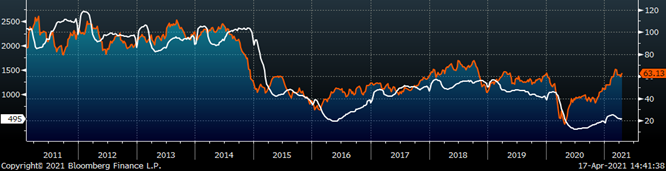
Last week, the May WTI crude oil future was up $3.81 or 6.4% to $63.13/bbl. The aggregate inventory level was down 0.9%, while crude oil production increased to 11m bbl/day. The Baker Hughes North American rig count was up 5 rigs, while the U.S. rig count was up another 7 rigs.
The list below details some upside and downside risks relevant to the steel industry. The orange ones are occurring or look to be highly likely. The upside risks look to be in control.
Upside Risks:
Downside Risks: