

April 2, 2021

Market Commentary
While last week did not result in a significant change in the spot price, there certainly was a renewed sense of panic forming as the steel market closes the book on the first quarter and updates the 2021 outlook. Since the beginning of the rally, analysts and commentators have raised frequent doubts about the longevity and sustainability of prices. Many of the break points have come and gone, and early indications suggest “Mills caught up by June” could be added to that growing list. The same issues that have led to this record rally remain intact with demand for steel far outpacing supply. This week, we will dive into the economic data that was released on April 1st.
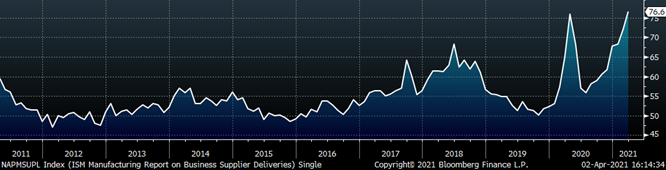
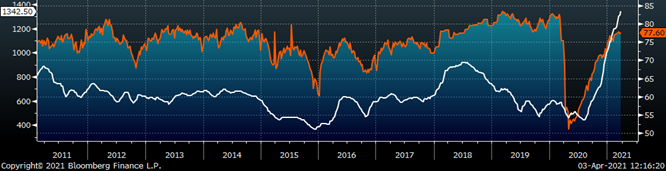
At the beginning of every month, a slew of economic data is released and digested, we at Flack tend to focus on Auto Sales, Construction Spending, and Manufacturing PMI’s (both U.S. and Global) to provide context for steel demand. The chart below is the Platts Midwest HRC index (white) and the ISM Manufacturing PMI (orange).
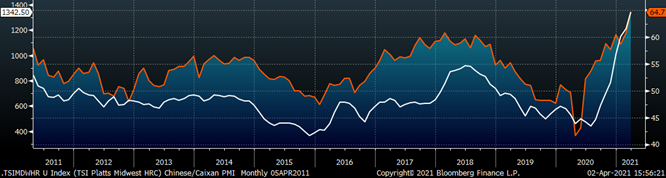
While headlines flashed the topline PMI number of 64.7, up 3.9 points, as the highest reading since December 1983, many failed to put this reading fully in context and could have underplayed its significance. The survey’s results come from asking manufacturers how their business is operating compared to last month. A reading above 60 is impressive regardless of a recent trend, but when the highest print in nearly four decades occurs after ten consecutive months of expansion, the translation to continued demand within the sector cannot be overstated. This report, along with the remaining global and domestic economic data (detailed below) on top of the continued tightening of inventories around the world lead us to believe that $1,400/ton, is the most likely next move for HRC.
ISM PMI
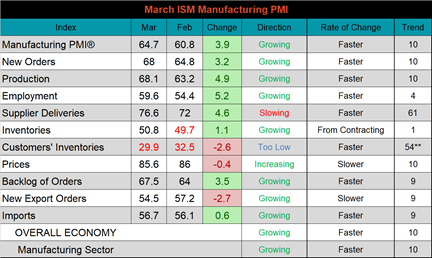
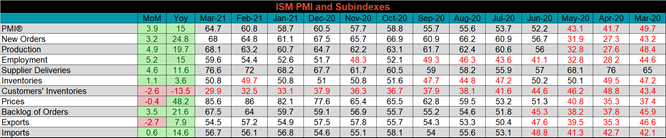
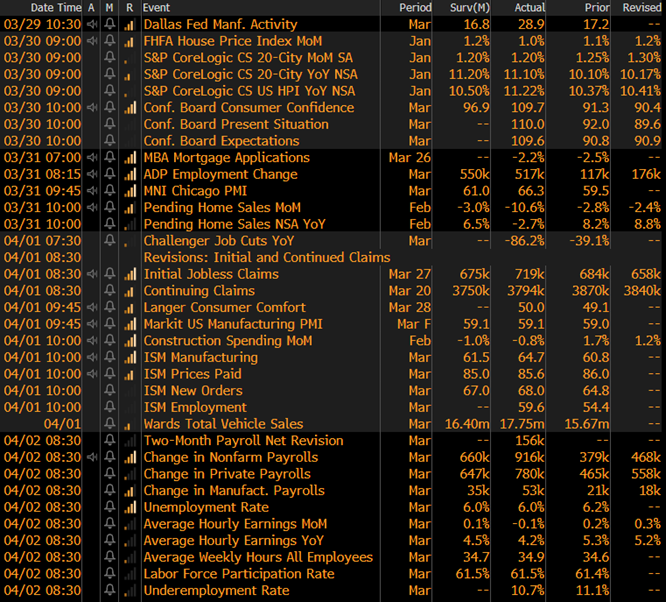
The March ISM Manufacturing PMI and subindexes are below.
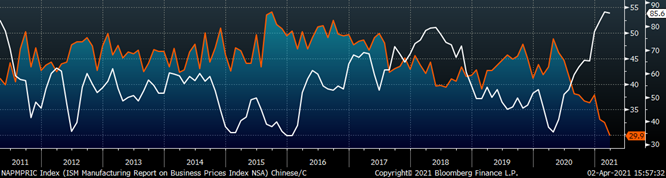
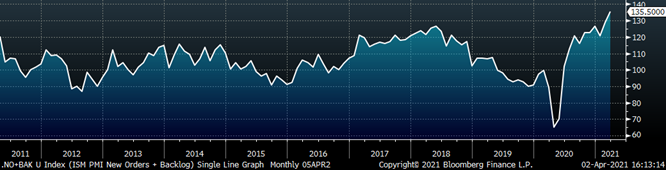
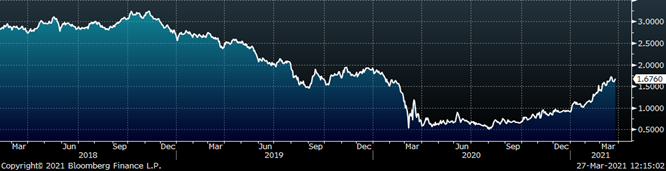
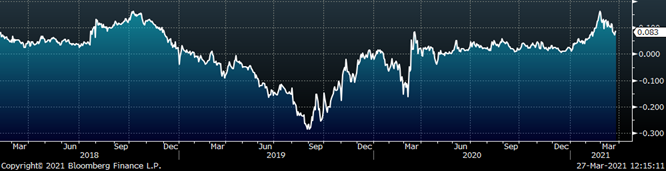
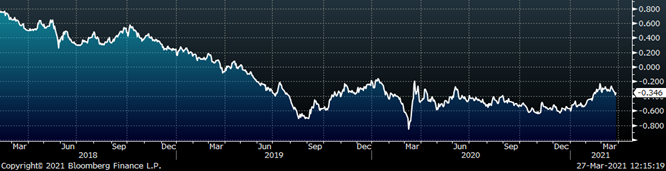
The chart below compares the ISM prices subindex with the ISM customer inventories subindex. Prices were slightly lower, while remaining extremely elevated and customer inventories printed their lowest reading since being included in the survey, in January 1997. The second chart shows the new orders plus backlog subindexes. Both subindexes were higher and new orders printed its highest reading since January 2004. The final chart shows supplier deliveries move above their recent April 2020 COVID-19 peak and printed their highest reading since April 1974.
ISM Manufacturing PMI Customer Inventories Subindex (orange) & Prices Subindex (white)
ISM Manufacturing PMI New Orders plus Backlog Subindexes
ISM Manufacturing Prices Subindex
Prices and Exports were down MoM and Customer Inventories were down both MoM and YoY. The remaining subindexes were all higher MoM and dramatically higher YoY, as March 2020 signified the first of three negative PMI prints caused by the COVID-19 pandemic.
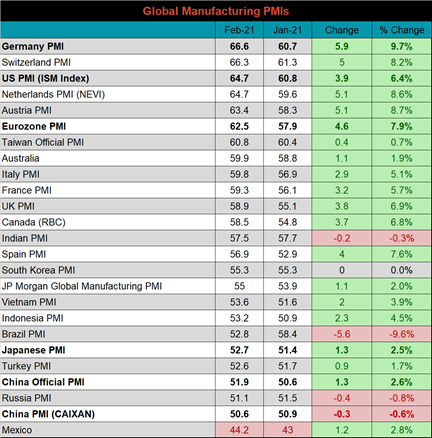
Global PMI
The March global PMI printings showed broad global strength. Mexico is the only watched country that remains in contraction (below 50) territory. The Indian, Brazilian, Chinese (CAIXAN) and Russian PMI’s were lower, while still expanding.
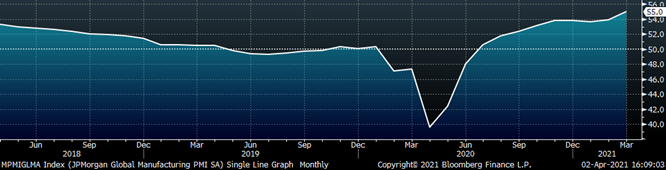
J.P. Morgan Global Manufacturing
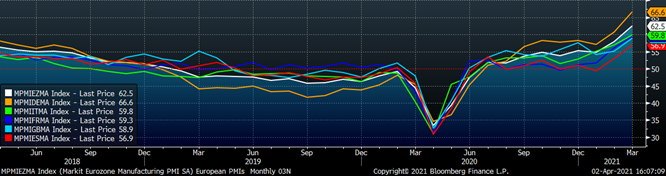
Eurozone (white), German (orange), Italian (green), Spanish (red), and French (blue), U.K. (teal) Manufacturing PMIs
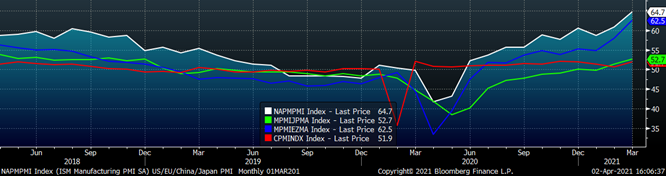
US (white), Euro (blue), Chinese (red) and Japanese (green) Manufacturing PMIs
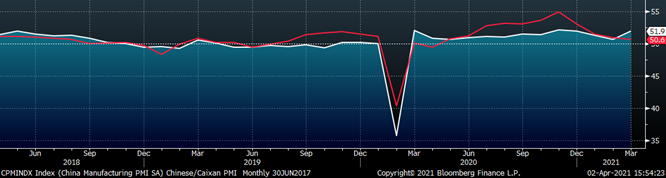
China’s official manufacturing PMI increased, while the Caixan PMI decreased. Both remain in expansion territory.
China Official (white) and Caixan (red) Manufacturing PMIs
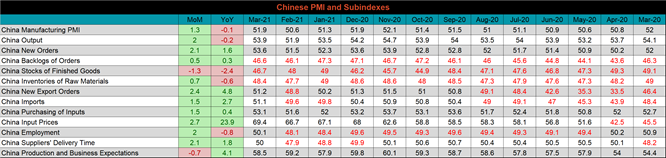
The table below breaks down China’s official manufacturing PMI subindexes, Input Prices, New Orders and Supplier Delivery Times were up the most significantly.
Construction Spending
February seasonally adjusted U.S. construction spending was down 0.8% compared to January, but 5.3% higher than a year ago.
February U.S. Construction Spending
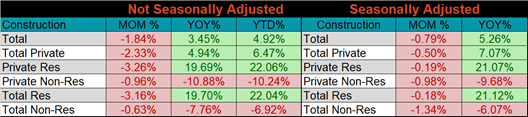
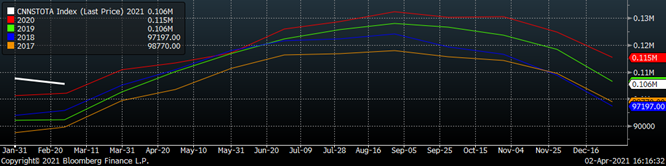
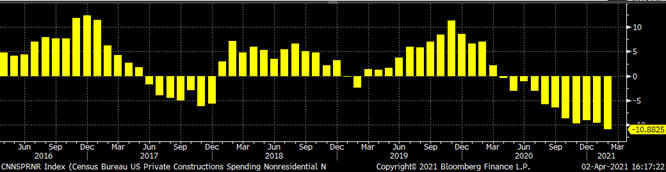
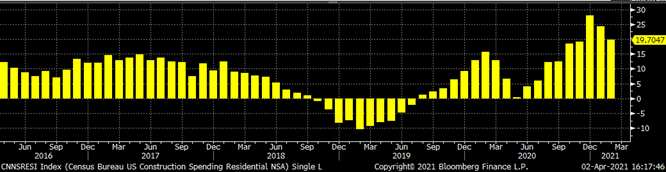
The white line in the chart below represents not seasonally adjusted construction spending in 2021 and compares it to the spending of the previous 4 years. Spending in February remains elevated compared to prior years, but not as significantly as last month. The last two charts show the YoY changes in construction spending. Private non-residential spending decreased further in February, for the eleventh month in a row. Residential spending remains significantly elevated compared to last year, but the growth rate compared to December and January appears to be decreasing.
U.S. Construction Spending
U.S. Private Nonresidential Construction Spending NSA YoY % Change
U.S. Residential Construction Spending NSA YoY % Change
Auto Sales
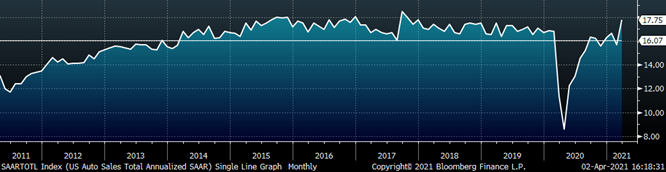
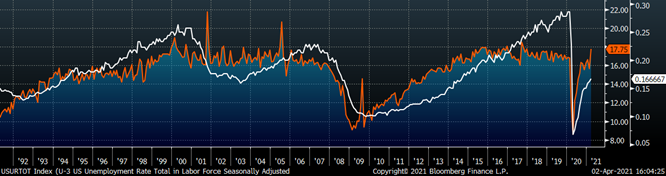
February U.S. light vehicle sales jumped to a 17.8m seasonally adjusted annualized rate (S.A.A.R). The second chart shows the relationship between the unemployment rate and auto sales. The unemployment rate is inverted to show that declining unemployment typically leads to increasing auto sales. The labor market continues to steadily recover, while auto sales moved significantly above their 10-year average.
March U.S. Auto Sales (S.A.A.R.)
March U.S. Auto Sales (orange) and the Inverted Unemployment Rate (white)
Risks
Below are the most pertinent upside and downside price risks:
Upside Risks:
- Higher share of discretionary income allocated to goods from steel intensive industries
- Strengthening global flat rolled and raw material prices
- Unplanned & extended planned outages
- Low current import levels
- Declining/low inventory levels at end users and service centers
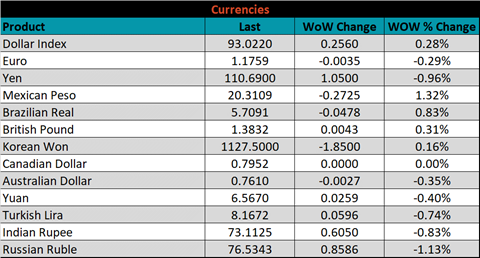
- Broad increases in commodity prices due to a weakening US Dollar
- Limited spot transactions skewing market indexes to extreme levels
Downside Risks:
- Increased domestic production capacity
- Increasing price differentials and hedging opportunities leading to higher imports
- Steel consumers substitute to lower cost alternatives
- Steel buyers and consumers “double ordering” to more than cover steel needs
- Weak labor and construction markets
- Tightening credit markets, as elevated prices push total costs to credit caps
- Reduction and/or removal of domestic trade barriers
- Supply chain disruptions allowing producers to catch up on orders
HRC Futures
All of the below data points are as of March 26, 2021
The Platts TSI Daily Midwest HRC Index increased by $0.50 to $1,343.
Platts TSI Daily Midwest HRC Index
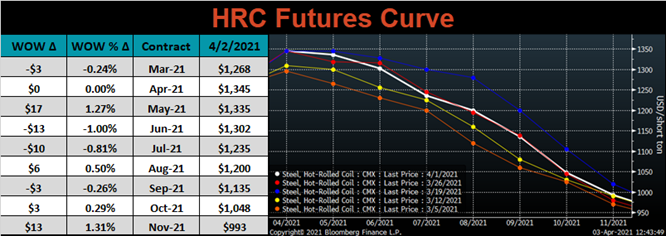
The CME Midwest HRC futures curve is below with last Friday’s settlements in white. Last week, there were no significant changes to the overall curve due to the slower, holiday market.
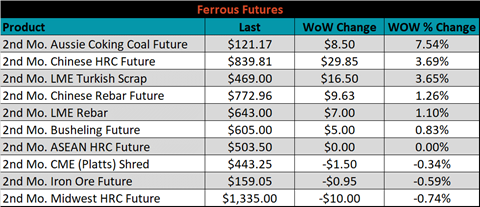
May ferrous futures were mixed. The Aussie coking coal future gained 7.5%, while Midwest HRC lost 0.7%.
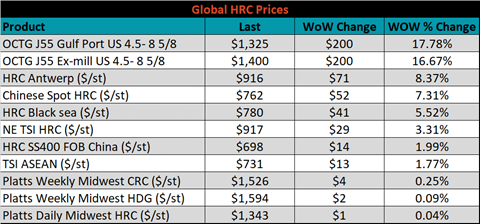
Global flat rolled indexes were all higher, led by Antwerp HRC, up another 8.4%.
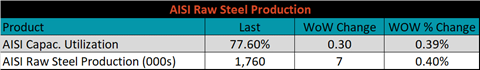
The AISI Capacity Utilization rate increased 0.3% to 77.6%.
AISI Steel Capacity Utilization Rate (orange) and TSI Daily HRC Price (white)
Imports & Differentials
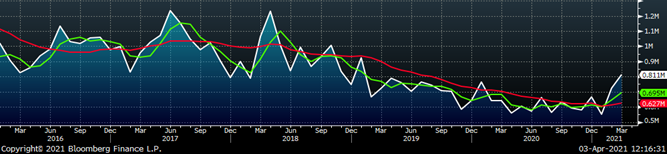
March flat rolled import license data is forecasting an increase of 90k to 811k MoM.
All Sheet Imports (white) w/ 3-Mo. (green) & 12-Mo. Moving Average (red)
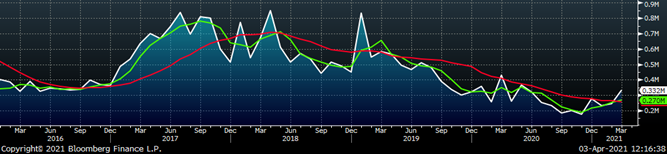
Tube imports license data is forecasting an increase of 86k to 332k in March.
All Tube Imports (white) w/ 3-Mo. (green) & 12-Mo. Moving Average (red)
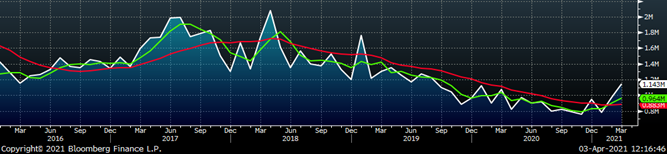
All Sheet plus Tube (white) w/ 3-Mo. (green) & 12-Mo. Moving Average (red)
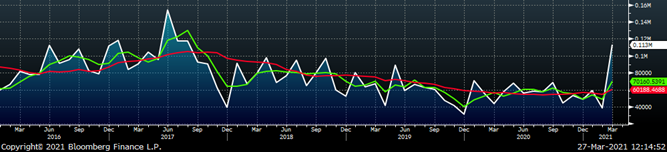
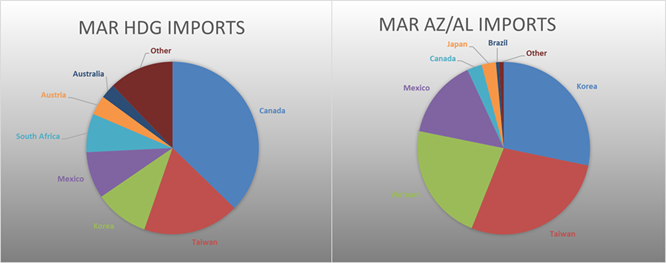
March AZ/AL import license data is forecasting an increase of 76k to 114k.
Galvalume Imports (white) w/ 3 Mo. (green) & 12 Mo. Moving Average (red)
Below is March import license data through March 30, 2021.
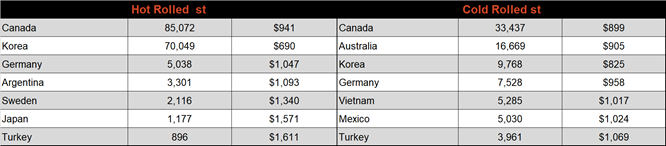
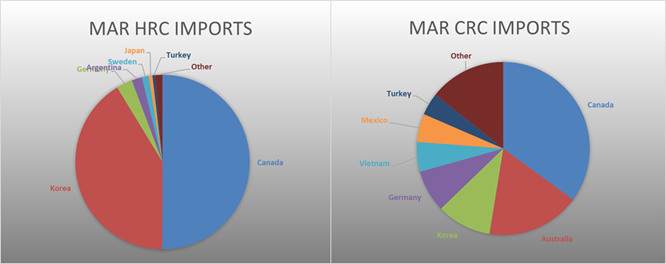
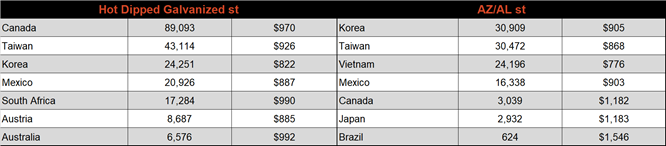
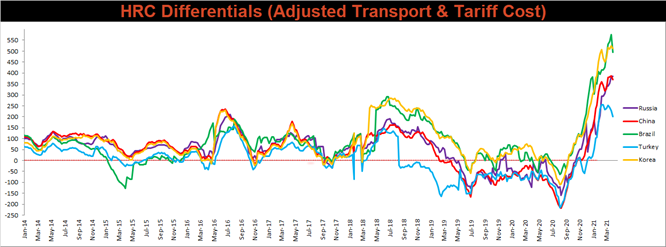
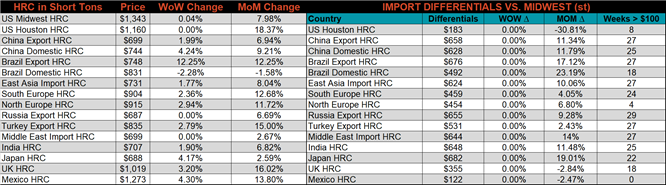
Below is the Midwest HRC price vs. each listed country’s export price using pricing from SBB Platts. We have adjusted each export price to include any tariff or transportation cost to get a comparable delivered price. All the watched differentials decreased, except for the Russian, as their respective export prices increased compared to a flat U.S. price.
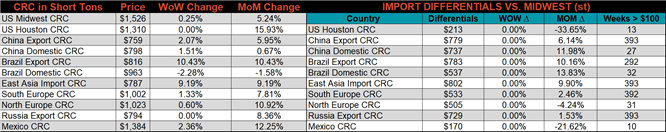
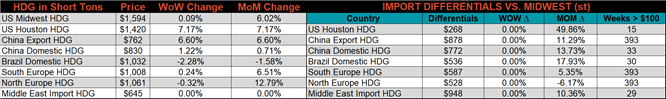
SBB Platt’s HRC, CRC and HDG pricing is below. The Midwest CRC, HDG & HRC prices were up slightly, 0.3%, 0.1% and 0.04%, respectively. Globally, the Brazilian HRC export price was up 12.3%.
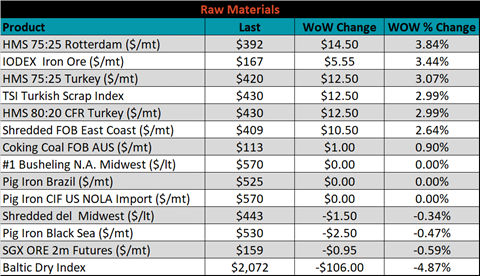
Raw Materials
Raw material prices were mixed, Rotterdam HMS up 3.8%, while the May iron ore future lost 0.6%.
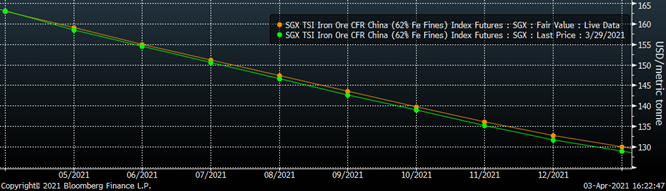
Below is the iron ore future curve with Friday’s settlements in orange, and the prior week’s settlements in green. Last week the curve shifted slightly higher in the later expirations, while it was flat in the front.
SGX Iron Ore Futures Curve
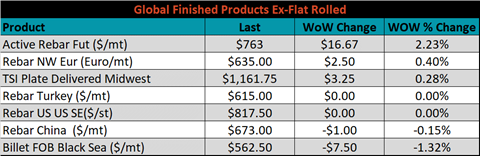
The ex-flat rolled prices are listed below.

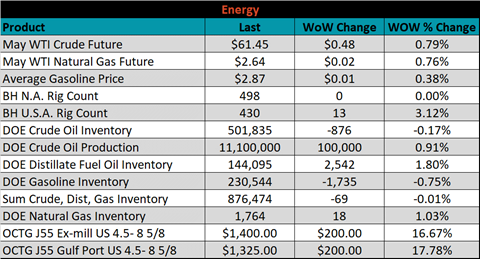
Energy
Last week, the May WTI crude oil future was up $0.48 or 0.79% to $61.45/bbl. The aggregate inventory level was flat, while crude oil production increased to 11.1m bbl/day. The Baker Hughes North American rig count was unchanged, while the U.S. rig count was up another 13 rigs.
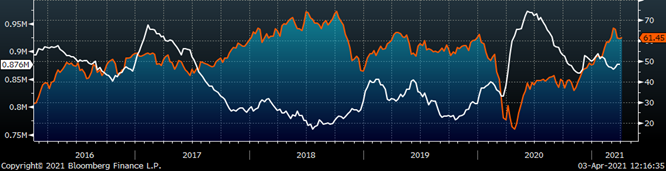
May WTI Crude Oil Futures (orange) vs. Aggregate Energy Inventory (white)
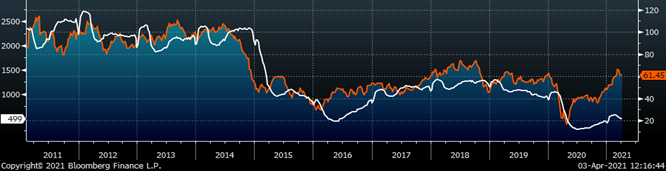
Front Month WTI Crude Oil Future (orange) and Baker Hughes N.A. Rig Count (white)
The list below details some upside and downside risks relevant to the steel industry. The orange ones are occurring or look to be highly likely. The upside risks look to be in control.
Upside Risks:
- Higher share of discretionary income allocated to goods from steel intensive industries
- Changes in China’s policies regarding ferrous markets, including production cuts and imports
- Strengthening global flat rolled and raw material prices
- Unplanned & extended planned outages, including operational issues leaving mills behind
- Declining/low inventory levels at end users and service centers
- Broad increases in commodity prices due to a weakening US Dollar
- Limited spot transactions skewing market indexes to extreme levels
- Chinese economic stimulus measures
- Fiscal policy measures including a new stimulus and/or infrastructure package
- Low interest rates
- China strict steel capacity cuts
- Energy industry rebound
- Unexpected inflation
- Further section 232 tariffs and quotas restricting supply
Downside Risks:
- Increased domestic production capacity
- Increasing price differentials and hedging opportunities leading to higher imports
- Steel consumers substitute to lower cost alternatives
- Steel buyers and consumers “double ordering” to more than cover steel needs
- Weak labor and construction markets
- Tightening credit markets, as elevated prices push total costs to credit caps
- Reduction and/or removal of domestic trade barriers
- Supply chain disruptions allowing producers to catch up on orders
- Political & geopolitical uncertainty
- Weak global economics/PMIs
- Trade slowdown in China due to tensions with US, Hong Kong, and others
- Domestic automotive industry under pressure
- Chinese restrictions in property market
- The Chinese Financial Crisis
- Unexpected sharp China RMB devaluation