Content
-
Weekly Highlights
- Market Commentary
- Upside & Downside Risks


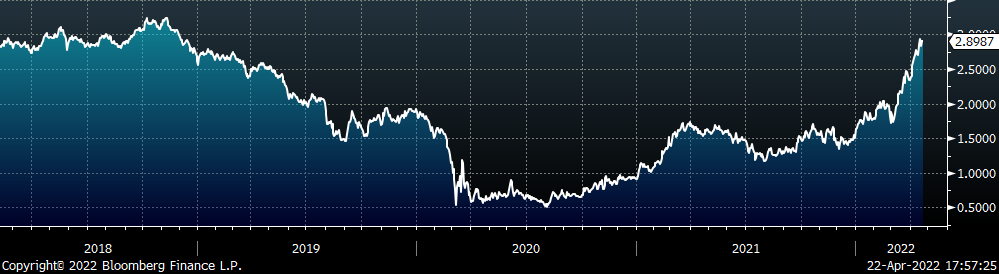
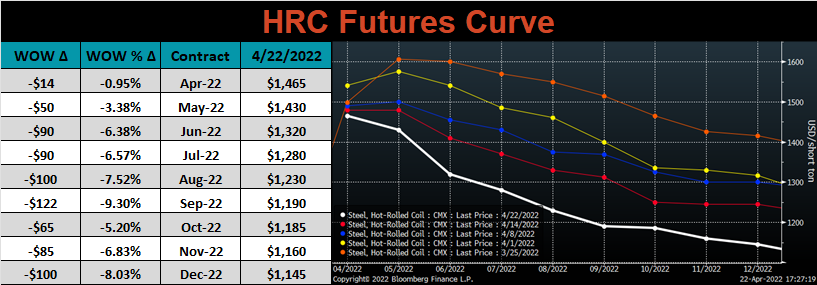
With steel spot prices plateauing over the last three weeks, and the forward curve selling off hard, now is a good time to take a step back and make sense of what has happened in the domestic steel market and what risks are on the horizon. To best illustrate this with proper context, we will look at the futures curves below from February 11th (orange), March 11th (green), and last Friday (white).
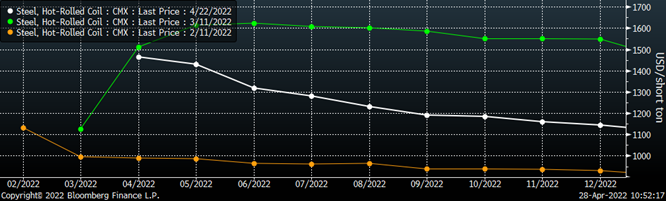
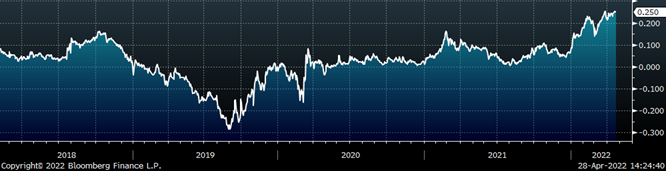
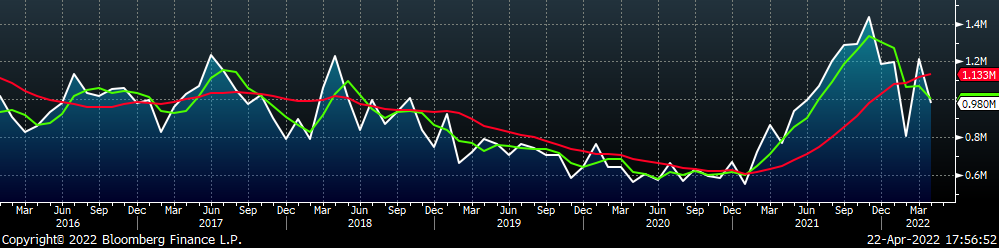
Before and after the Russian invasion the forward curve in both instances were flat, shifting from ~$900 per ton, up to $1,600 per ton in a matter of weeks. The curve in March marks a period of significant uncertainty and a move away from the fundamentals. Turning to now, the initial fear of prolonged raw material and finished product shortages has become less likely, which lead to the sell-off in the back of the futures curve. As we frequently mentioned during the 2020-2021 rally, it is important to remember that the forward curve is not a predictor of price. While the downside risks in the market have become more significant at the current elevated levels, a backwardated forward curve indicates premium value for material today compared to material in the future. So, now that the market has settled, it is time to start looking at the fundamentals, again. This week, we will look at the import market, where the chart below shows sheet imports starting in 2017.
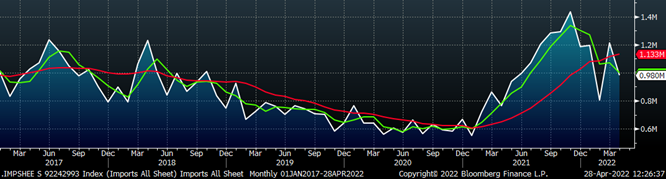
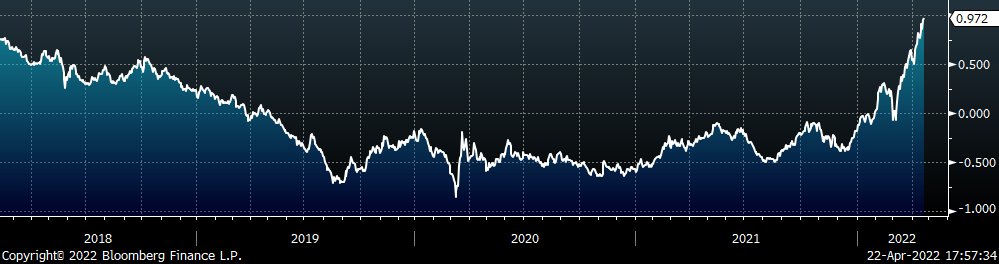
After a recent low level of sheet imports arrived in February, they appear to have rebounded with March and April projected at 1.2M, and 980k short tons, respectively. Intuitively, steady arrivals at these levels will keep domestic prices in check. However, expectations around lower prices because of increased imports need to be remain line with what the data is telling us. The chart below shows the relationship between the Midwest and Houston HRC prices, where the Houston price is used as a delivered import price.
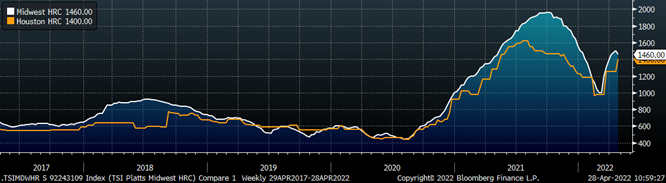
While the historical dataset for Houston prices is limited compared to Midwest HRC prices, and it does not update on a weekly basis, it has set a reliable floor over the last couple of years, and last week, the Houston price increased to $1,400. Compared to this time last year when the Midwest price was at a similar level to what it is today, there have been higher sustained levels of imports and domestic production over the last 6 months. In our view, this is a clear indication of strong demand within the steel consuming sectors of the U.S. domestic market. If you are waiting for prices to fall to place orders for material you need in the next couple of months, you are taking on an outsized upside risk. Rather than waiting to buy lower spot prices which may never come, the sell-off in the forward market is already offering a sharp discount to current prices that are available in the physical market. It is time to start revisiting the playbook from the 2020-2021 rally that proved to be successful for so many of our customers.
Below are the most pertinent upside and downside price risks:
Upside Risks:
Downside Risks:
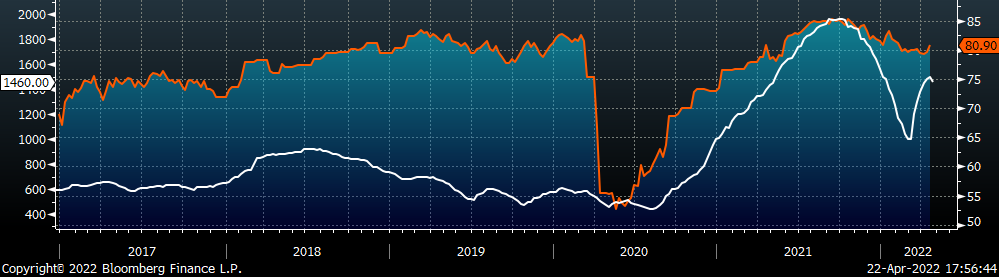
The Platts TSI Daily Midwest HRC Index was down $40 to $1,460. This marks the first week the index was lower in 7 weeks.
The CME Midwest HRC futures curve is below with last Friday’s settlements in white. The entire curve sold off again, for the 5th week in a row.
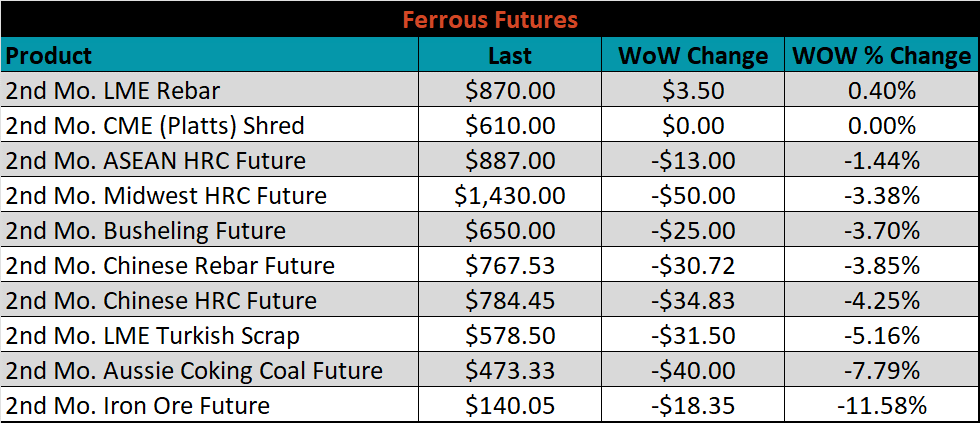
May ferrous futures were mostly lower, led by iron ore, which lost 11.6%.
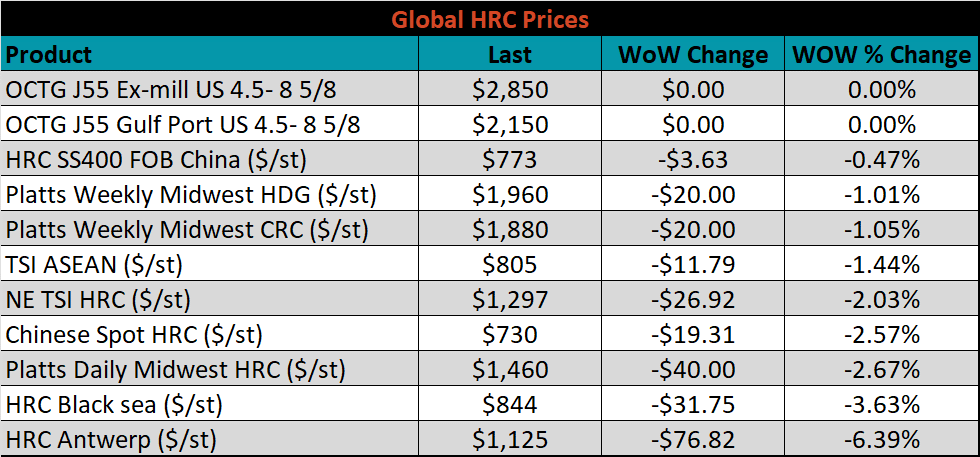
Global flat rolled indexes were all lower, led by Antwerp HRC, down 6.4%.
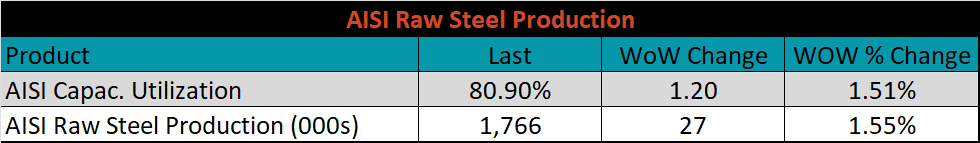
The AISI Capacity Utilization was up 1.2% to 80.9%.
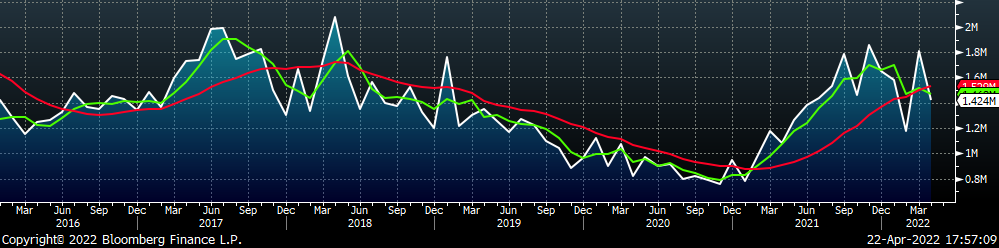
April flat rolled import license data is forecasting a decrease of 233k to 980k MoM.
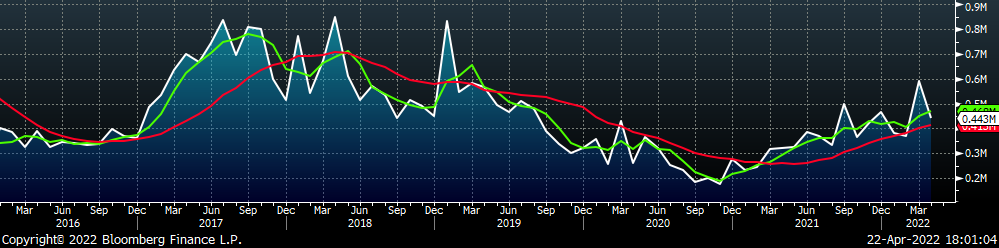
Tube imports license data is forecasting a decrease of 149k to 433k in April.
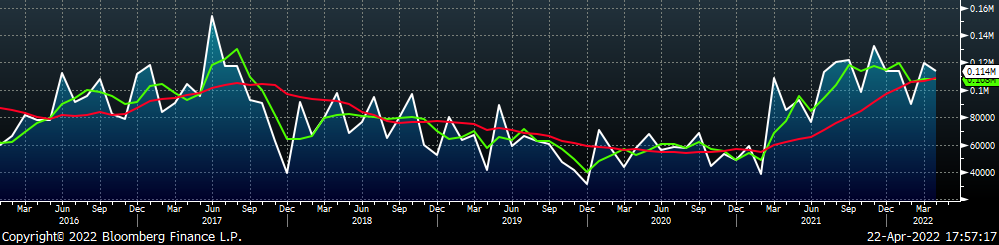
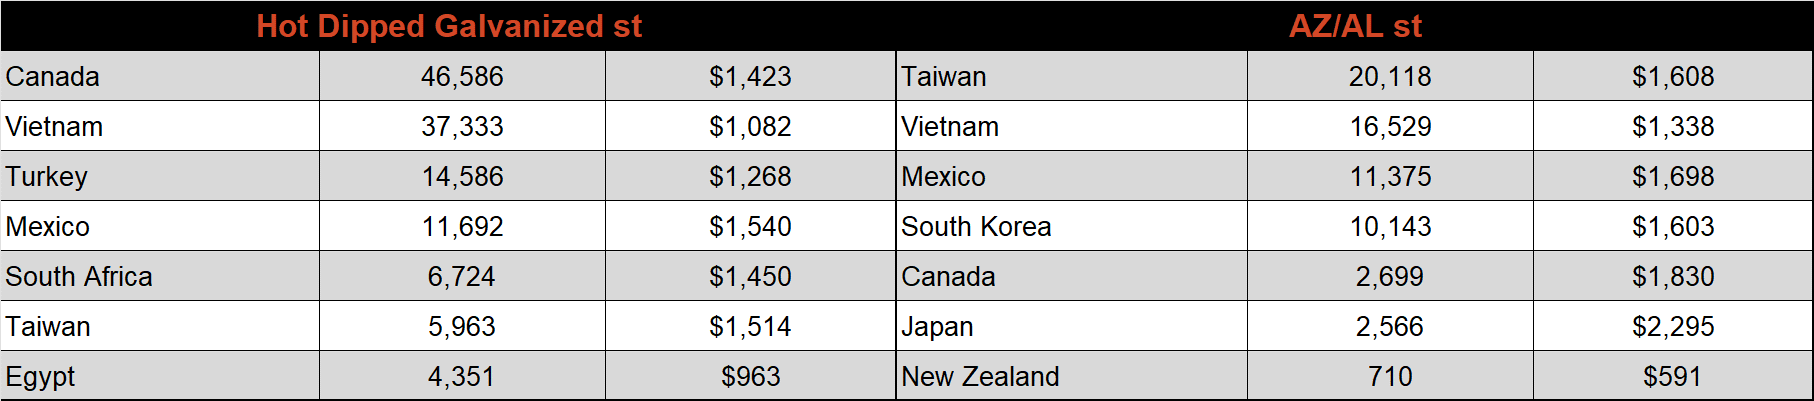
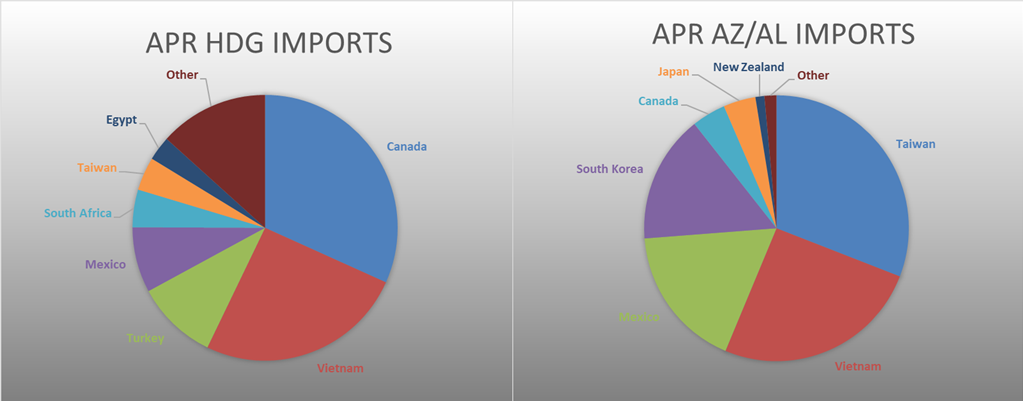
April AZ/AL import license data is forecasting a decrease of 6k to 114k.
Below is April import license data through April 18th, 2022.
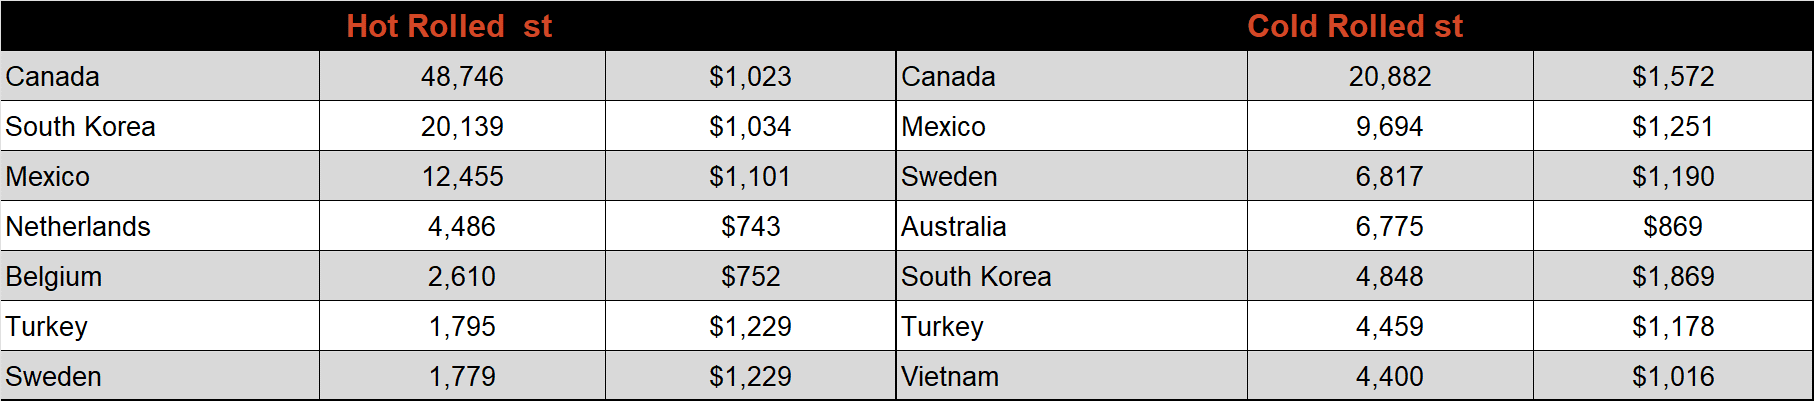
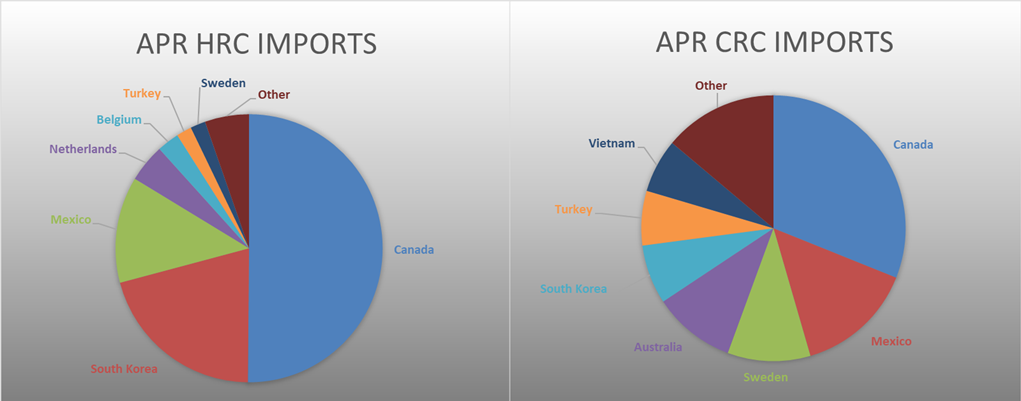
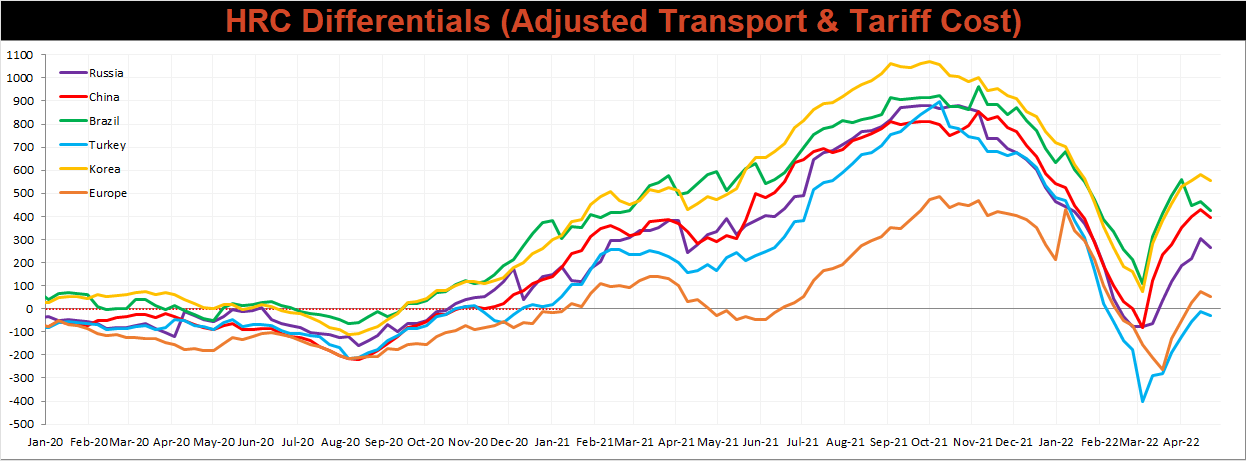
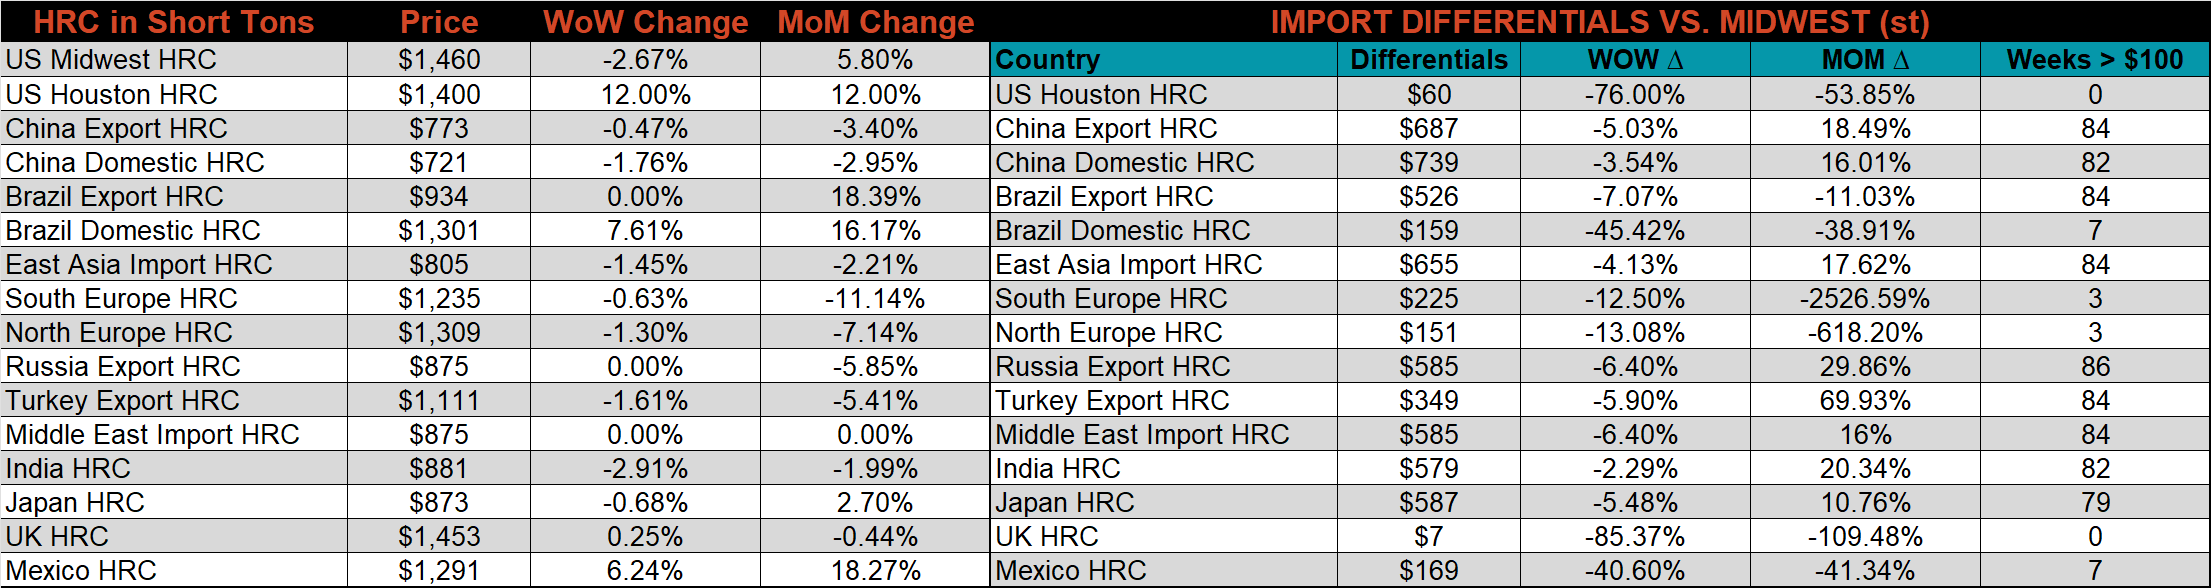
Below is the Midwest HRC price vs. each listed country’s export price using pricing from SBB Platts. We have adjusted each export price to include any tariff or transportation cost to get a comparable delivered price. Global differentials decreased across the board this week, as the U.S. price was down more significantly than the rest of the world.
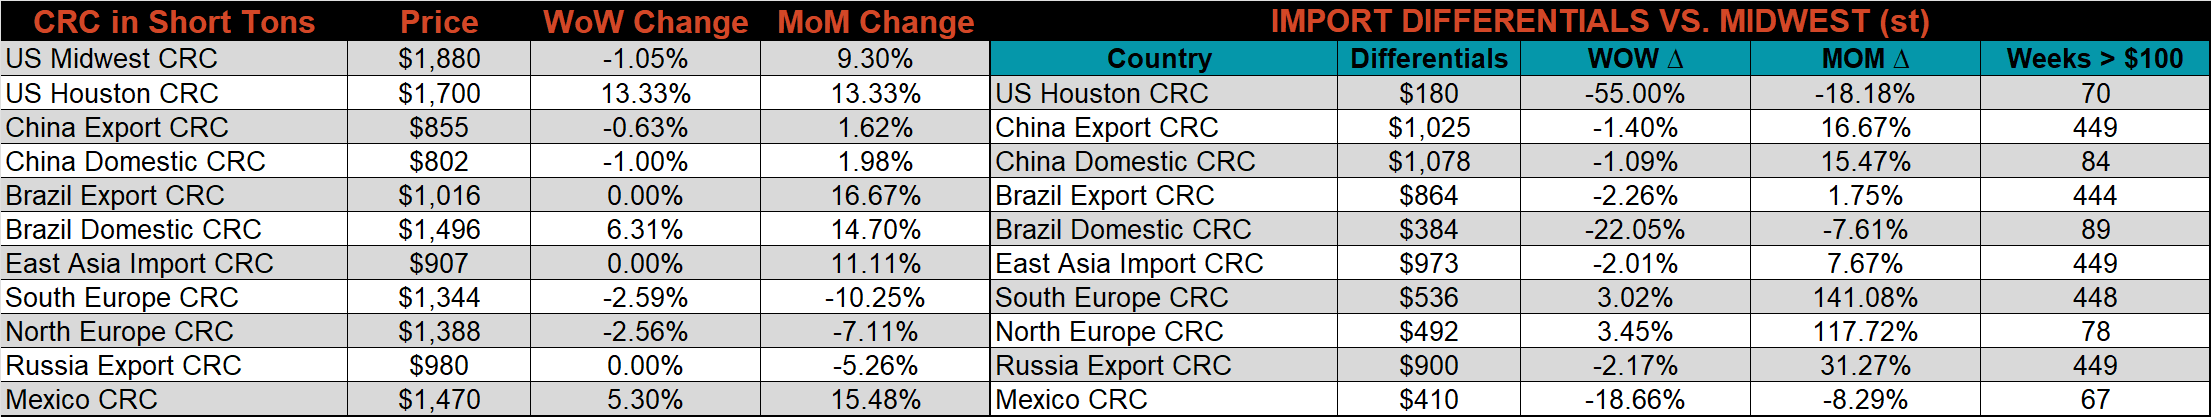
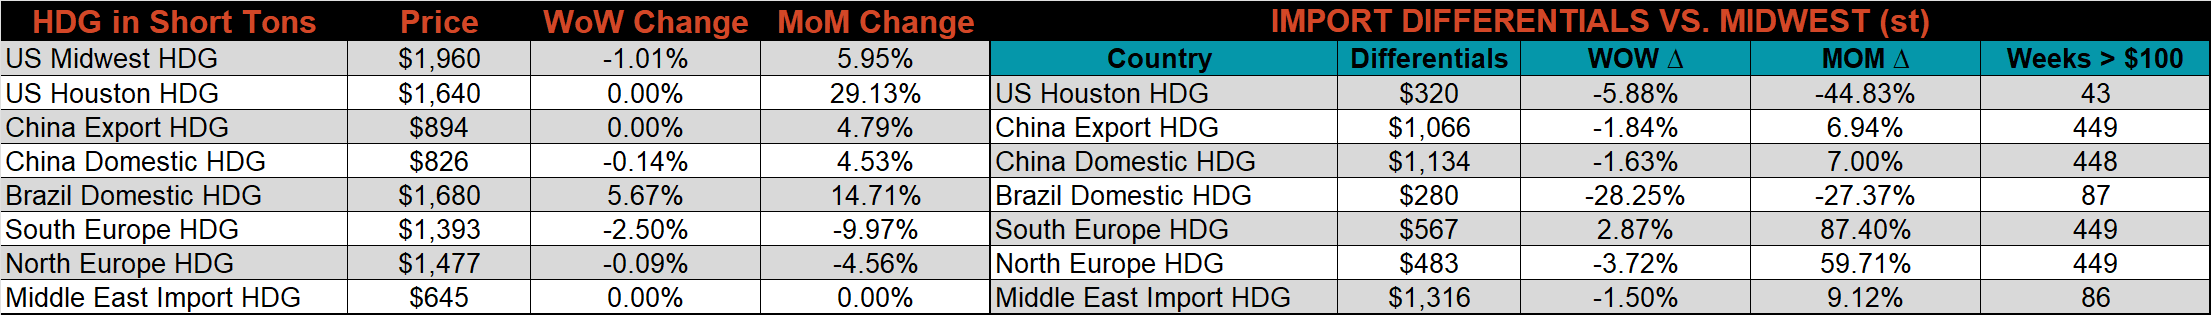
SBB Platt’s HRC, CRC and HDG pricing is below. The Midwest HRC, CRC, & HDG prices were down 2.7%, 1.1%, and 1%, respectively. Outside of the U.S., the Brazil domestic HRC price was up the most, 7.6%.
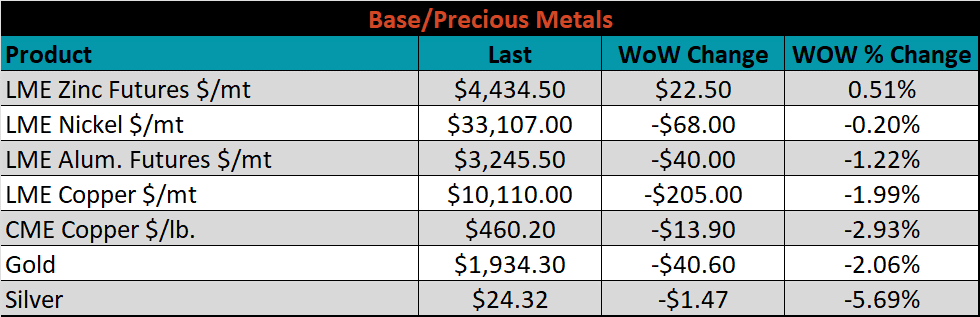
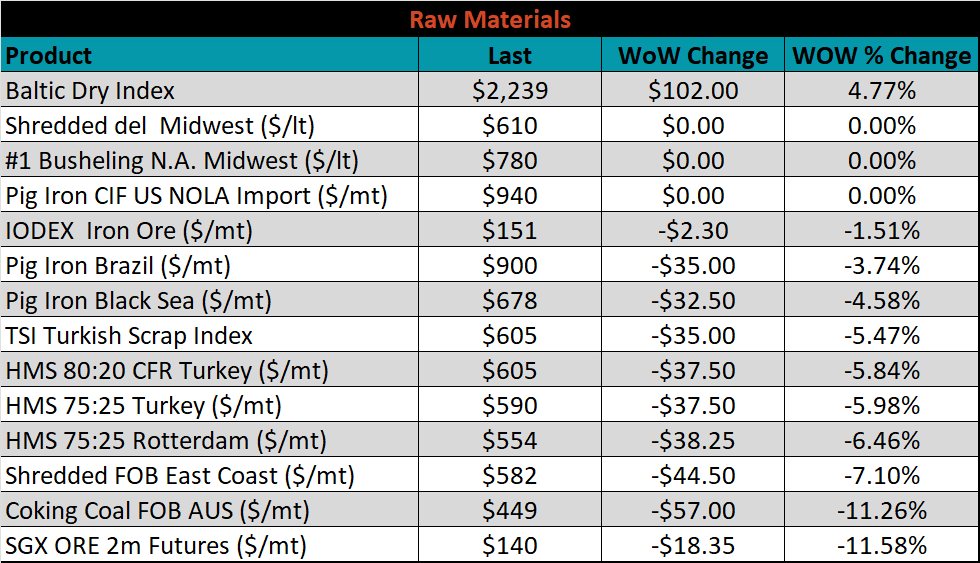
Raw material prices were mostly lower, led by May iron ore futures, down 11.6%, while the Baltic Dry Index was up 4.8%.
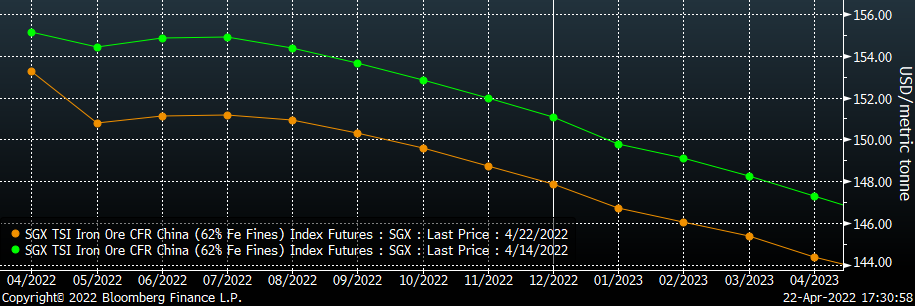
Below is the iron ore future curve with Friday’s settlements in orange, and the prior week’s settlements in green. Last week, the entire curve shifted lower at all expirations, most significantly in May 2022.
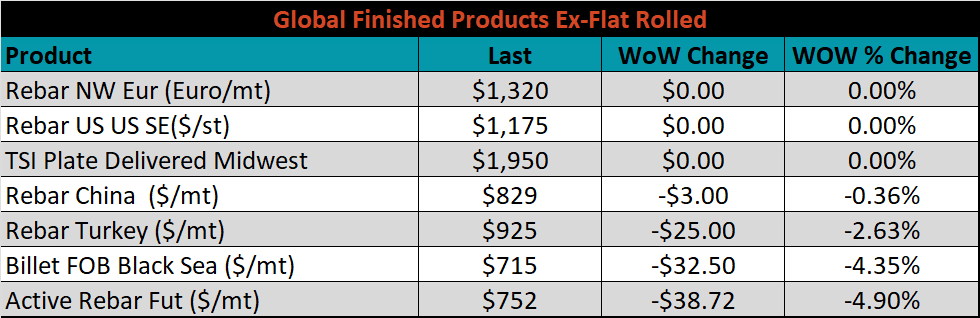
The ex-flat rolled prices are listed below.

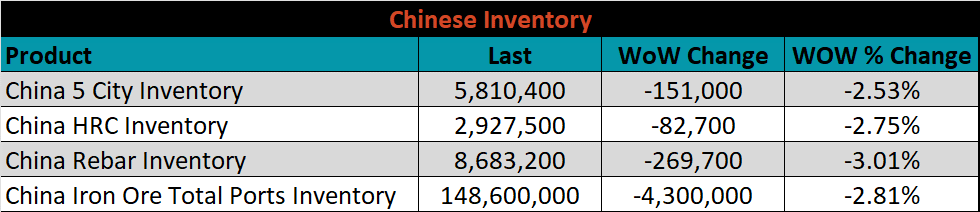
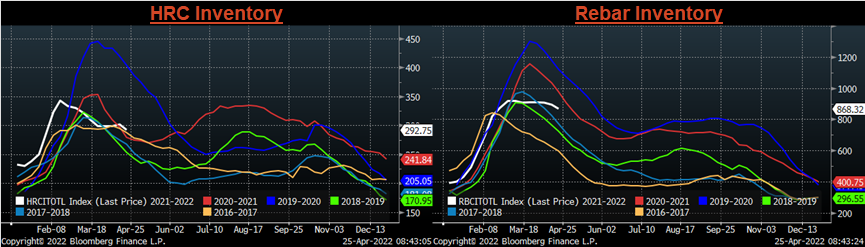
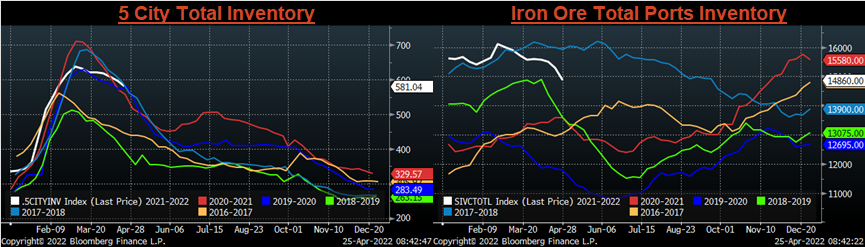
Below are inventory levels for Chinese finished steel products and iron ore. Inventories drew down at each of the four watched categories. At this point of the year, inventories are at the higher end of the range, which could be in part due to the economic slowdown in China. Stocking Russian material?
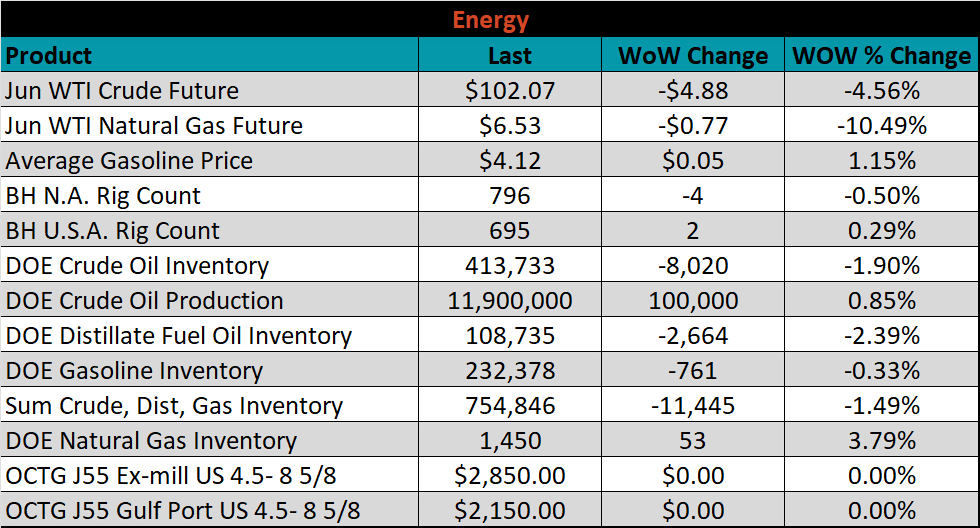
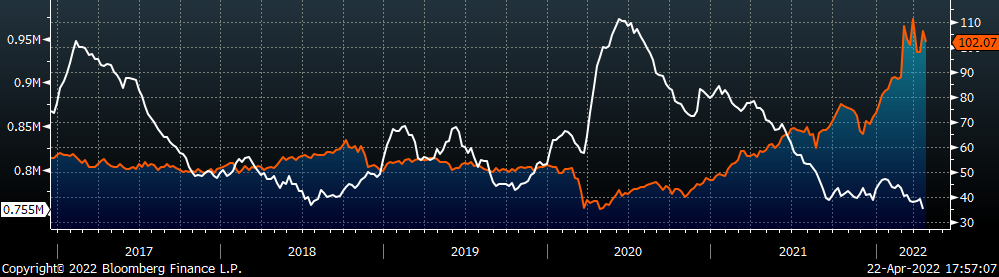
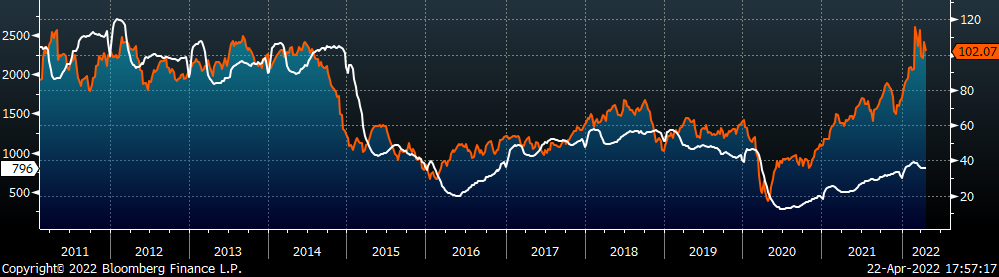
Last week, the June WTI crude oil future lost $4.88 or 4.6% to $102.07/bbl. The aggregate inventory level was up 1.5% and crude oil production increased to 11.9m bbl/day. The Baker Hughes North American rig count was down 4 rigs, while the U.S. rig count was up another 2.
The list below details some upside and downside risks relevant to the steel industry. The bolded ones are occurring or highly likely.
Upside Risks:
Downside Risks: