Content
-
Weekly Highlights
- Market Commentary
- Upside & Downside Risks


With prices peaking and signaling a roll over in the physical market, there are two questions that must remain top of mind to take full advantage of lower prices without being complacent:
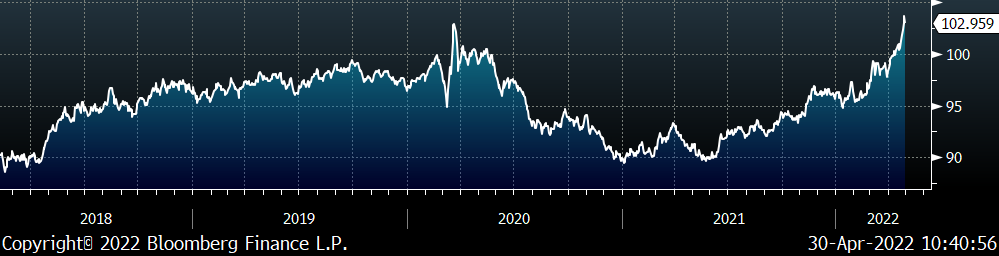
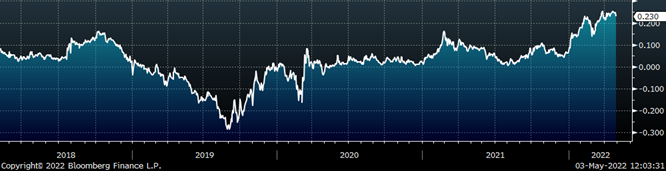
For the first question, we turn to the graph below, which shows the spread between the TSI Platts Midwest HDG price and the TSI Platts Midwest HRC price going back to 2014. The dashed green line represents the historical average before and after the peak of the most recent rally, $233, and $474, respectively.
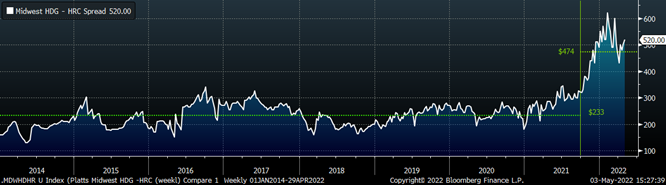
What is most interesting about this chart is the fact that while prices were constantly reaching new record highs in the spot market, the spread between HDG and HRC did not set a record until the end of June, when HRC was $1,750. A few months later, once steel prices were falling, we entered a period where HRC prices fell far more severely than HDG or CRC and that spread expanded to historic levels. From the previous peak in September to today, the real cost to convert HRC into a tandem product has not meaningfully increased. Therefore, we interpret the historically elevated spread over the last 7 months as an indication of stable demand in value-added products, throughout the downside move. The major difference between then and now is that inventories from steel consumers are lower than they were in the beginning of this year when the spread was its widest. Today, buyers appear to be on the sidelines as spot prices drift lower, however, the market should be cautious of assuming prices will continue to fall for a prolonged period when there does not appear to be enough material on hand for a full-on buyer’s strike.
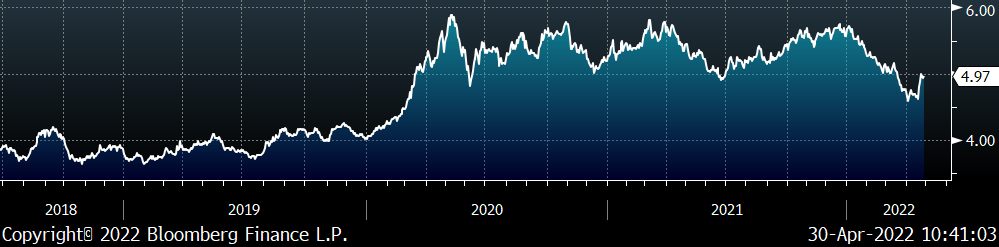
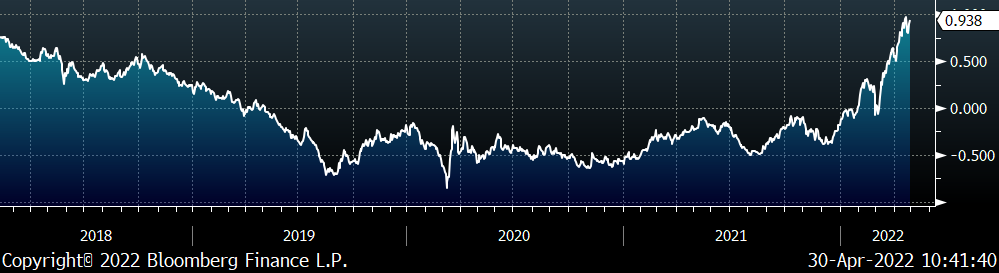
Moving on to the second question, the dramatic pace of the 50% rebound from March to April was driven by input cost concerns, and those have not been entirely resolved. The chart below is an updated look since it was published in the March 18th report, with the front month Busheling Future (white), Pig Iron delivered to New Orleans (blue), and Midwest shredded scrap (green).
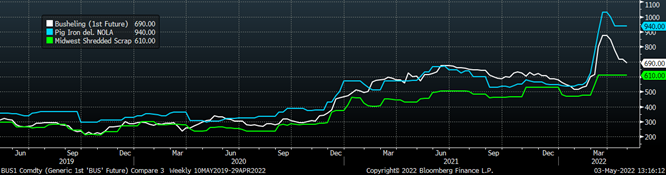
Prices have softened since the last time we looked at this chart, however, each of them remains above pre-invasion levels which effectively raises the floor for HRC prices. Even if they continue to decline, there have been significant supply disruption/logistics issues linked to moving these raw materials from where they are to where they need to be. The current HRC curve is pricing in a rapid normalization of raw materials which has yet to materialize. Significant upside risks to that scenario are both further disruption in these markets and global demand continuing to increase for raw materials as China implements broad changes to the environmental impact of its steel industry. Backwardation in the curve presents an opportunity to hedge that risk by fixing your steel price for future tons at a sharp discount to current spot levels.
Below are the most pertinent upside and downside price risks:
Upside Risks:
Downside Risks:
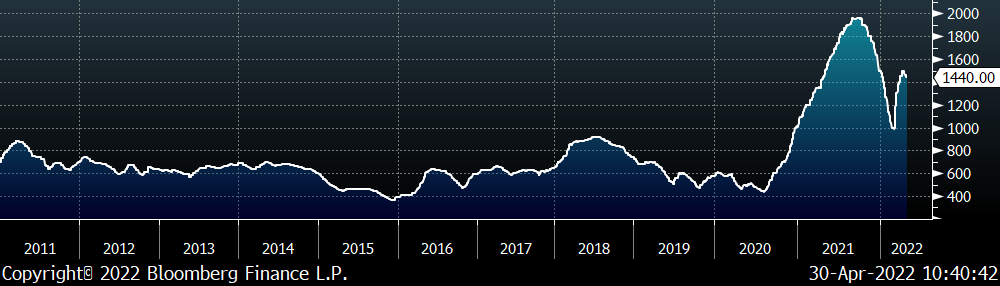
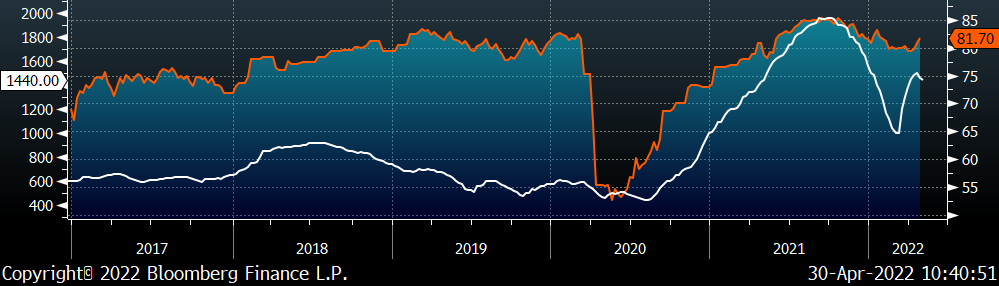
The Platts TSI Daily Midwest HRC Index was down another $20 to $1,440.
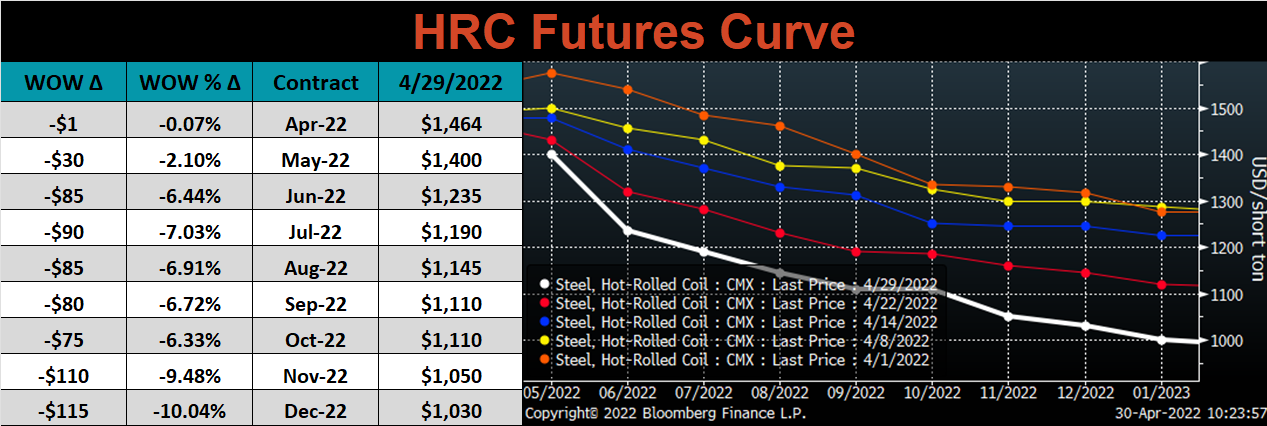
The CME Midwest HRC futures curve is below with last Friday’s settlements in white. The entire curve sold off again, for the 6th week in a row, most significantly in the later expirations.
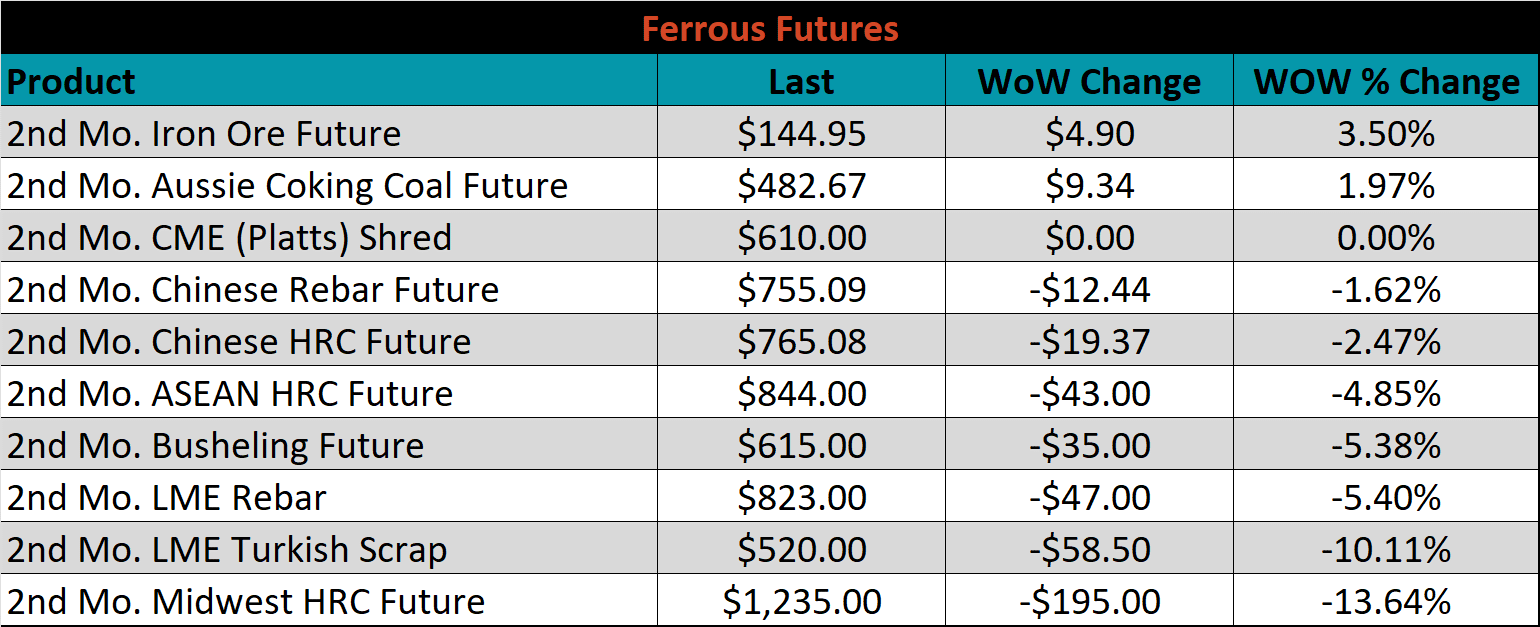
This was the week that the futures month rolled over from May into June. June ferrous futures were mostly lower, led by Midwest HRC, which lost 13.6%, while iron ore gained 3.5%.
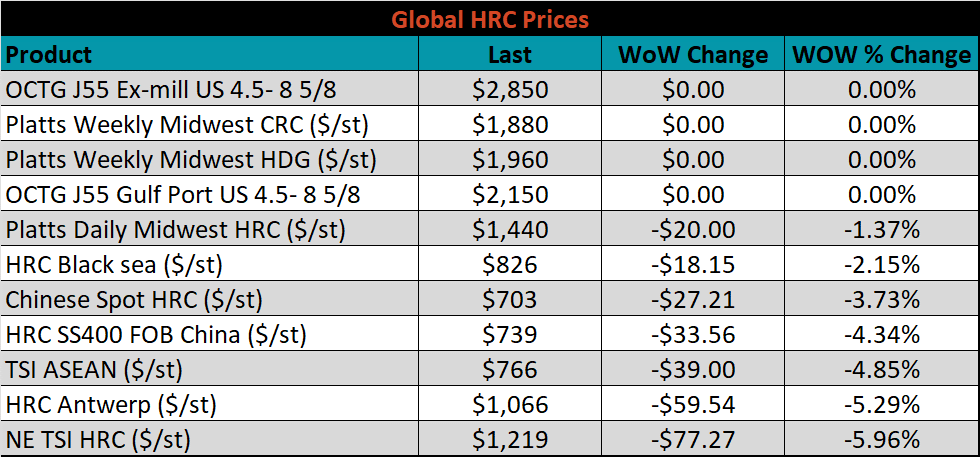
Global flat rolled indexes were mostly lower, led by Northern European HRC, down another 6%.
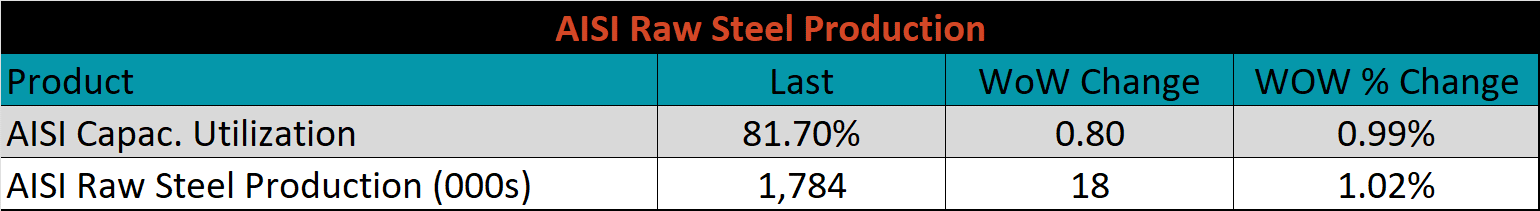
The AISI Capacity Utilization was up another 0.8% to 81.7%.
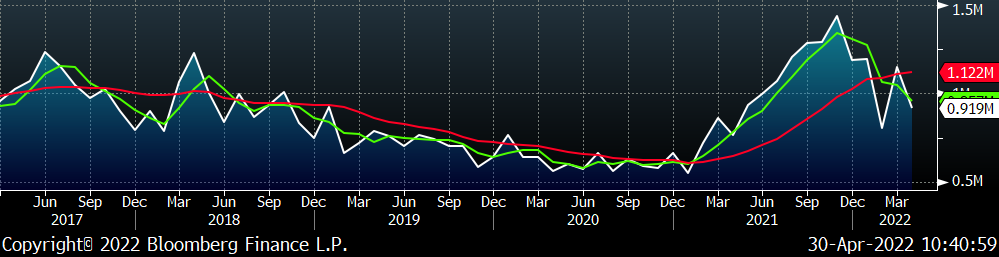
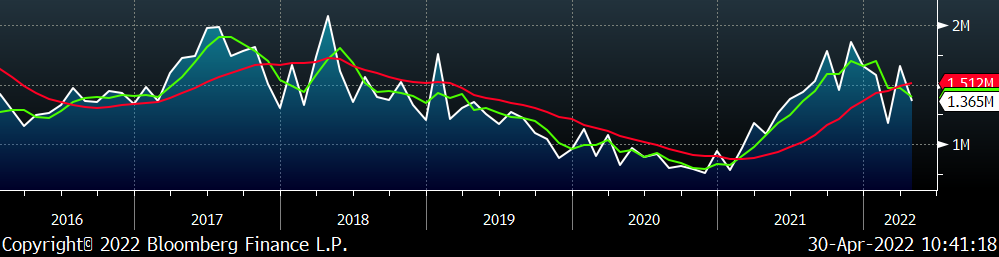
April flat rolled import license data is forecasting a decrease of 228k to 919k MoM.
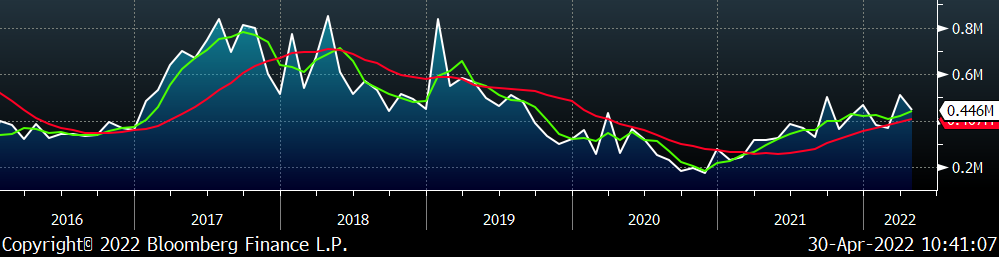
Tube imports license data is forecasting a decrease of 65k to 446k in April.
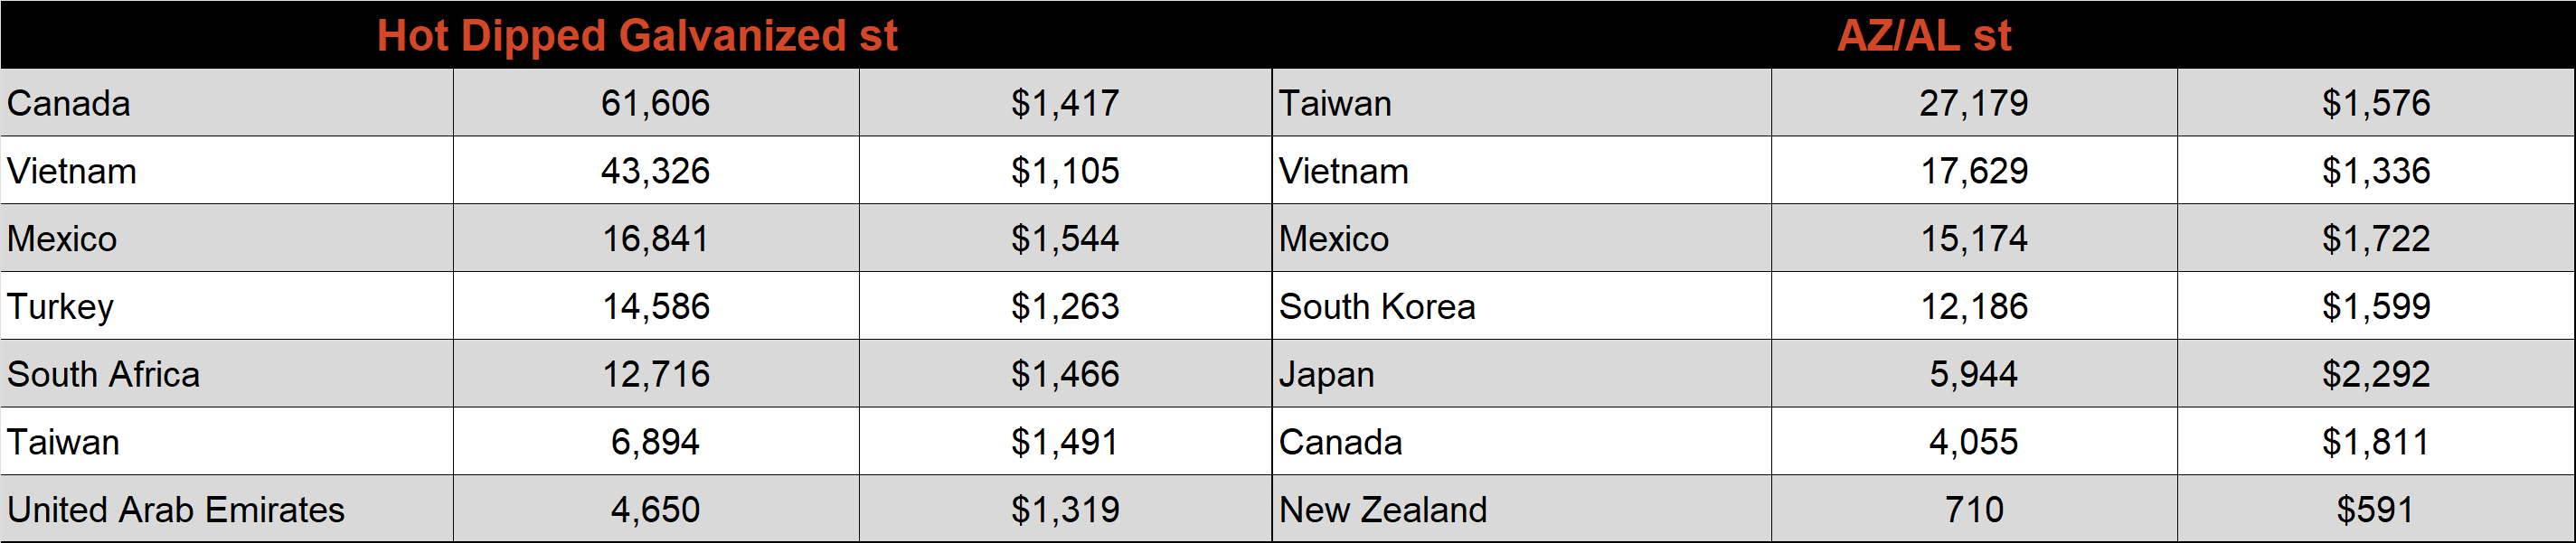
April AZ/AL import license data is forecasting a decrease of 18k to 98k.
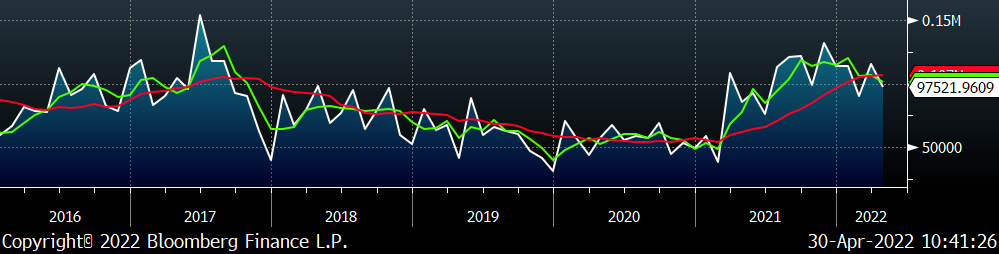
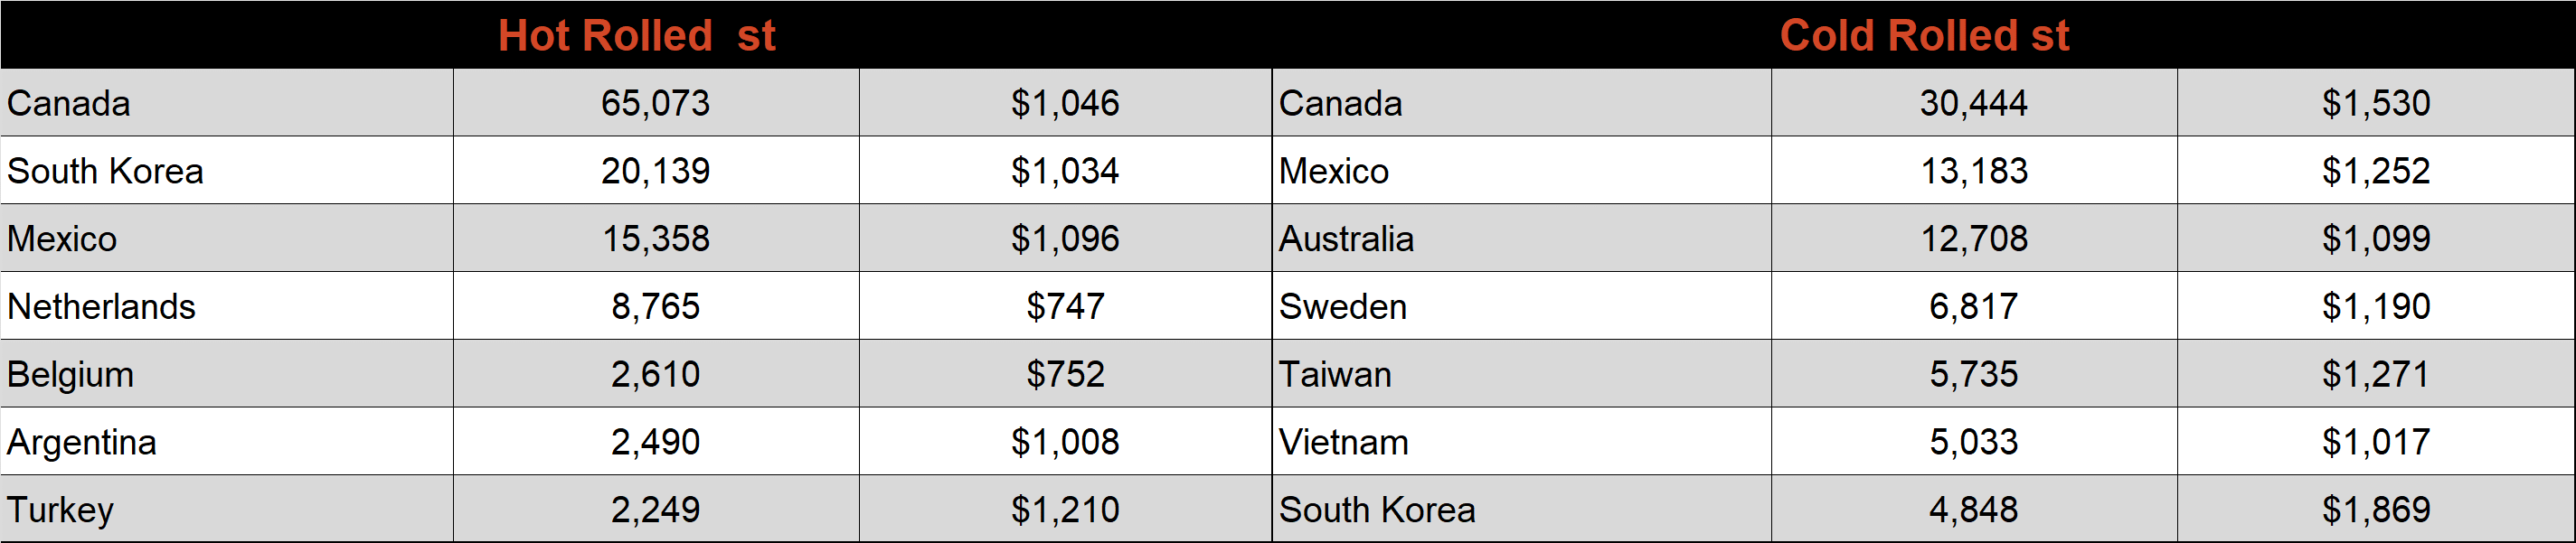
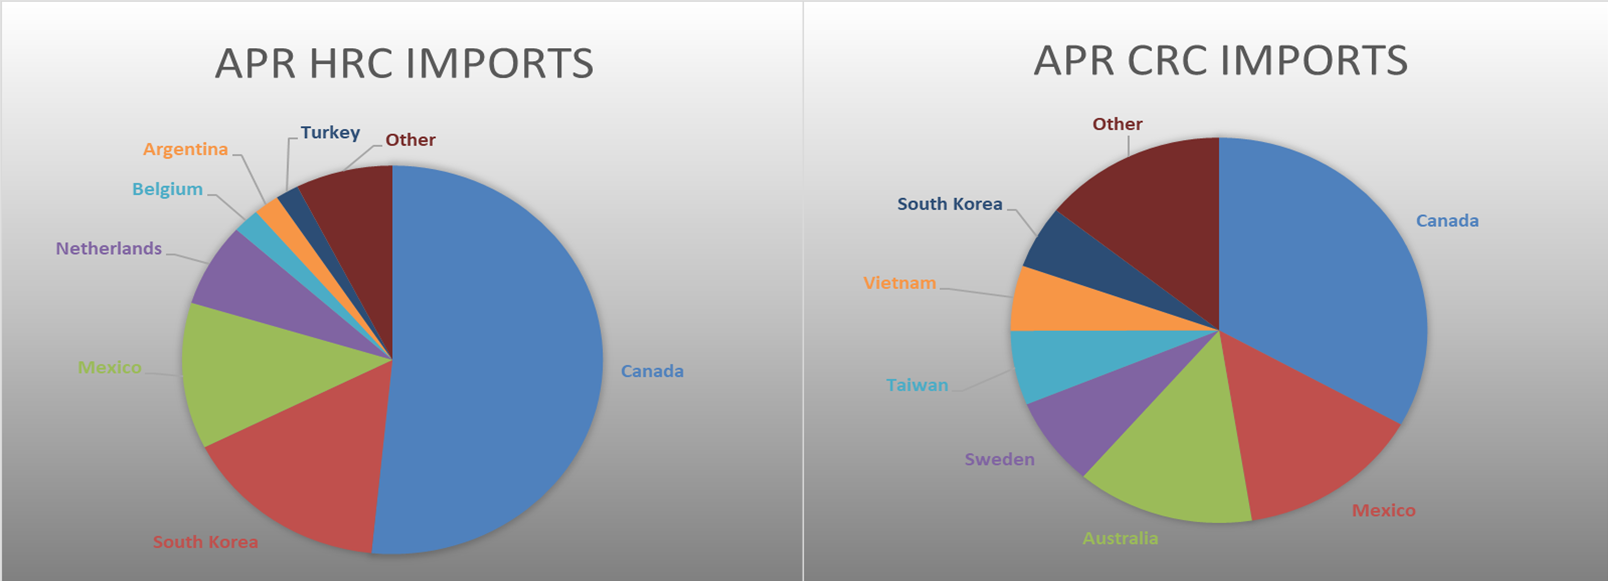
Below is April import license data through April 25th, 2022.
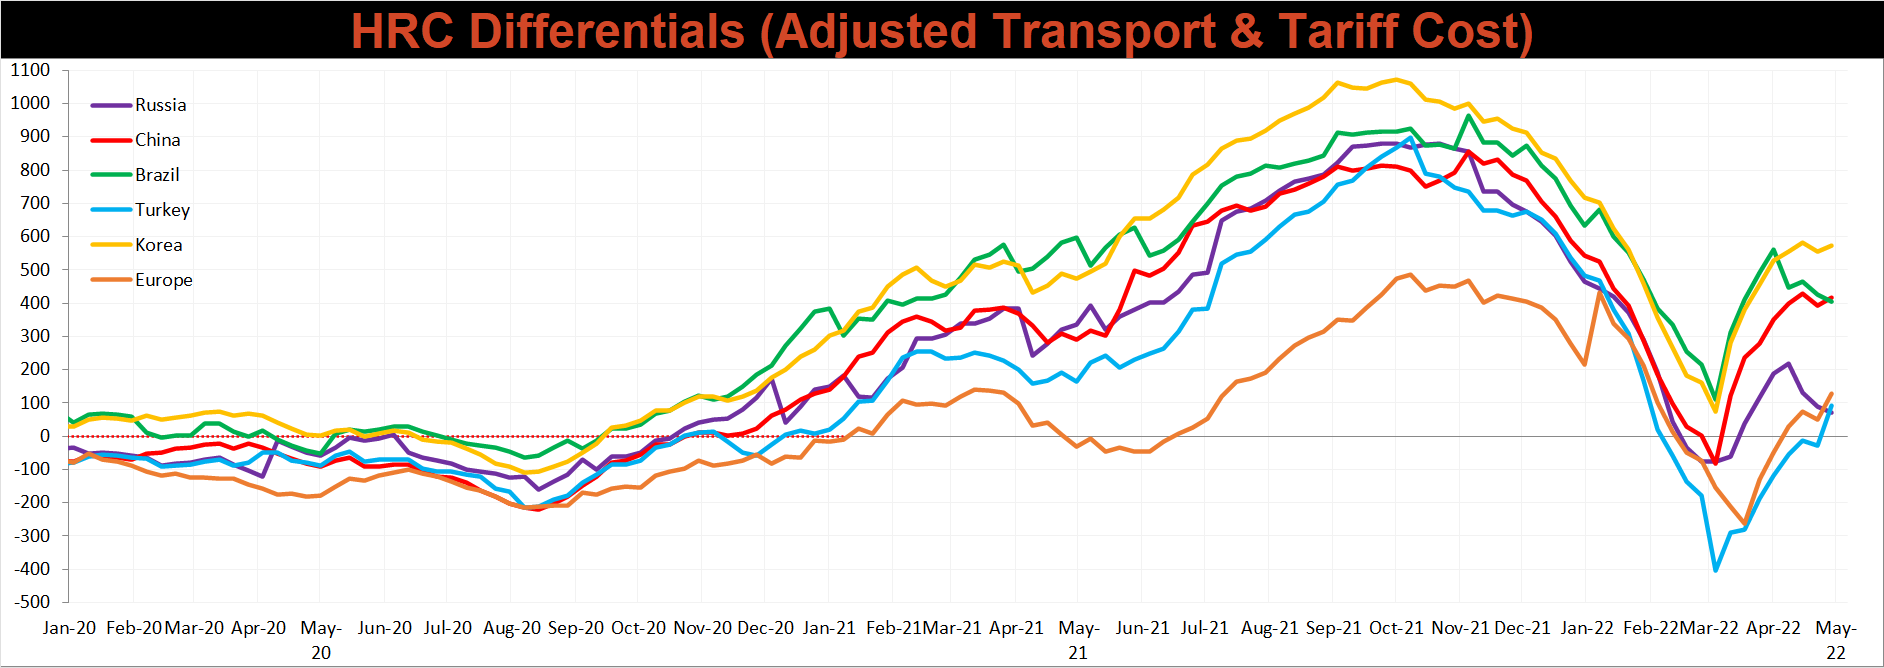
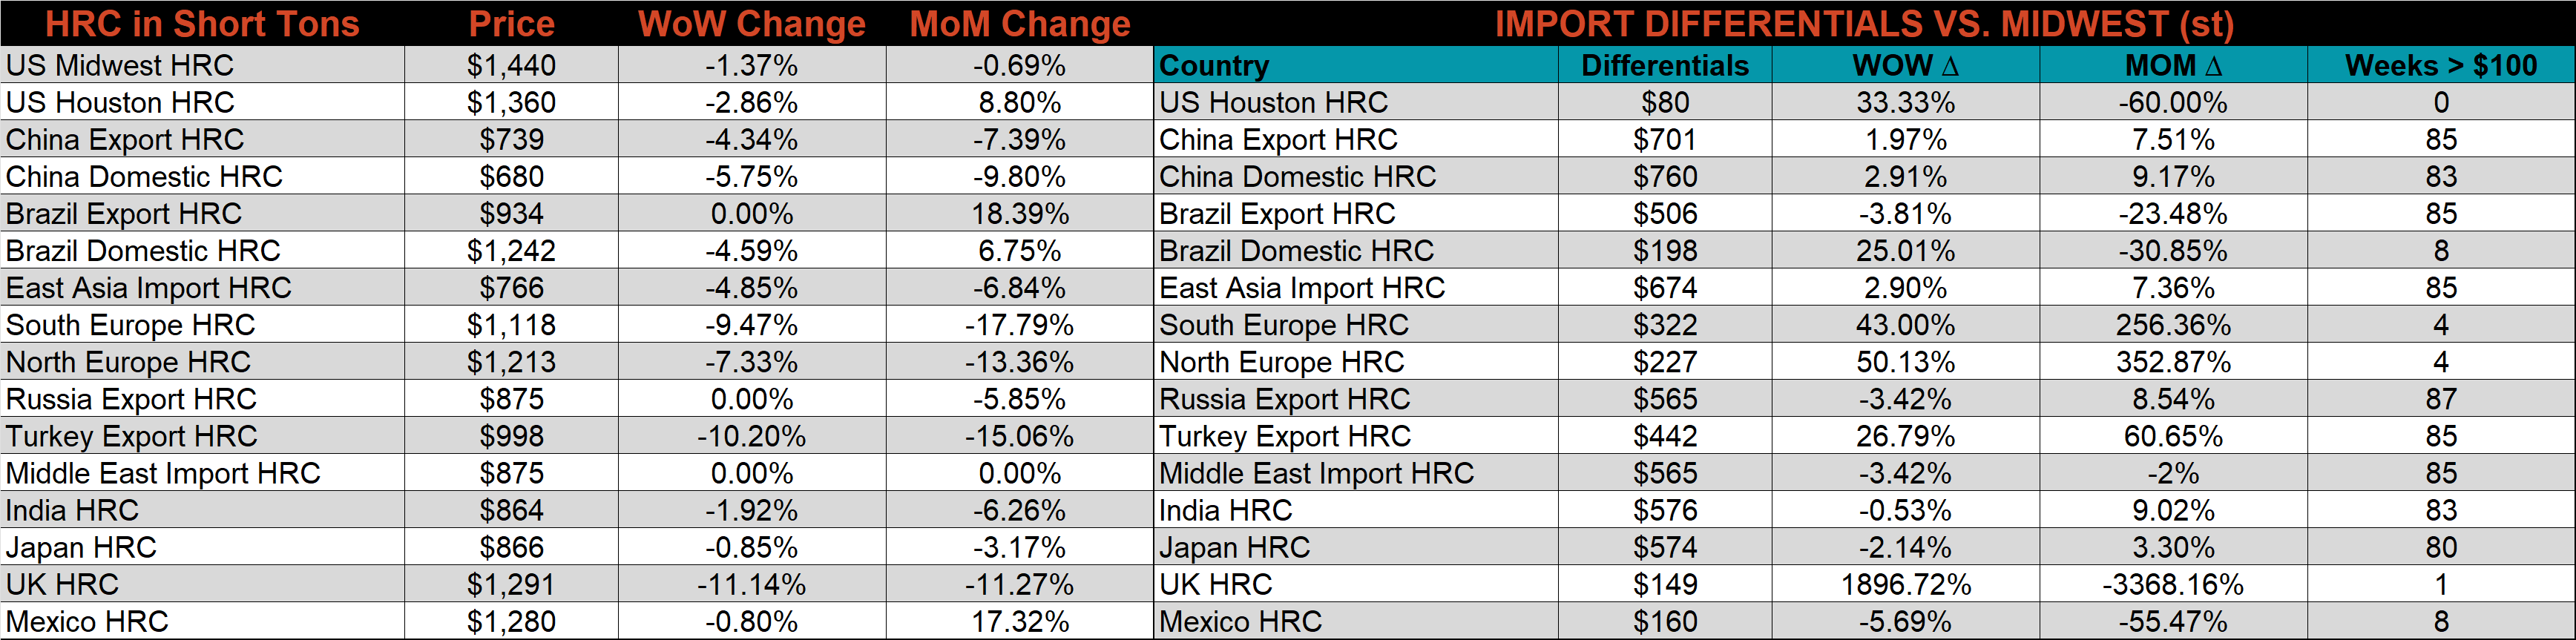
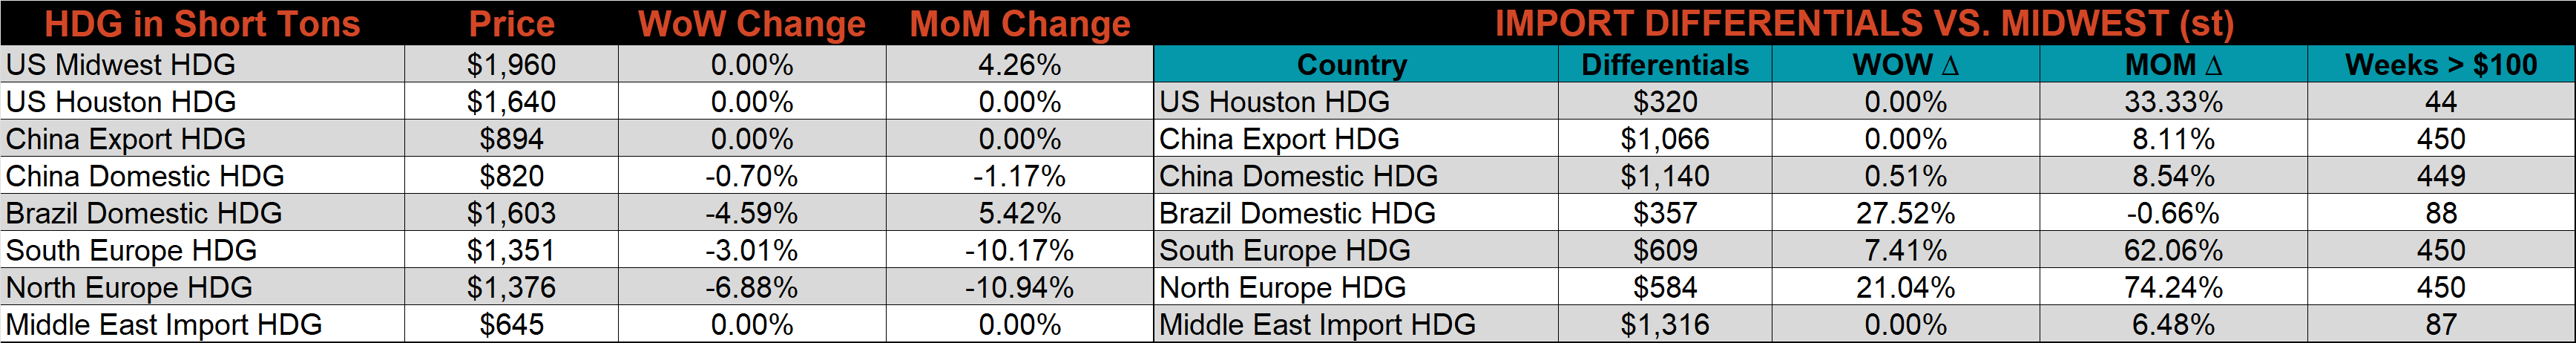
Below is the Midwest HRC price vs. each listed country’s export price using pricing from SBB Platts. We have adjusted each export price to include any tariff or transportation cost to get a comparable delivered price. Differentials mostly increased this week, as the global prices were down more significantly than the U.S. domestic price. Brazil and Russia were exceptions, with neither price changing compared to last week.
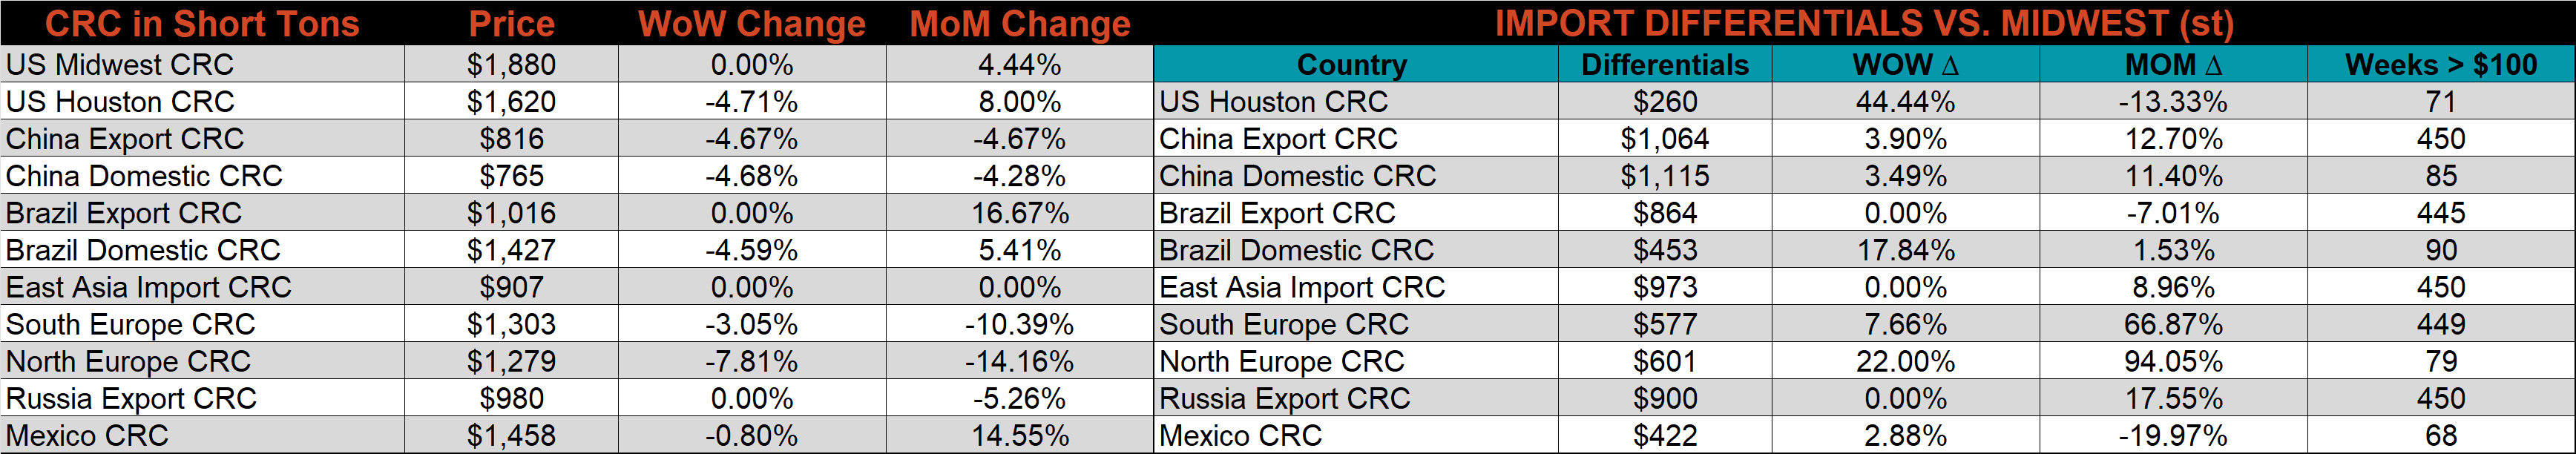
SBB Platt’s HRC, CRC and HDG pricing is below. The Midwest HRC was down 1.4%, while CRC, & HDG prices were both unchanged. Outside of the U.S., the UK HRC price was down the most, -11.1%.
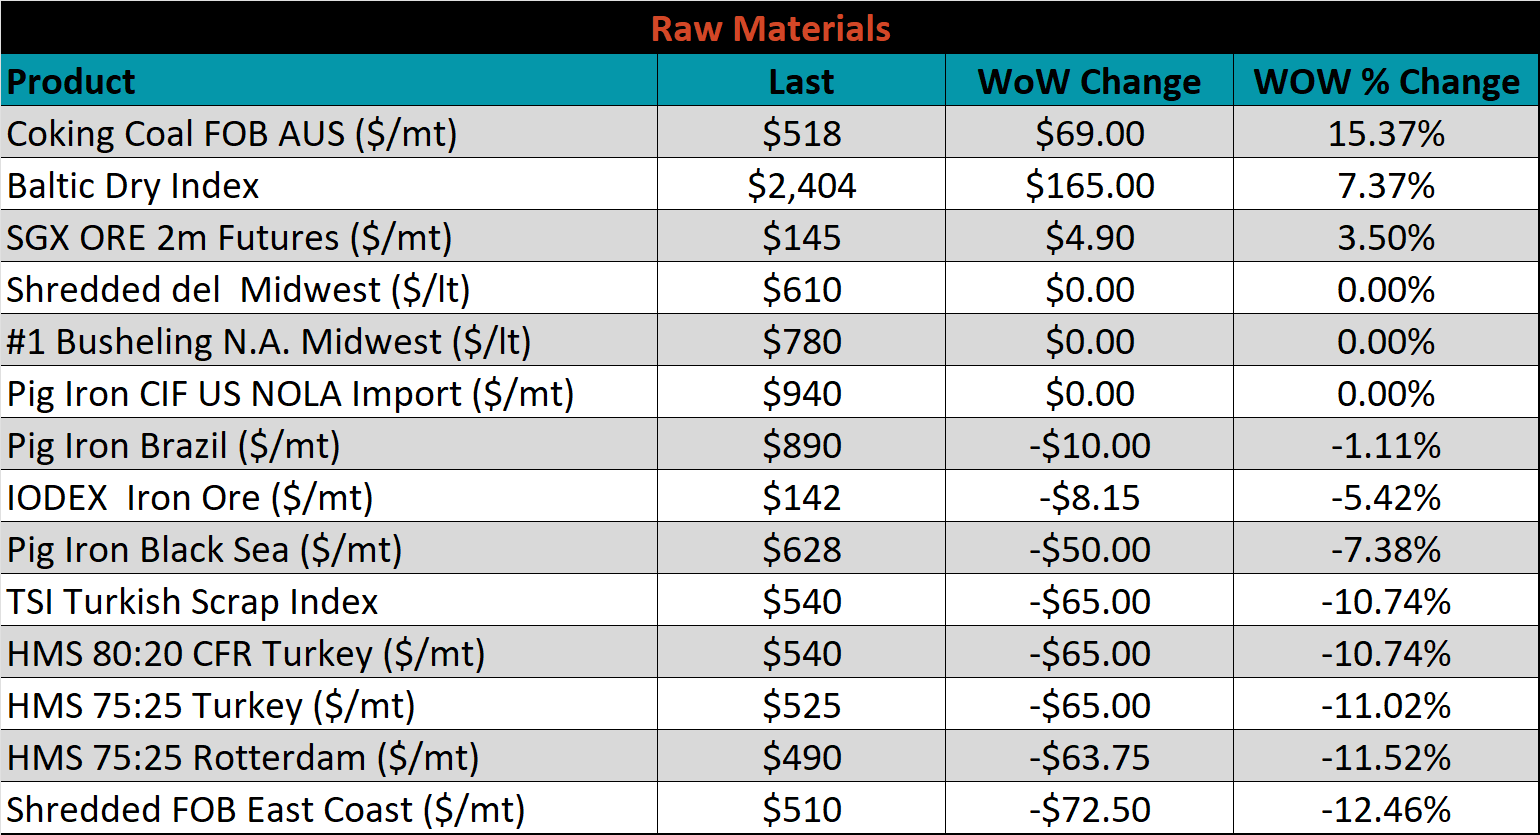
Raw material prices were mostly lower, East Coast shredded, down 12.5%, while Aussie coking coal was up 15.4%.
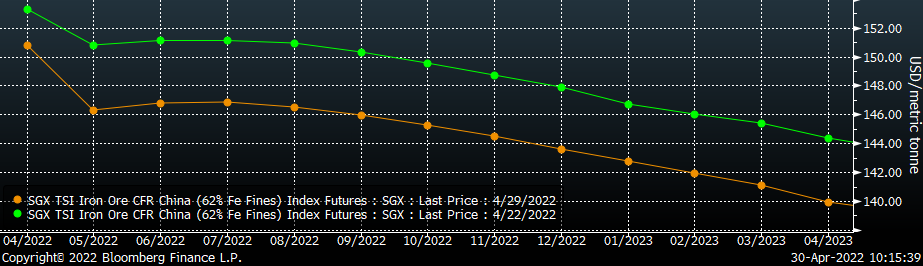
Below is the iron ore future curve with Friday’s settlements in orange, and the prior week’s settlements in green. Last week, the entire curve shifted lower at all expirations, again.
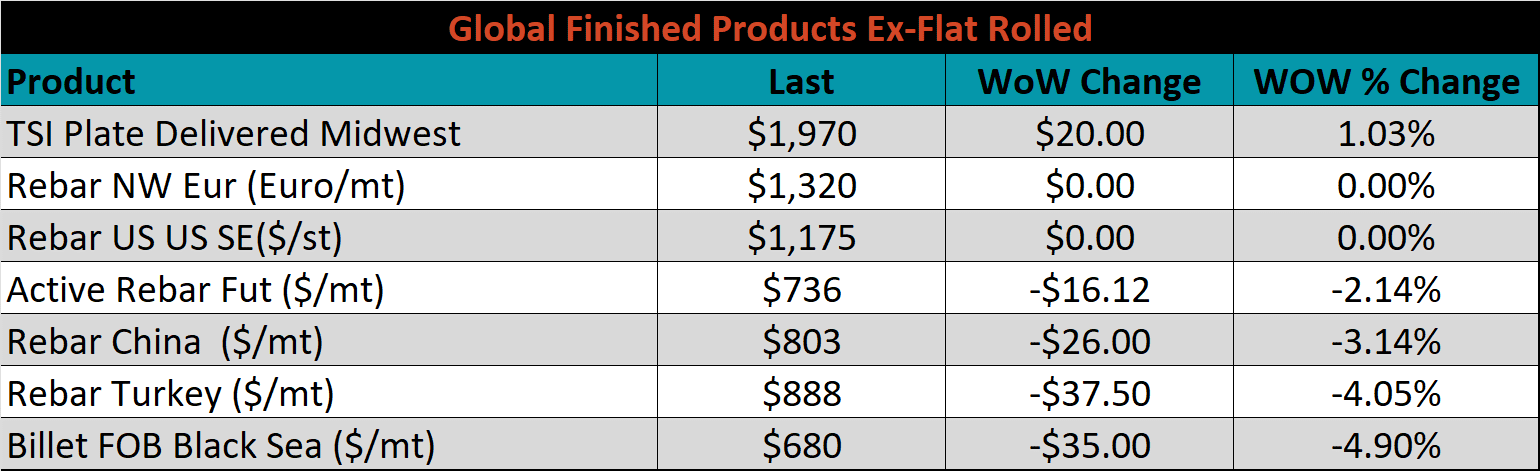
The ex-flat rolled prices are listed below.

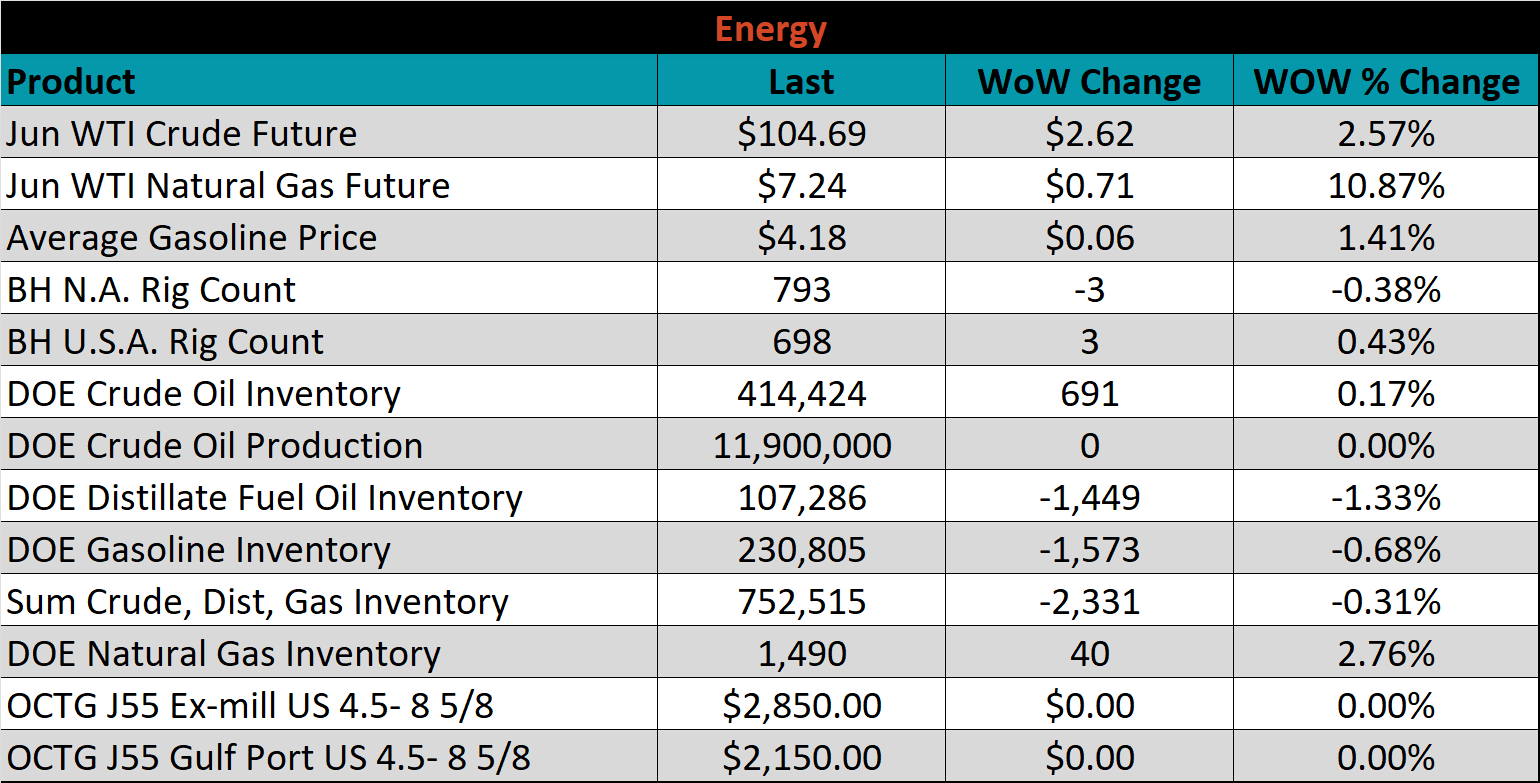
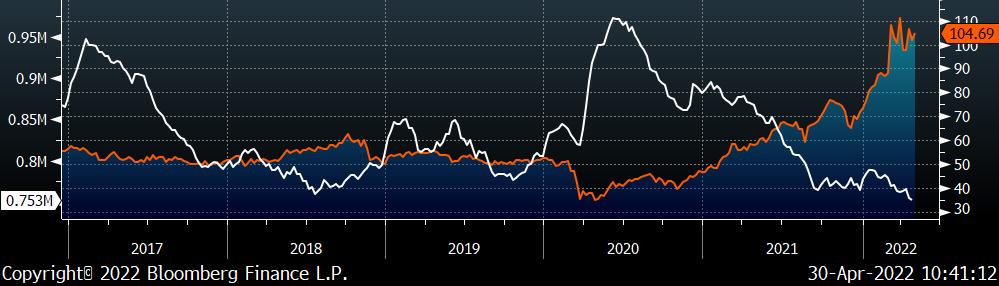
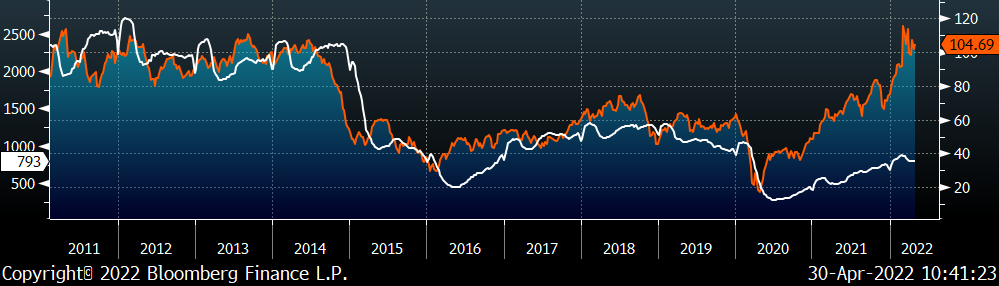
Last week, the June WTI crude oil future gained $2.62 or 2.6% to $104.69/bbl. The aggregate inventory level was down 0.3% and crude oil production remains at 11.9m bbl/day. The Baker Hughes North American rig count was down another 3 rigs, while the U.S. rig count was up another 3.
The list below details some upside and downside risks relevant to the steel industry. The bolded ones are occurring or highly likely.
Upside Risks:
Downside Risks: