Content
-
Weekly Highlights
- Market Commentary
- ISM PMI
- Global PMI
- Construction Spending
- Auto Sales
- Risks


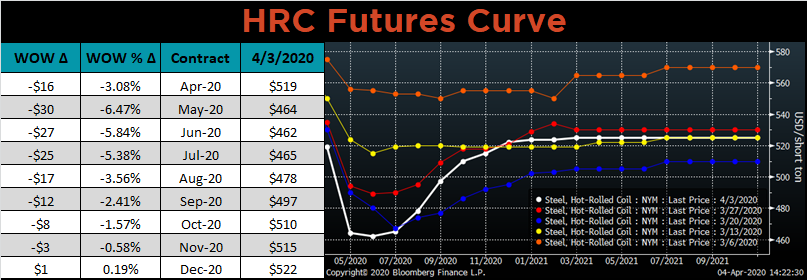
The spot market continued to deteriorate over the last week, with Midwest HRC transaction prices moving closer to $500/st. The future curve shows expectations for further declines in spot prices over the next two months, displaying the negative market sentiment. We received a large amount of mixed economic data (below) over the last week, and until there is more clarity on the extent of the current economic shutdown, data will be inconsistent and unreliable. As we attempt to determine where HRC prices will find support, current economic data will be inadequate due to the large distortions we will see in the data. Instead, we will turn to fundamentals of the steel market to guide us.
Fundamental indicators have been rather meaningless over the past few months for both spot and forward pricing, due to the uncertainty in the market. Demand has been impossible to gauge as many companies tried to determine if they were even allowed to operate, as opposed to accessing their physical material needs. On the supply side, mills have altered their production plans, trying to meet the unknown demand target. Complicating the supply picture is inventory stuck at different spots within the supply chain due to demand destruction and end user shutdowns. In order to determine how the fundamental picture must evolve in order for prices to find support, we looked back at previous cycle bottoms. The following indicators have important insight into the fundamental conditions necessary for prices to bottom: scrap pricing, Busheling vs Turkish scrap, mill profitability and the domestic vs China export price differential. We will look at each of these indicators’ current readings based on spot pricing, as well as where they would be using forward curve pricing.
While each of these indicators shows that spot prices have further to fall, viewing them with forward curve prices shows that they are expected to reach unsustainable levels. For spot buyers, this is an indicator to stay out of the market and wait for lead times and prices to continue to fall. However, this is also an signal that the risk/reward ratio of buying at prices out on the curve is very skewed to the upside. There is much less downside risk compared to the upside reward for locking in HRC prices below $480. For buyers with no immediate physical material need, locking in pricing and tons for the end of summer is clearly a prudent strategy.


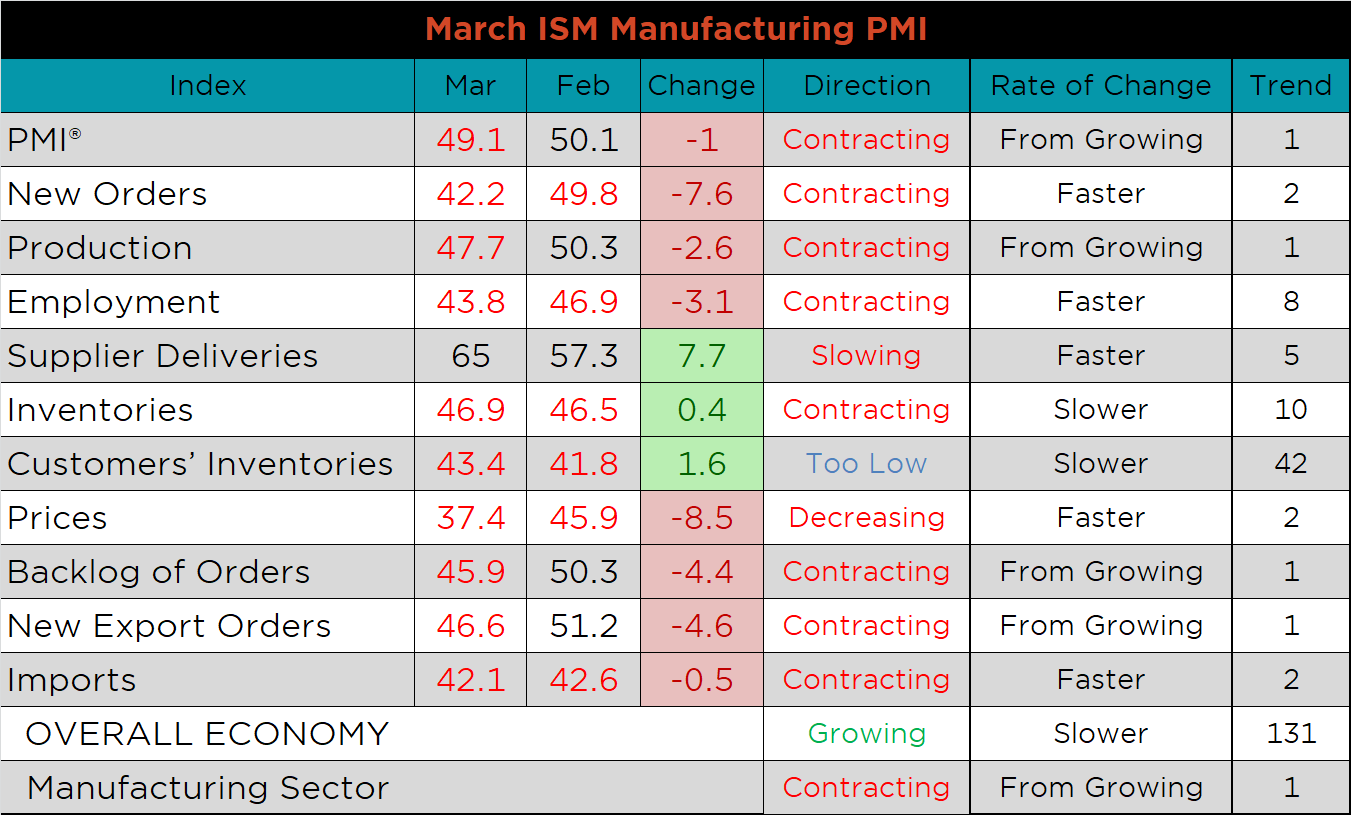
The March ISM Manufacturing PMI and subindexes are below. The topline PMI number was down 1 point and fell into contraction.
The chart below compares the ISM prices subindex with the ISM customer inventories subindex. A risk for manufacturing companies is the collapse in prices followed by increasing inventories, resulting in tight liquidity. The second chart adds the new orders and backlog subindexes together showing a reversal from the promising trend at the beginning of the year. The last chart shows the supplier deliveries subindex, which moved significantly higher. Strength in this index usually indicates tight supply chains from high demand levels. However, in this case the index is artificially high due to government ordered constraints on activity, which in turn inflates the headline PMI Index.


Most of the subindexes were lower MoM, but even more recognizably YoY. Supplier deliveries, Inventories and Customer inventories on the other hand were strong, due to stockpiling inventory before stay in place orders and a slowdown in outbound shipments.


March’s global PMI printings show significant declines as result of the economic slowdown caused by the coronavirus. 18 of the 24 watched countries remain in or moved into contraction, with European and Asian countries fairing the worst.
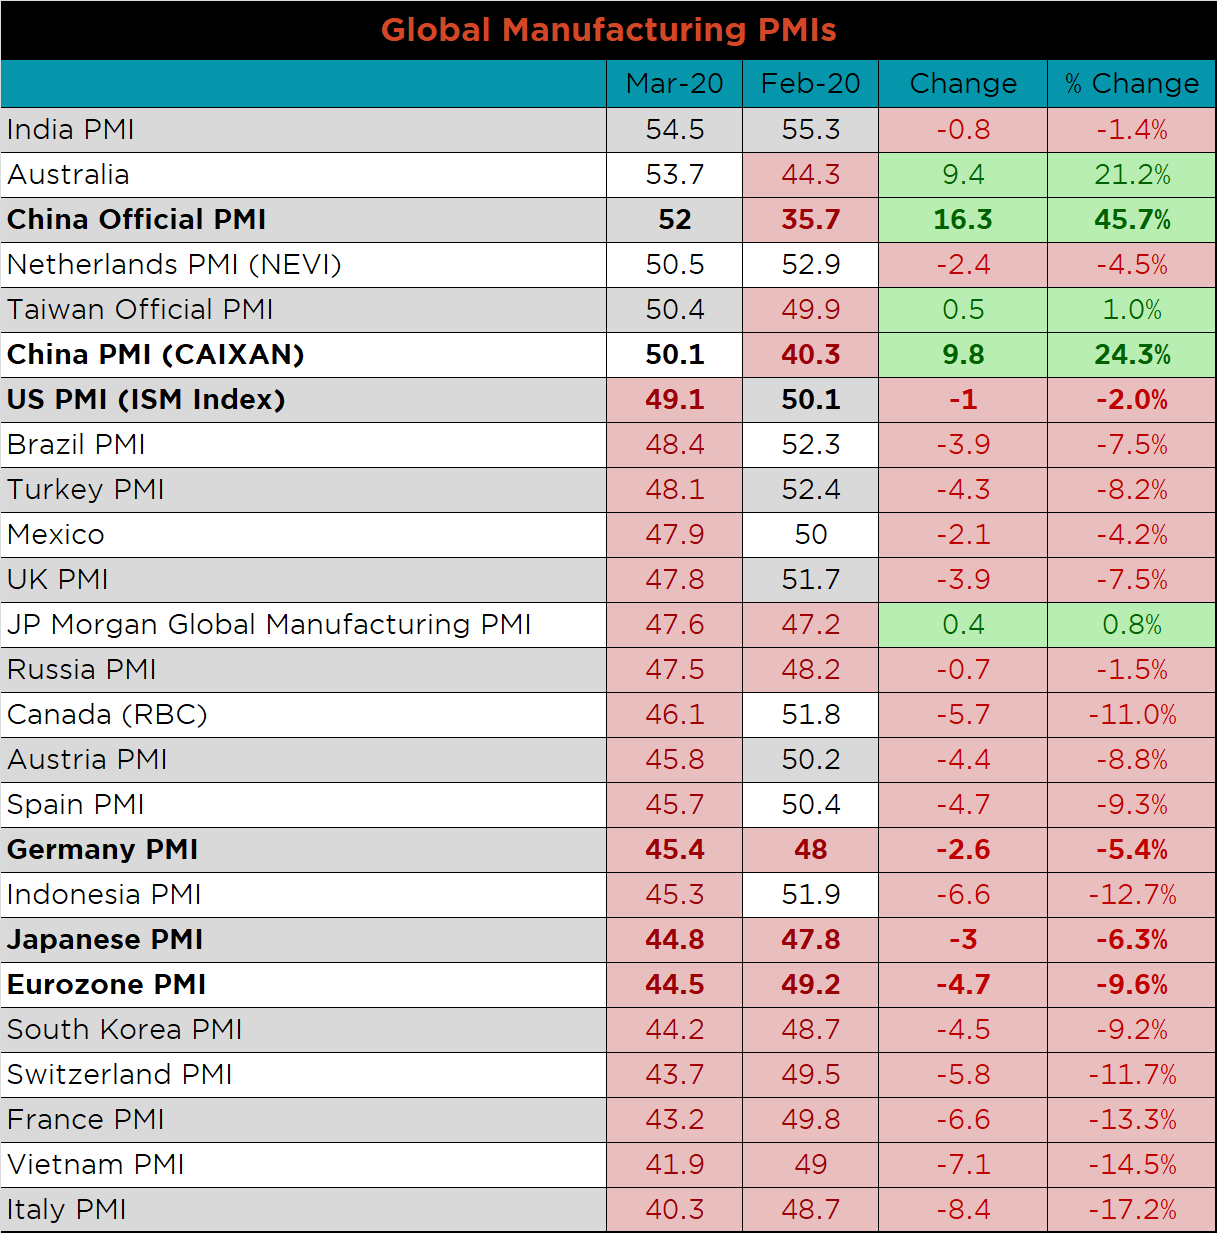


Interestingly, both China’s official PMI, and the Caixan Manufacturing PMI printed significantly higher after record low printings last month. This could be for a combination of reasons. The first and likely most significant is that most reports signal that China is largely getting back to work after draconian measures shut down the country for nearly six weeks. Additionally, PMI data is a survey by which respondents compare their current and future outlook to what it was one month prior. While this month’s data points are encouraging, weakening global PMIs will be a headwind to the export driven Chinese economy.

The table below breaks down China’s official manufacturing PMI subindexes. In a complete reversal, last month’s weak points (i.e. Output, new orders and purchasing of inputs) were up the highest MoM.


February seasonally adjusted U.S. construction spending was higher compared to January and very strong compared to last February. This strength also appeared in positive revisions to the previous three months. In the coming months, we anticipate private spending to be the most impacted by the slowdown in the U.S.

The white line in the chart below represents construction spending in 2020 and compares it to the spending of the previous 4 years. The last two charts show the YoY changes in construction spending. Private non-residential spending began to slip in February, but remains positive, while residential spending continued the strong growth trend that started in September.


March U.S. light vehicle sales decreased significantly to an 11.37m seasonally adjusted annualized rate (S.A.A.R), the lowest level since 2010. The second chart shows the relationship between the unemployment rate and auto sales. The unemployment rate is inverted to show that declining unemployment typically leads to increasing auto sales. Understandably, both auto sales and the labor market saw a significant negative impact from the current economic climate. Looking to the future, these data points finding a floor and improving will be a strong signal of when the eventual economic recovery is underway.


Below are the most pertinent upside and downside price risks:
Upside Risks:
Downside Risks:

The Platts TSI Daily Midwest HRC Index was down another $19.50 to $528.25.

The CME Midwest HRC futures curve is below with last Friday’s settlements in white. The curve moved significantly lower in the front.
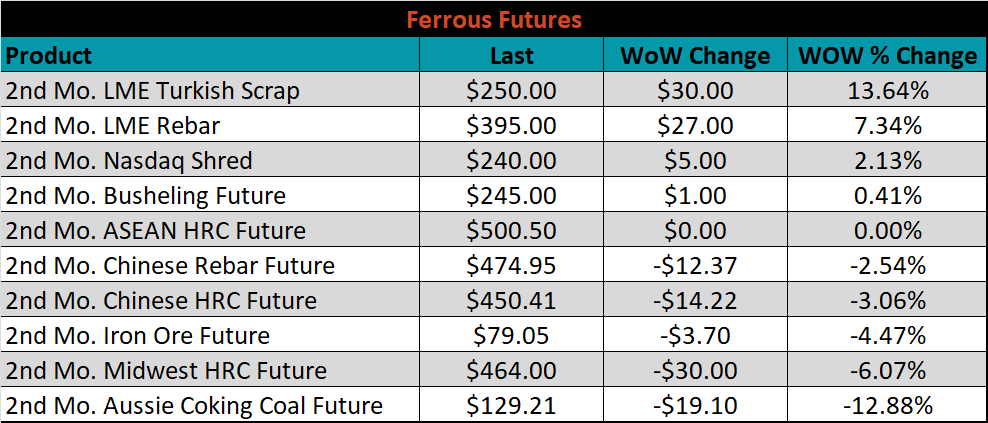
May ferrous futures were mixed. Turkish scrap gained 13.6%, while Aussie coking coal lost 12.9%.
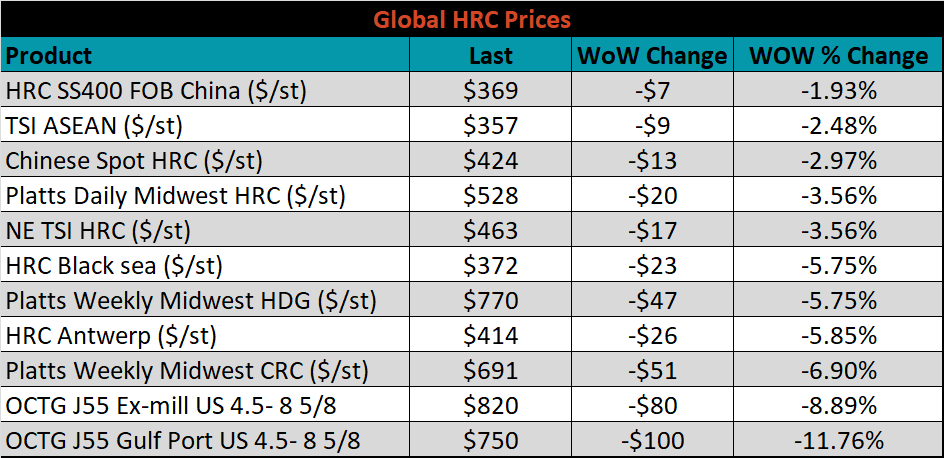
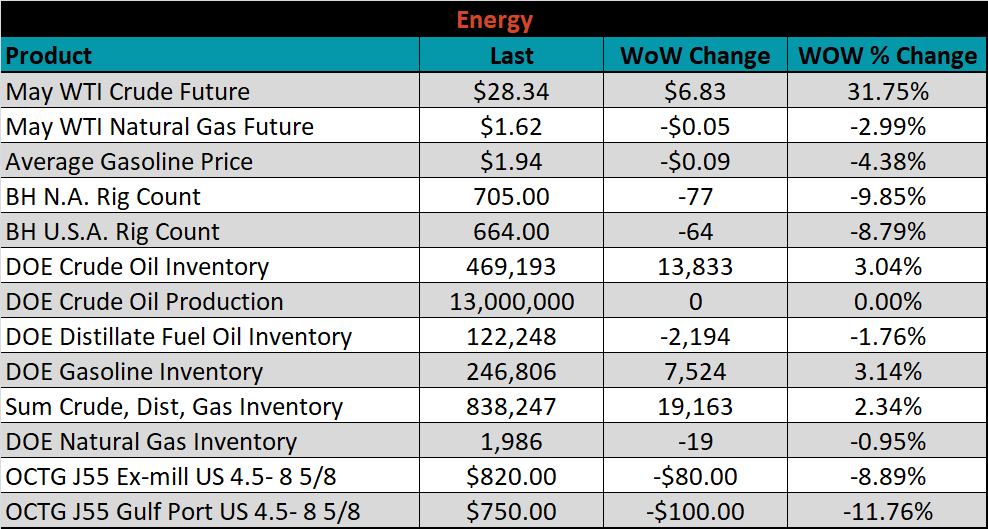
The global flat rolled indexes were all lower, led by Gulf Port OCTG tubing and TSI Midwest CRC, down 11.8% and 6.9%, respectively.
The AISI Capacity Utilization Rate was down another 7.8% to 71.6%, falling to its lowest level since early 2017.


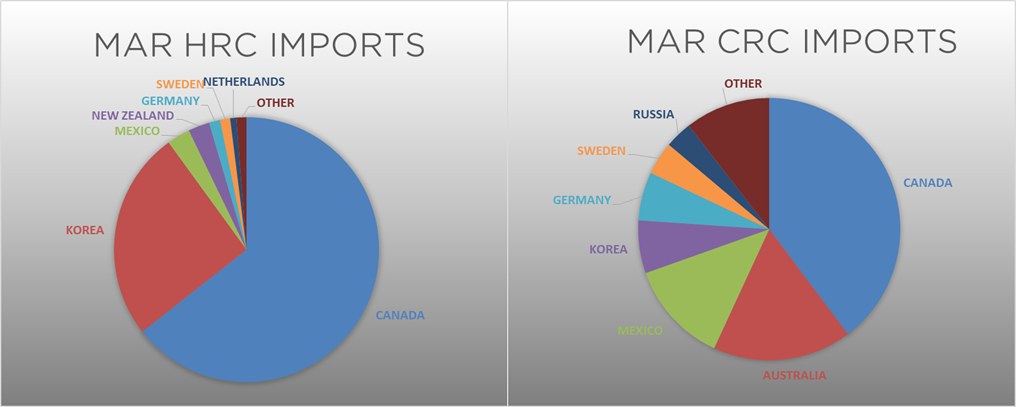
March flat rolled import license data is forecasting an increase of 4k to 646k MoM.

Tube imports license data is forecasting a MoM increase of 127k to 385k tons in March.


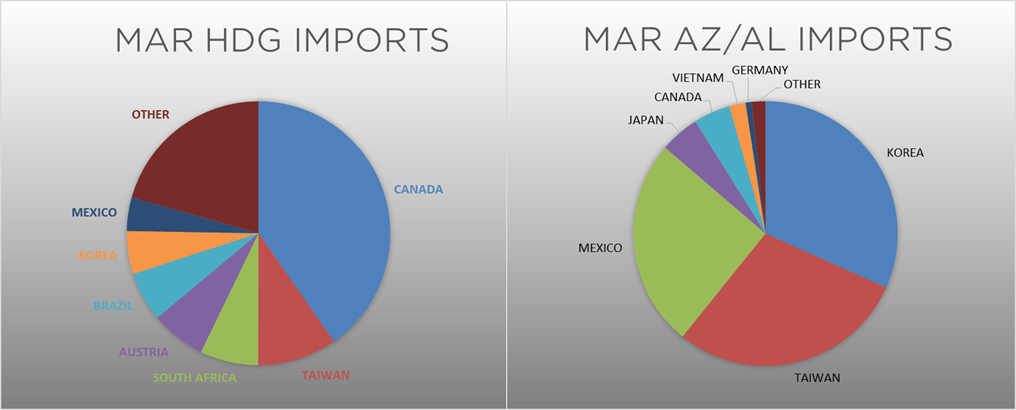
AZ/AL import license data is forecasting an increase of 2k in March to 58k.

Below is February import license data through March 31, 2020.


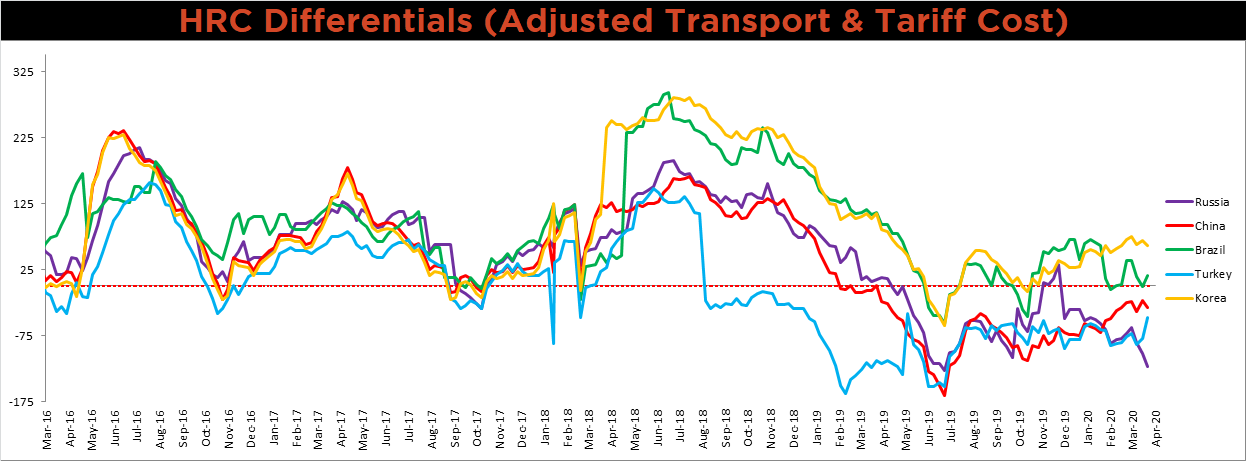
Below is the Midwest HRC price vs. each listed country’s export price using pricing from SBB Platts. We have adjusted each export price to include any tariff or transportation cost to get a comparable delivered price. The Russian, Chinese and Korean differentials decreased, as their respective prices were flat or fell less than U.S. Midwest HRC prices, while the Turkish and Brazilian differentials increased.
SBB Platt’s HRC, CRC and HDG pricing is below. The Midwest CRC, HRC and HDG prices were down 6.9 %, 3.5% and 2.5%, respectively. Turkey and Brazil HRC export prices were down 9.7% and 8.1%, respectively.


Raw material prices were mixed. New Orleans delivered Pig Iron was down another 16%.
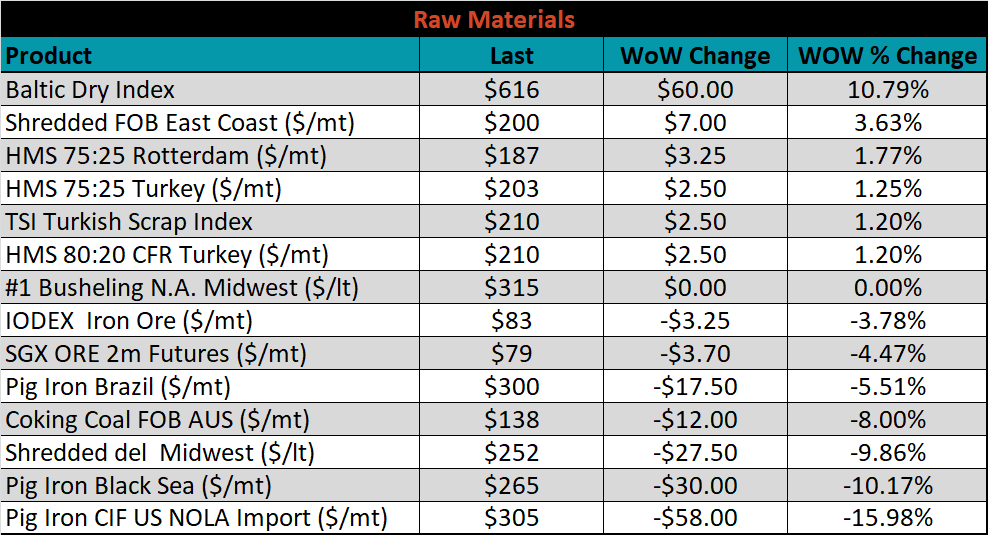
Below is the iron ore future curve with Friday’s settlments in orange, and the prior week’s settlements in green. The entire curve shifted slightly lower.

The ex-flat rolled prices are listed below.


Last week, the May WTI crude oil future gained $6.83 or 31.8% to $28.34/bbl. The aggregate inventory level was up 2.3% and crude oil production was flat at 13m bbl/day. The Baker Hughes North American rig count was down 77 rigs and the U.S. rig count was down 64 rigs.


The list below details some upside and downside risks relevant to the steel industry. The orange ones are occurring or look to be highly likely. The upside risks look to be in control.
Upside Risks:
Downside Risks: