Content
-
Weekly Highlights
- Market Commentary
- Risks


The rally that appeared to be consolidating only a few weeks ago, continues to push HRC spot prices higher as all eyes turn to the next price level of $1,600. “More of the same” may sound too dismissive at such incredible prices, but with lower-than-expected imports, extended lead times and significant demand, the end of the rally remains out of focus. While it has been a fool’s errand to predict when this rally will peak and turn around, the fact remains that the turnaround will be caused by demand. This week we will look more closely at the demand for steel within the manufacturing sector while we anticipate economic data in next week’s report.
The chart below is of mill production going back to January 2020 with the annualized rate of change in parenthesis.

Mills were savvy to cut production by over 20% in the spring, when demand disappeared. After ramping up production to match increasing apparent demand in the summer of 2020, mills have shown they are reluctant to ramp back up to full capacity (approximately 80% using pre-pandemic levels). The rate of change slowed dramatically in late-January, despite prices increasing 28% during the period. This chart confirms there can be steel production added, but the fact that prices rose along with production throughout this rally shows that supply is not the main driver.
At FGM, we look at a variety of Regional Federal Reserve Manufacturing Surveys to better illustrate the status of this demand driven recovery. Below are the recent prints for new orders and the backlog from these reports beginning in January 2020.

Changes in new orders offer a snapshot into monthly demand changes, and a growing or shrinking backlog operates as a barometer for confidence in future demand. It is important to note that the magnitude should be compared month-to-month readings, rather than between different surveys on the same month. For that type of analysis, each reading must be average weighted, but doing so reveals two key findings. First, the April 2020 accumulative readings for new orders and the backlog are the lowest on record, going back to 2004. Second, the April 2021 accumulative readings are the highest on record over the same period. The fluctuations in steel demand over the past year have been historic and have caused us to re-evaluate what that means for the industry and baseline prices over the next decade.

Below are the most pertinent upside and downside price risks:
Upside Risks:
Downside Risks:

The Platts TSI Daily Midwest HRC Index increased by $15.50 to $1,445.

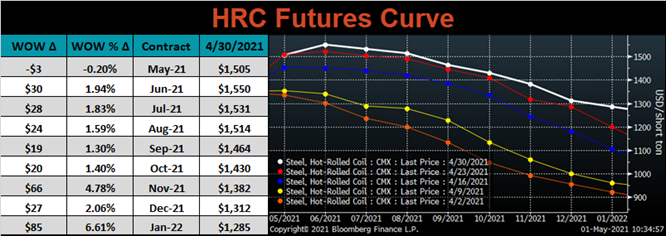
The CME Midwest HRC futures curve is below with last Friday’s settlements in white. Last week, the entire curve shifted higher, most significantly at the later expirations.
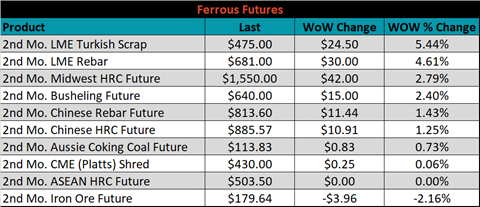
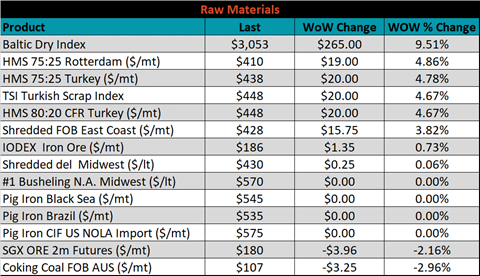
June ferrous futures were mostly higher. The Turkish scrap future gained 5.4%, while the iron ore future lost 2.2%.
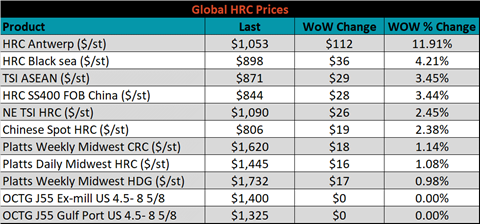
Global flat rolled indexes were all higher, led by Antwerp HRC, up 11.9%.
The AISI Capacity Utilization rate increased 0.4% to 78.4%.


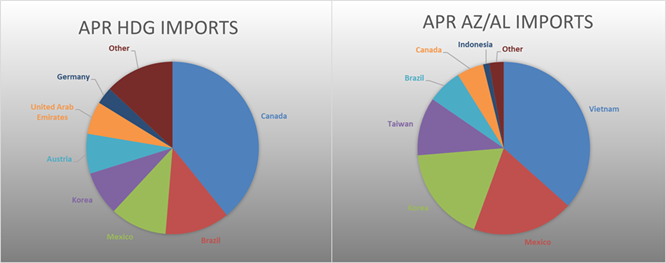
April flat rolled import license data is forecasting a decrease of 2k to 861k MoM.

Tube imports license data is forecasting an increase of 18k to 335k in April.


April AZ/AL import license data is forecasting a decrease of 2k to 106k.

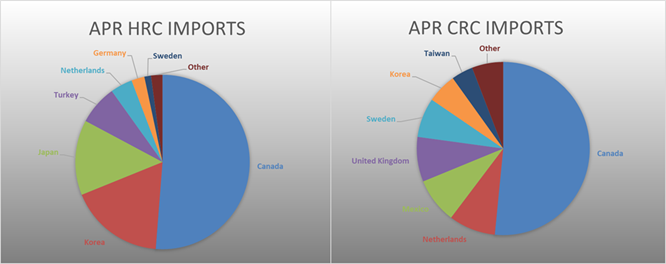
Below is April import license data through April 27, 2021.


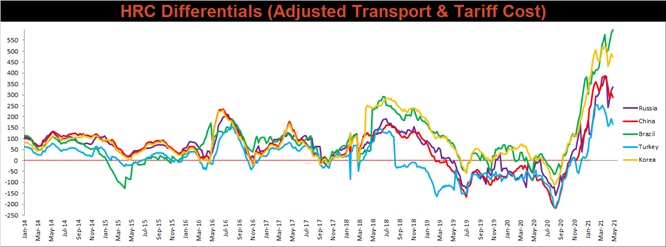
Below is the Midwest HRC price vs. each listed country’s export price using pricing from SBB Platts. We have adjusted each export price to include any tariff or transportation cost to get a comparable delivered price. The differentials decreased for China, Turkey, and Korea, as their prices rose more significantly that the also increasing U.S. domestic price.
SBB Platt’s HRC, CRC and HDG pricing is below. The Midwest CRC, HRC & HDG prices were up, 1.1%, 1.1% and 1%, respectively. Globally, the Northern European HRC price was up 3.8%.


Raw material prices were mixed, Rotterdam 75:25 HMS was up 4.9% while Aussie coking coal was down 3%.
Below is the iron ore future curve with Friday’s settlements in orange, and the prior week’s settlements in green. Last week the curve shifted lower at all expirations after 3 weeks of strength.

The ex-flat rolled prices are listed below.


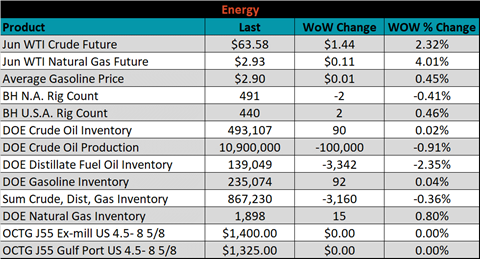
Last week, the June WTI crude oil future was down $1.44 or 2.3% to $63.58/bbl. The aggregate inventory level was down another 0.4% and crude oil production was down to 10.9m bbl/day. The Baker Hughes North American rig count was down another 2 rigs, while the U.S. rig count was up 2 rigs.


The list below details some upside and downside risks relevant to the steel industry. The orange ones are occurring or look to be highly likely. The upside risks look to be in control.
Upside Risks:
Downside Risks: