Content
-
Weekly Highlights
- Market Commentary
- Durable Goods
- Risks


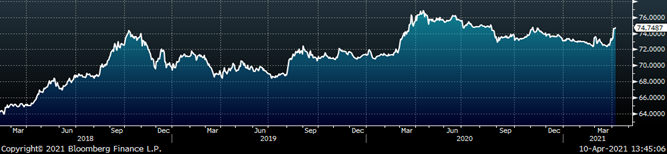
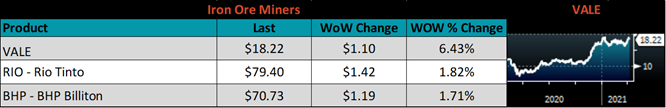
After three weeks of negligible change in spot, it is easy to become complacent about the rally and where prices can go from here. Since March 24th, when the TSI Midwest HRC price reached $1,343, the price has not increased or decreased by more than 1%. To a casual observer, this decrease in momentum might signal the rally is nearly over. However, buyers in the physical market are still short steel, and show a willingness to pay significantly above the spot price to get what they need. Plainly, these two realities are in complete contradiction, so let us dig a little deeper.
The typical lead time since late August has been approximately 8-10 weeks, more than two times the historical average. In a normal market, this would mean spot tons are available to be ordered with an approximate 2-month lag between an order and its shipment. But when there are few to no spot tons available, and lead times at the same level, the metric is how long spot tons and pricing remain available to buyers. Currently, available offers from mills are good a matter of hours, rather than the days or weeks historically typical, all the while, lead times have remained near “9 weeks”. This additional tightening suggests that the structural shortage is in fact worse now than it has been at any other point in the rally and that the next move higher in spot prices is imminent. In the past, an obvious answer to domestic supply shortages, high prices and long lead times would be the global market and imports. This week, we will detail why it might not be as simple this time.
Like many others who analyze the U.S. domestic market, we watched the expanding global price differentials reach unprecedented levels and believed that imported steel was bound to increase dramatically. This finally started to occur in March and appears to be continuing as preliminary licenses for April are well above the recent trend. As highlighted in a recent report, we anticipate this to be an additional accumulated 1.5-2M/tons by the end of September, but unlike many of our contemporaries, we see this merely as a necessity to fill current holes and not indicative of a looming crash in prices. Since publishing that report, two major shifts on have occurred in China, and we believe they need to be accounted for.
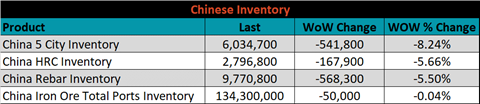
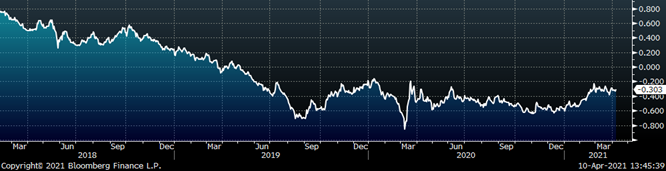
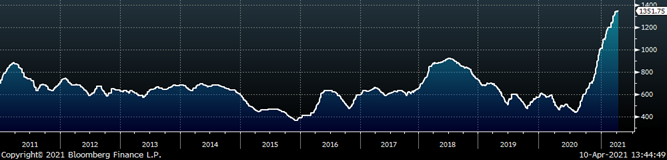
As the world’s largest producer, it is no surprise that the Chinese steel market is the driving force globally. Since the beginning of the year, reports have come out that the government is serious about reducing carbon emissions. The steel industry is the leading producer of CO2 in China at nearly 15% of the total, and BOF mills will need to be shut down to make an impact on overall reduction. China, the world’s largest exporter of steel, may soon become a net importer, sucking up whatever is available in the region to offset growing demand. On top of that, the government is considering a repeal of the export tax rebate that was established to incentivize domestic production and stimulate their economy. The immediate impact of these two changes is the Chinese export price (below) has been on an absolute tear, up over 23% since the beginning of March, with the expectation that the rebate will soon be removed.
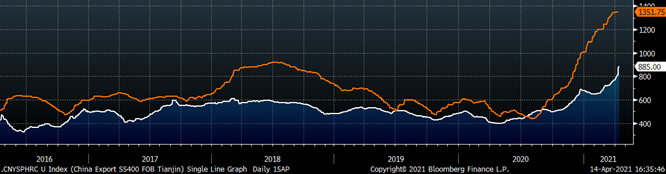
Interestingly, the Chinese export price remains the lowest in the region, suggesting there is more room to run, and thus additional support of elevated U.S. domestic prices. As we will detail further in the differentials section below, while the U.S. price has taken its foot off the gas, global prices have begun catching up. While a significant gap remains, the trend is clear: steel prices around the globe are increasing and relief from the steel shortage in the short term is nowhere to be found. The drum beat for prices above $1,400 is becoming ever louder, and nay-sayers continue to kick the can.
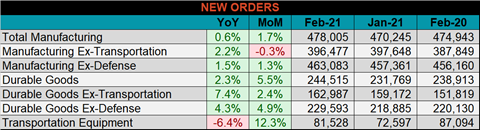
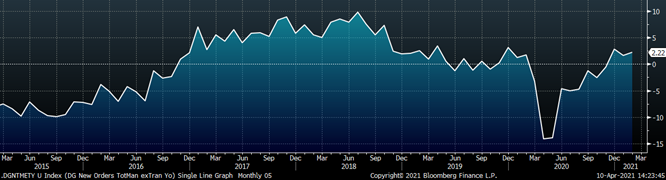
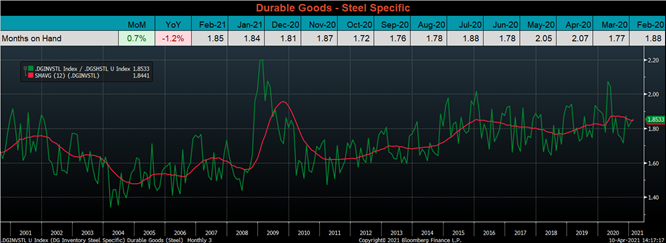
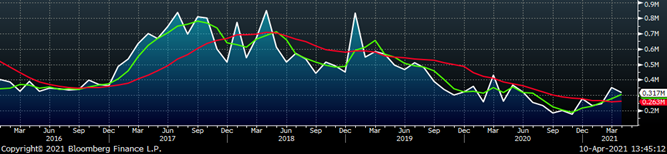
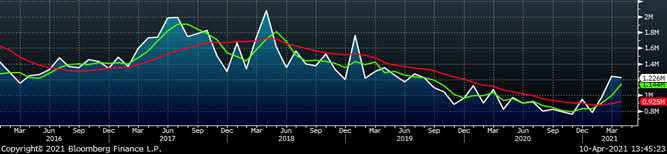
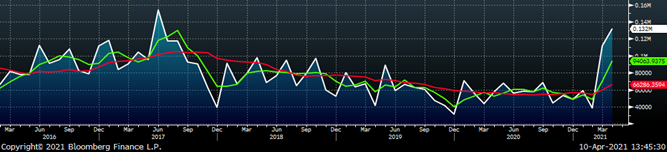
Below are final February new orders from the Durable Goods report. New orders for manufactured goods were up 0.6% compared to February 2020 and up 1.7% compared to January. Manufacturing ex-transportation new orders were up 2.2% YoY, but 0.3% lower than January. The final chart looks at the months on hand (inventory divided by shipments) for durable goods categories that are steel intensive. MOH increased slightly compared to January and remains is in line with the 12-month moving average.
Below are the most pertinent upside and downside price risks:
Upside Risks:
Downside Risks:
The Platts TSI Daily Midwest HRC Index increased by $8.75 to $1,351.75.
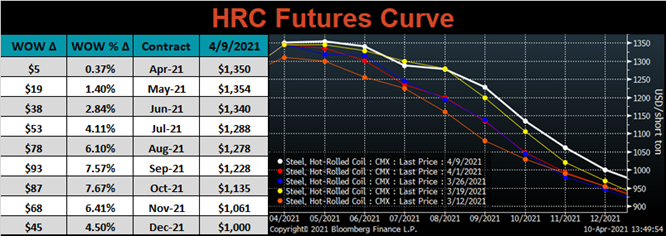
The CME Midwest HRC futures curve is below with last Friday’s settlements in white. Last week, the entire curve shifted higher, most significantly in the later expirations. While the front of the curve resembles prices three weeks ago, prices in the 3rd and 4th quarter are 20-30 dollars higher than they were at that time.
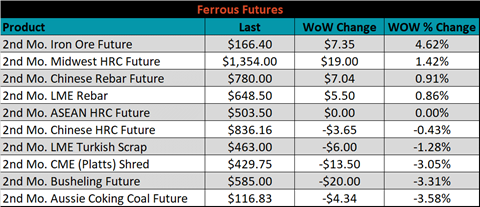
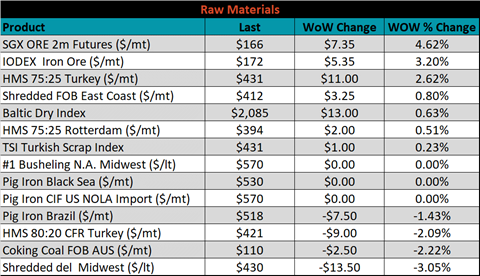
May ferrous futures were mixed. The iron ore future gained 4.6%, while Aussie coking coal lost 3.6%.
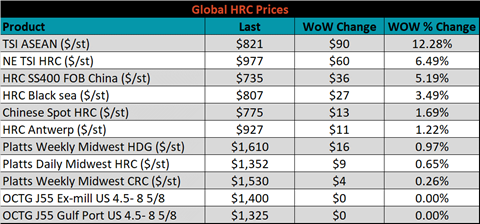
Global flat rolled indexes were all higher, led by ASEAN HRC, up 12.3%.
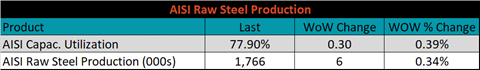
The AISI Capacity Utilization rate increased 0.3% to 77.9%.
April flat rolled import license data is forecasting an increase of 19k to 909k MoM.
Tube imports license data is forecasting an increase of 32k to 317k in April.
April AZ/AL import license data is forecasting an increase of 20k to 132k.
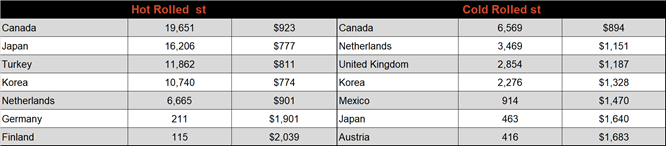
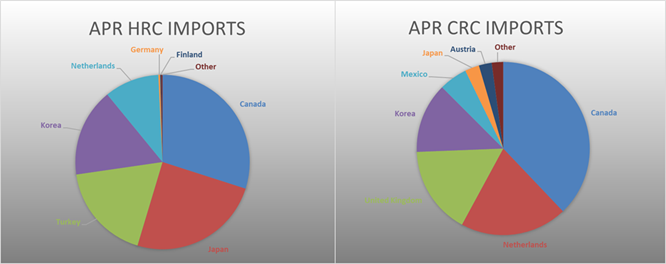
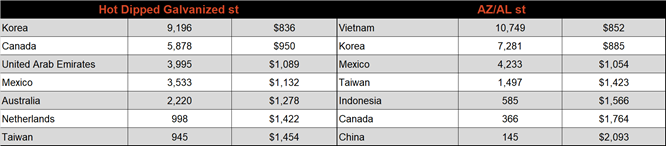
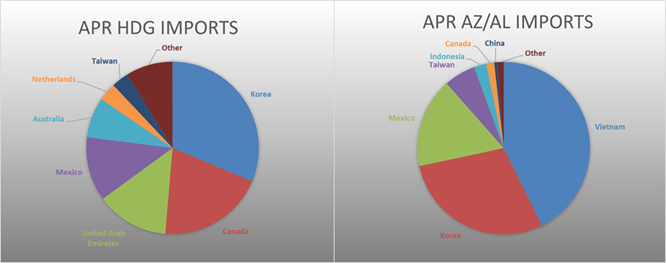
Below is April import license data through April 6, 2021.
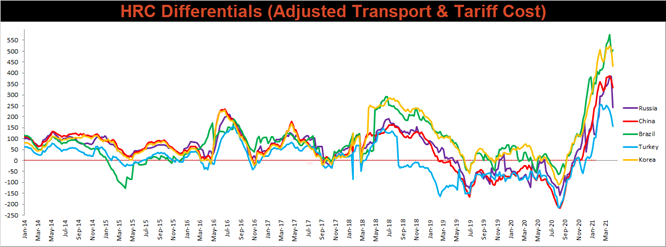
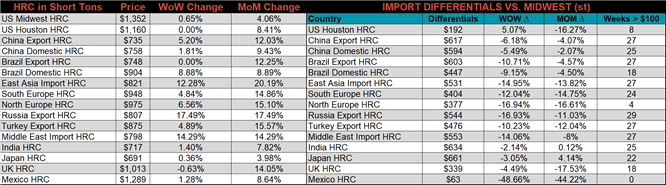
Below is the Midwest HRC price vs. each listed country’s export price using pricing from SBB Platts. We have adjusted each export price to include any tariff or transportation cost to get a comparable delivered price. All the watched differentials decreased, except for the Brazilian, as their respective export prices increased more than the also increasing U.S. price.
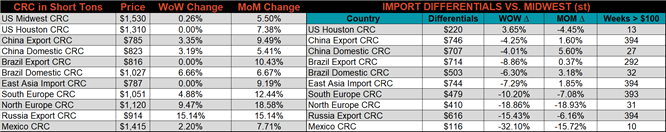
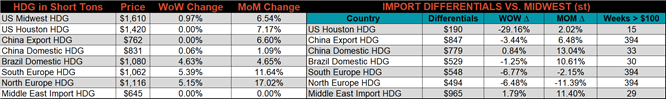
SBB Platt’s HRC, CRC and HDG pricing is below. The Midwest HDG, HRC & CRC prices were up slightly, 1%, 0.7% and 0.3%, respectively. Globally, the Russian export HRC price was up 17.5%.
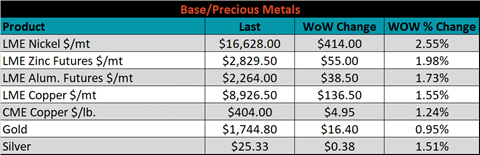
Raw material prices were mixed, May iron ore futures gained 4.6% while Midwest shredded scrap lost 3.1%.
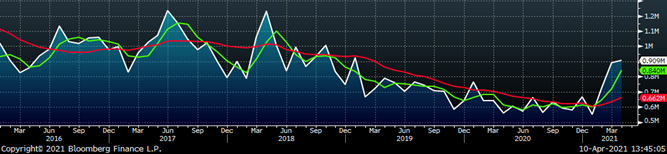
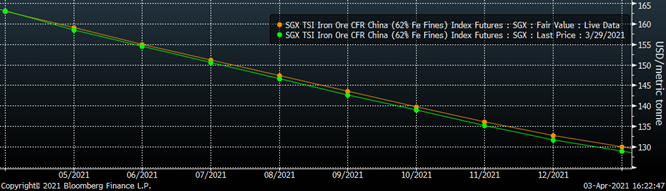
Below is the iron ore future curve with Friday’s settlements in orange, and the prior week’s settlements in green. Last week the curve shifted higher at all expirations.
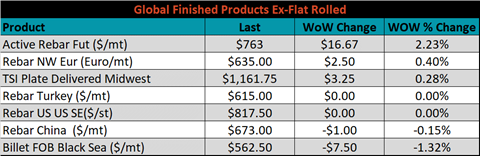
The ex-flat rolled prices are listed below.

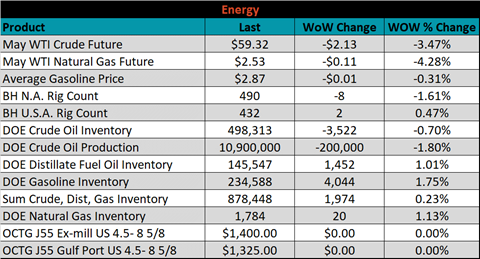
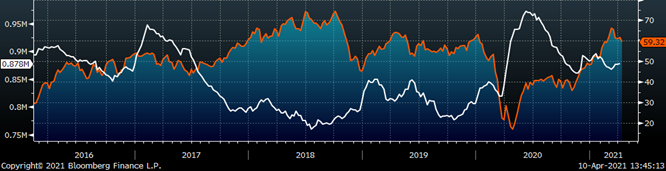
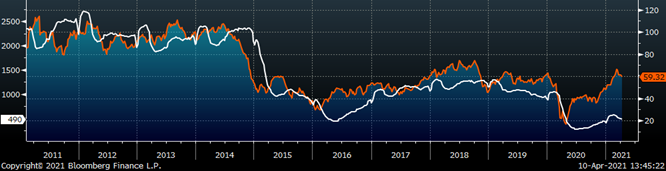
Last week, the May WTI crude oil future was down $2.13 or 3.5% to $59.32/bbl. The aggregate inventory level was up 0.2%, while crude oil production decreased to 10.9m bbl/day. The Baker Hughes North American rig count was down another 8 rigs, while the U.S. rig count was up another 2 rigs.
The list below details some upside and downside risks relevant to the steel industry. The orange ones are occurring or look to be highly likely. The upside risks look to be in control.
Upside Risks:
Downside Risks: